

The session name, also known as the logger name, is the identifiable name of the event tracing session. When you start a tracing session using programs such as WPR or Xperf, you are giving a name to the session either implicitly or explicitly. Most tools require an explicit name to start a trace, but WPR does not. WPR automatically creates a session name using the profile’s collector element if the user does not provide one. Because of this, most users do not realize that they can explicitly set the session name.
By setting the session name explicitly, you can control multiple tracing sessions. For example, you can start traces named A, B, C and then stop A, B, C or in any order. Starting and stopping multiple traces may seem intuitive but surprisingly not common user scenarios thus hidden in the command line in WPR. Let us find out how to control multiple tracing sessions in WPR and what session names mean in Event Tracing for Windows (ETW).
The session name in WPR
WPR does not require the user to provide the session name directly via the commandline option. Instead, WPR constructs the session name out of the collector’s name and the instance name. Taking the simplest custom profile that we discussed in the previous post as an example, if we start the profile WPR will create the session with the name, “WPR_initiated_WprApp_WPRSimpleEventLogger”.
The rule is:
WPR_initiated_ + Instance Name + EventCollector name or “WPR System Collector”
In the resulting session name the instance name and Event Collector name are the variables. In case of the SystemCollector, WPR does not use the SystemCollector name and instead uses the hardcoded “WPR System Collector”. That is because we want to start a single session for the system provider as we explained in Authoring Custom Profiles Part2. Since the Event Collector name comes from the profile file, the instance name is the real variable you can set through the command line.
The instance name
Let us find out how to set the instance name in WPR. The instance name is set through WPR/WPRUI command line option by adding -instancename somename at the end of the command. WPR -help advanced explains the instance name option.
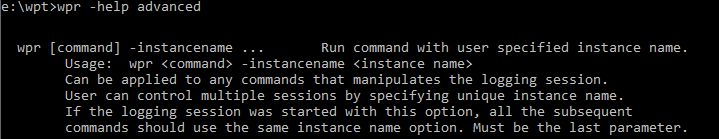
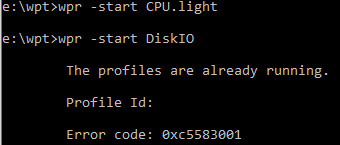
As the help text describes, you can just add the -instancename option to any command and that command will run with the instance name. There are two important things to remember. One is that if you don’t provide the instancename option, then WPR will use the default instance name “WprApp”. This is why you can’t start two traces in a row. If you do, you are practically starting two sessions with the same instance name “WprApp”. WPR starts the first trace successfully but returns E_WPRC_RUNTIME_STATE_PROFILES_RUNNING error for the second trace.
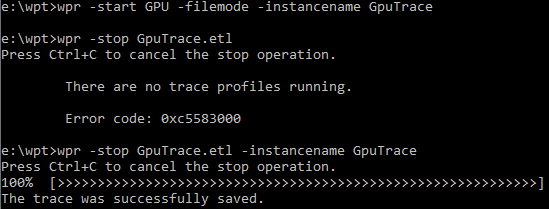
The other is that once you start the session with the specific instance name, you must use the same instance name to control or query the tracing session. As in the example below, if you start the trace with the instance name GpuTrace, then you must stop the trace with the same instance name. If you try to stop without giving the instance name, WPR generates E_WPRC_RUNTIME_STATE_PROFILES_NOT_RUNNING error, as you have not started with the default instance name “WprApp”.
Below is the example of commands that starts multiple traces and controls/queries the traces.
e:\wpt>wpr -start CPU.light -instancename TraceA (Starts trace with CPU.light profile)

e:\wpt>wpr -start Handle.light -instancename TraceB (Starts trace with Handle.light profile)

e:\wpt>wpr -status -instancename TraceA (Queries the TraceA session status)

e:\wpt>wpr -cancel -instancename TraceA (Cancels the TraceA session)

e:\wpt>wpr -stop TraceB.etl -instancename TraceB (Saves the TraceB session into the file)
Checking the running trace sessions
Sometimes it is useful to see currently running trace sessions in the system. Many tools can show running trace sessions, most notably Xperf and Logman. You can query active logging sessions using any of these commands. The Xperf -loggers command shows the providers and other details about each session, thus making very long console output. You would probably want to pipe the console output to the text file to review. Both tools can show a specific session by giving the session name.
Logman query -ets

Logman query <session name> -ets

Xperf -loggers

Xperf -loggers <session name>
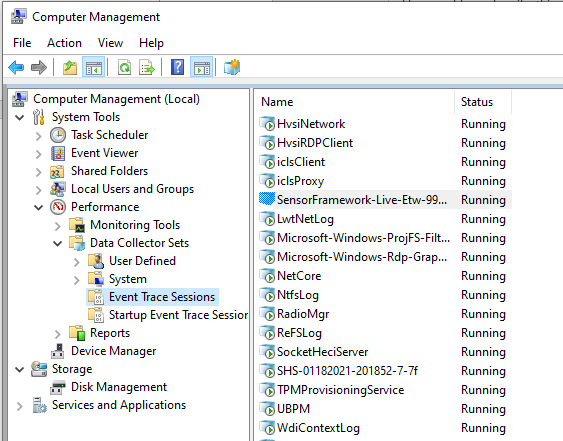
Above all, my favorite tool to see the active tracing sessions is the Computer Management control panel app in Windows. You can start the app by typing Computer Management in the Start Menu or compmgmt.msc in the command prompt. You can see the running trace sessions on your system under SystemTools -> Performance ->Event Trace Sessions.
The session name in ETW
If you are interested in how the session name is configured at an API level, the session name corresponds to the LoggerNameOffset in EVENT_TRACE_PROPERTIES structure. This structure is a required parameter of the StartTrace function, which starts the event tracing session. Once the StartTrace function succeeds, ETW returns the handle to the trace session. With this handle, further controlling of the session becomes possible, such as stopping, querying, and flushing.
Closing
In this post, I explained what the session name is in ETW and how to set the session name through WPR with the instancename option. By using the instancename option, I showed examples of commands that start multiple traces and control. Finally, I introduced the tools that can show the running traces on the system. With the tools like XPerf and WPR, controlling ETW sessions should become easier.
Hi Sowoon,
I think that WPK is really awesome tool. Is it possible to support monitor NDIS driver in WPK? Or do you have any method to analyze NDIS driver via WPK, like observe ndis.sys~~
Thank you very much for your blog posts, they are very interesting!
I'm trying to follow from the beginning and in your previous post (titled "Authoring Custom Profiles – Part 2") if I copy / paste the xml in a *.wprp file and load this file in the WPR UI it gives an error (" element has invalid value in the profile schema - Error code: 0xc5581006").
WPR version is: Microsoft Windows Performance Recorder Version 10.0.17763 (CoreSystem).
My guess is it's one of the keywords from the SystemProvider but the output from "wpr -profiledetails GeneralProfile" seems to indicates that the...
Hi, the error was caused by the bug in WPR. The error doesn’t happen all the time. The bug is fixed in the later builds. You need to use the insider version (20178 or later) of WPR to avoid the issue.