

In today’s world, the rate at which organizations are switching over to remote working is increasing on a regular basis. Therefore, maintaining collaboration across the global workforce, along with enhancing employee experience, has become the primary focus. This is also essential for maximizing operational resilience. To navigate these challenges in remote working—while ensuring better business performance—productivity management becomes a critical lever for competitive advantage.
Productivity management for an individual, a team, or an organization revolves around four components: The ability to plan strategically, taking a 360-degree view of data; staying focused on a task at hand; aided by minimized hindrance and encouraged by recognition; and finally, the ability to prioritize work and follow through consistently.
In this blog, we’ll look at how Microsoft Graph Data Connect and HCL Nippon takes a novel approach to navigating the challenge in a dynamic, hybrid workplace. We’ll focus on the benefits of using data-driven methods and get insight into the productivity of the team and employee wellness.
HCL Nippon
HCL Nippon automatically captures the time employee spends on work using his laptops through Nippon Buddy. However, if an employee makes calls using a device on which Nippon Buddy is not installed, the data is not collected. The goal of the solution is to leverage Microsoft 365 integration and improve the capability by capturing Teams data for calls placed on devices which do not have Buddy.
To learn more about Nippon Buddy: Nippon Buddy – Personal dashboard for employees only | Nippon Buddy – Personal dashboard for employees only (hcltech.com)
This data will also help us in the future to establish insights into the team’s collaboration and its impact on the productivity. This data will be very critical for any future AI based analysis use cases. To learn more about AI in the workplace, read Microsoft’s Work Trend Index | Will AI Fix Work? (microsoft.com)
Solution Overview
HCL Nippon is a contactless and automated solution that accurately captures effort and output data, keeping employee privacy at its core in a remote working environment. HCL Nippon correlates the two measurements and gives us an insight into the productivity of the team and employee wellness. The workforce management software empowers stakeholders with better workforce management, performance analysis, improvement measures, and eliminates workforce inefficiencies. These insights are made available to the end users using a friendly browser-based user interface.
Microsoft 365 Data + Nippon better together
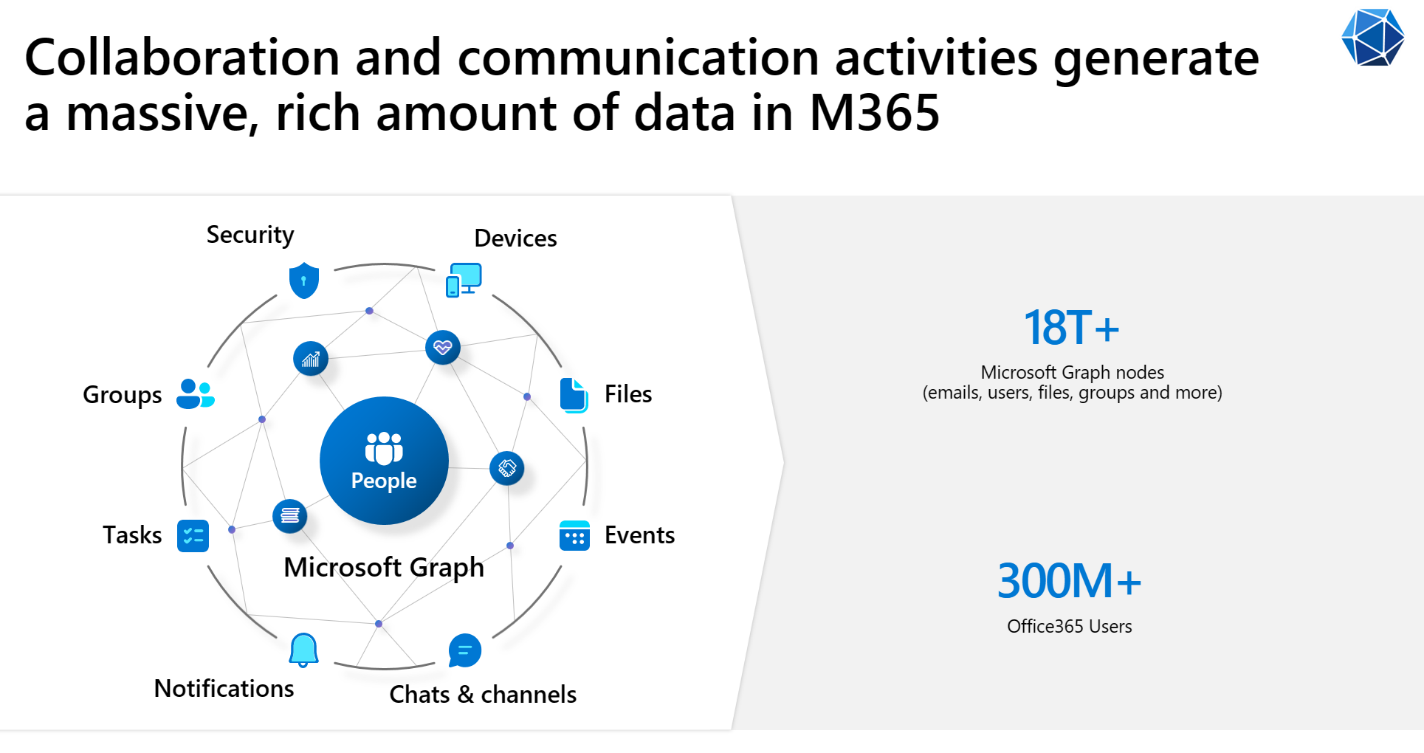
Microsoft Graph is the gateway to data and intelligence in Microsoft 365 (which includes Teams). It provides a unified model to access the tremendous amount of data in Microsoft 365 including Teams, Outlook, SharePoint, Viva Insights, and more. Use the wealth of data in Microsoft Graph to build forward looking business insights to unlock insights on customer relationships, business processes, security and compliance, and people productivity.
Access all your Microsoft 365 data though Microsoft Graph Data Connect
To access your Microsoft 365 data in the Microsoft Graph for enterprise analytics, we use Microsoft Graph Data Connect which a secure, scalable solution that enables you to copy relevant Microsoft 365 datasets into Microsoft Fabric.
In the below diagram, you can see just some types of Microsoft 365 data that organizations get though Microsoft Graph Data Connect. There are datasets available from a wide variety of Microsoft 365 sources, including Azure Active Directory, Outlook, Teams, SharePoint, Viva Insight, and Microsoft Groups—and the list is growing. For the full list: Datasets, regions, and sinks supported by Microsoft Graph Data Connect

Microsoft 365 datasets comes ready for analysis. We deliver data in three formats: basic, cleaned, and curated.
- Basic datasets: Datasets generated from raw customer created content and inputs from M365 Applications and Services
- Cleaned datasets: Datasets generated by either normalization and de-duplication from Basic Datasets. Or datasets created from user activity or behavior signals in M365.
- Curated datasets: Datasets custom generated for a specific use case or analytics scenarios. Or datasets from 1P M365 analytics application for their extensibility.
In this solution, call record data (shown in the image above under the Teams column) is retrieved from Microsoft 365 in batch mode for a certain period using Microsoft Graph Data Connect.
Product Use Cases
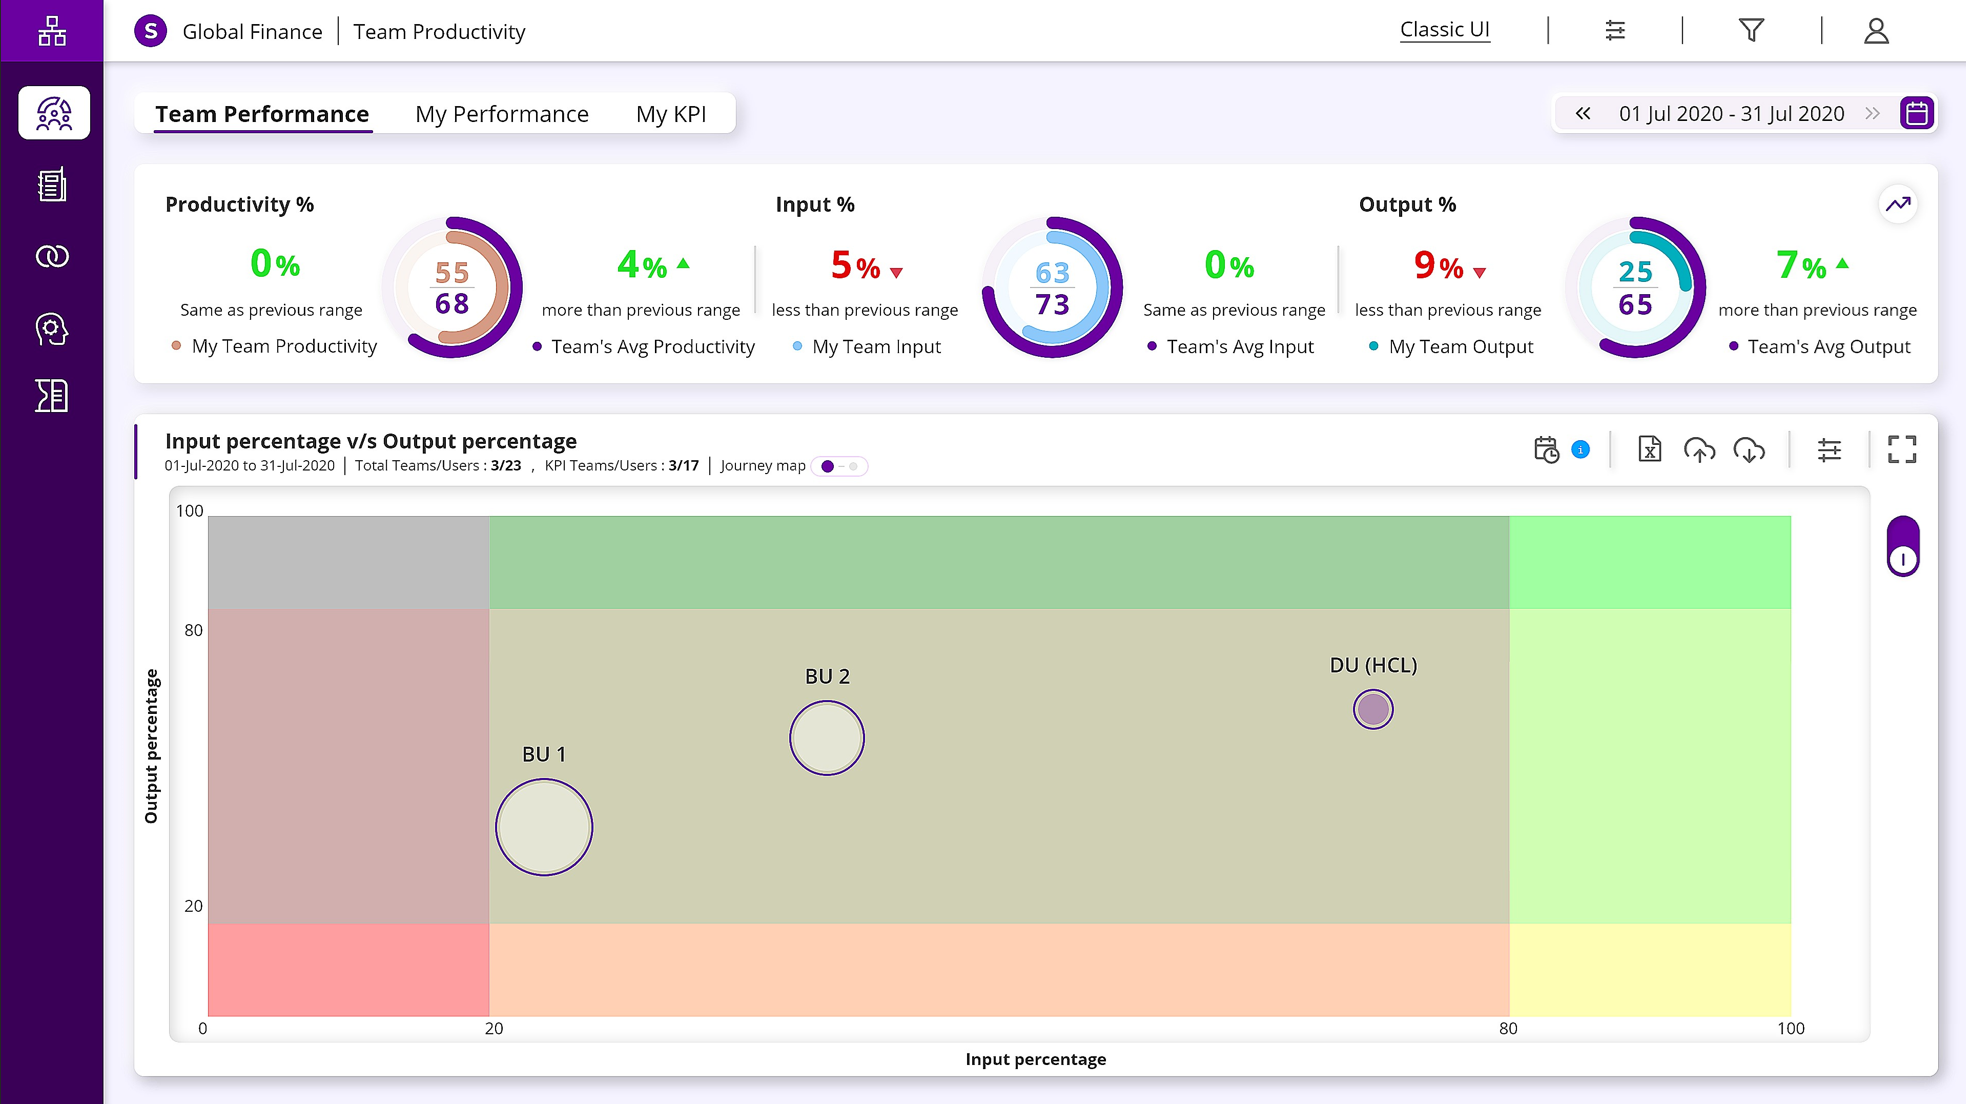
Overall team productivity (shown below). This is calculated based on effort spent by the team vs the output it produced. Here are some of the key insights from the visual below:
- Top: Compare vs other teams and across different time periods. Teams Performance can be tracked across input, output, and productivity (shown in the top bar). Productivity is calculated metric based on the input and output scores. Managers who lead teams can get a clear view into how their team is performing compared to other teams and understand the trends by tracking across specified date range (ie. quarters/months).
- Bottom: Input vs. Output. Shows a scatter chart where the sub teams are plotted based on their effort and KPI utilization (shown in bottom chart). In the below example, BU 2 node has roughly the same output as DU (HCL) node but the output is required input for that same level of output is significantly higher for the DU (HCL) node.
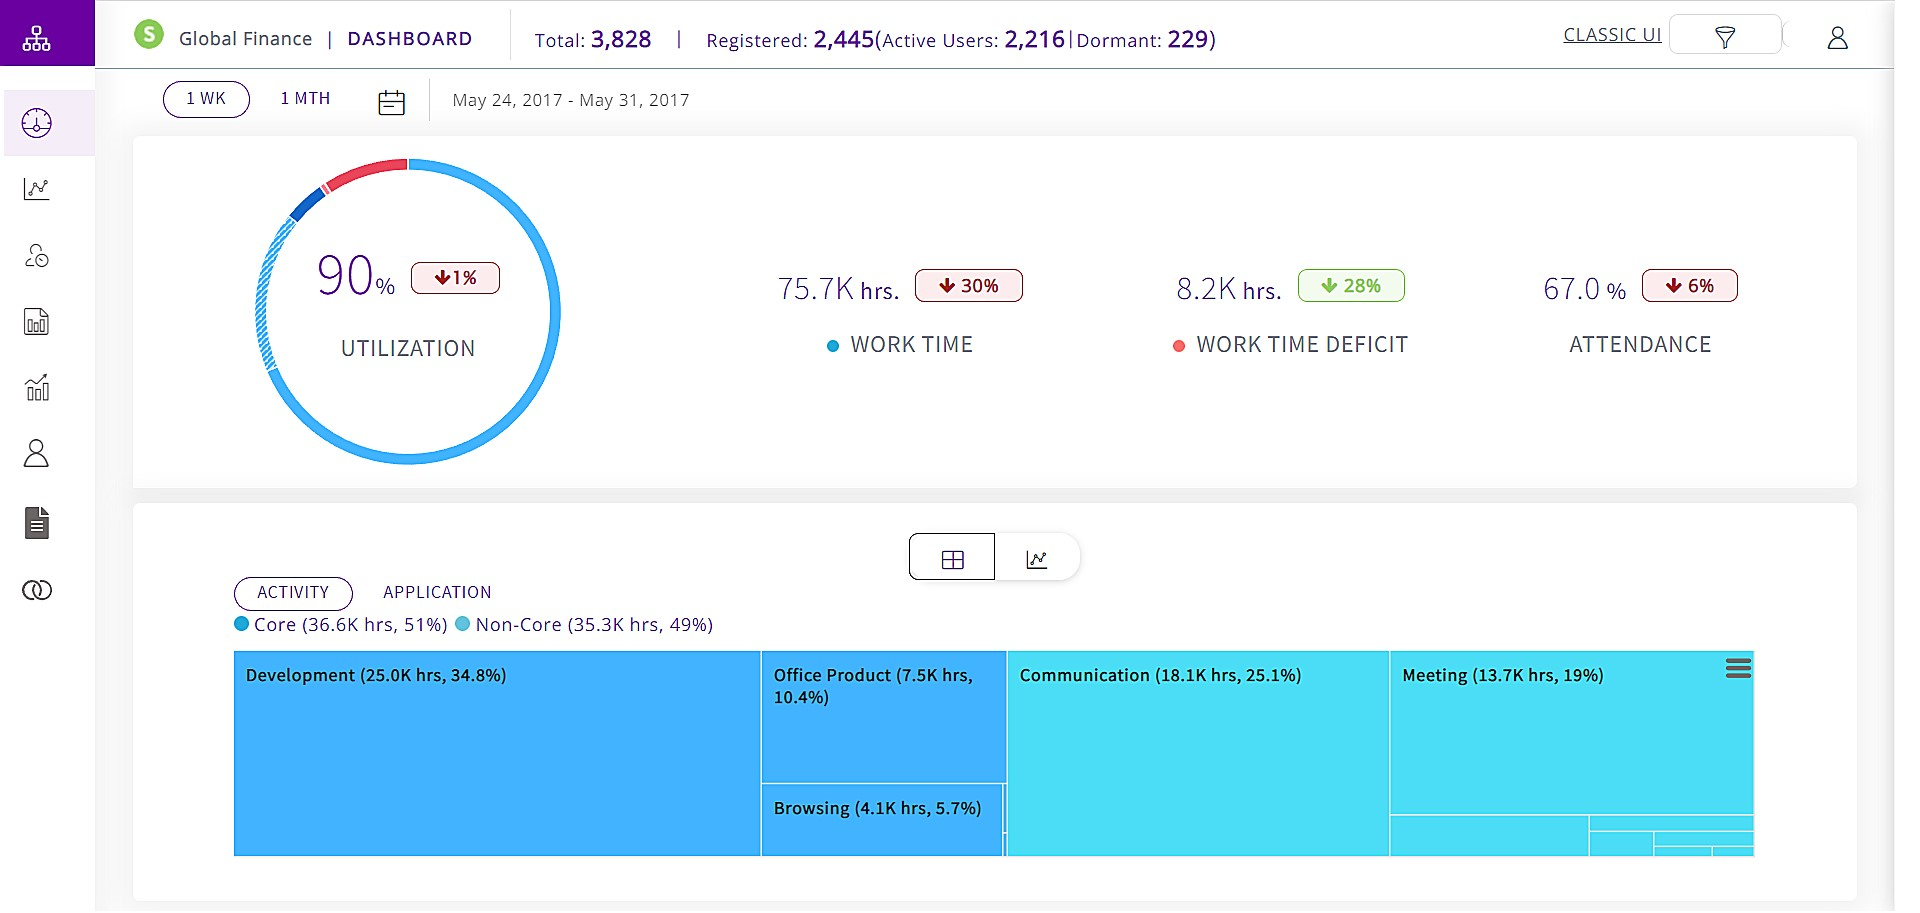
Overall time utilization (shown below). Time is the most important resource for any organization so it’s key to have a view of activities where time is spent. This enables leaders to reprioritize and reinvest their employees time into high impact activities that drive business growth. Here are some of the key insights from the visual below:
- Top: Time Utilization Breakdown. It also shows overall work hours logged in a week by the organization. For example, the work time was 75.7K hours while the work time deficit (time not working) was 8.2K hours. This results in a utilization score of 90%. We can also see the trend of work time which us down 1% compared to the previous week.
- Bottom: Core vs Non Core Activates. We can see the top 5 activities where the team is spending time. In this case, only 34.8% of total time is spent on development. Over 49% or 35.3K hours of total time is spent on non core activities consisting of communication, meeting, and other miscellaneous activities.
Conclusion
By focusing on data driven insights, HCL Nippon helps promote a culture of continuous improvement that empowers everyone in your organization to set and achieve big goals by delivering full clarity into efforts across the enterprise.
Microsoft Graph Data Connect and HCL Nippon quickly and securely transform existing, rich productivity data into proactive, data-driven insights. Nippon powered by Microsoft Graph Data Connect helps leaders to develop effective strategies to empower their most valuable resource: their people.
Next steps
Take advantage of the HCL Nippon and Microsoft collaboration to transform your organization’s employee data for data-driven insights and address employee productivity & wellbeing.
Niranjan Karhade: niranjan.karhade@hcl.com
Director – HCL Nippon
For additional questions, please reach out to the Microsoft Graph Data Connect team.
0 comments