

Hi everyone, we are near the end of year. Looking back on 2022, there are a few highlights that we wanted to share with you all:
Highlights from 2022
Major Visualization Experience Upgrade for Spring Boot Extensions
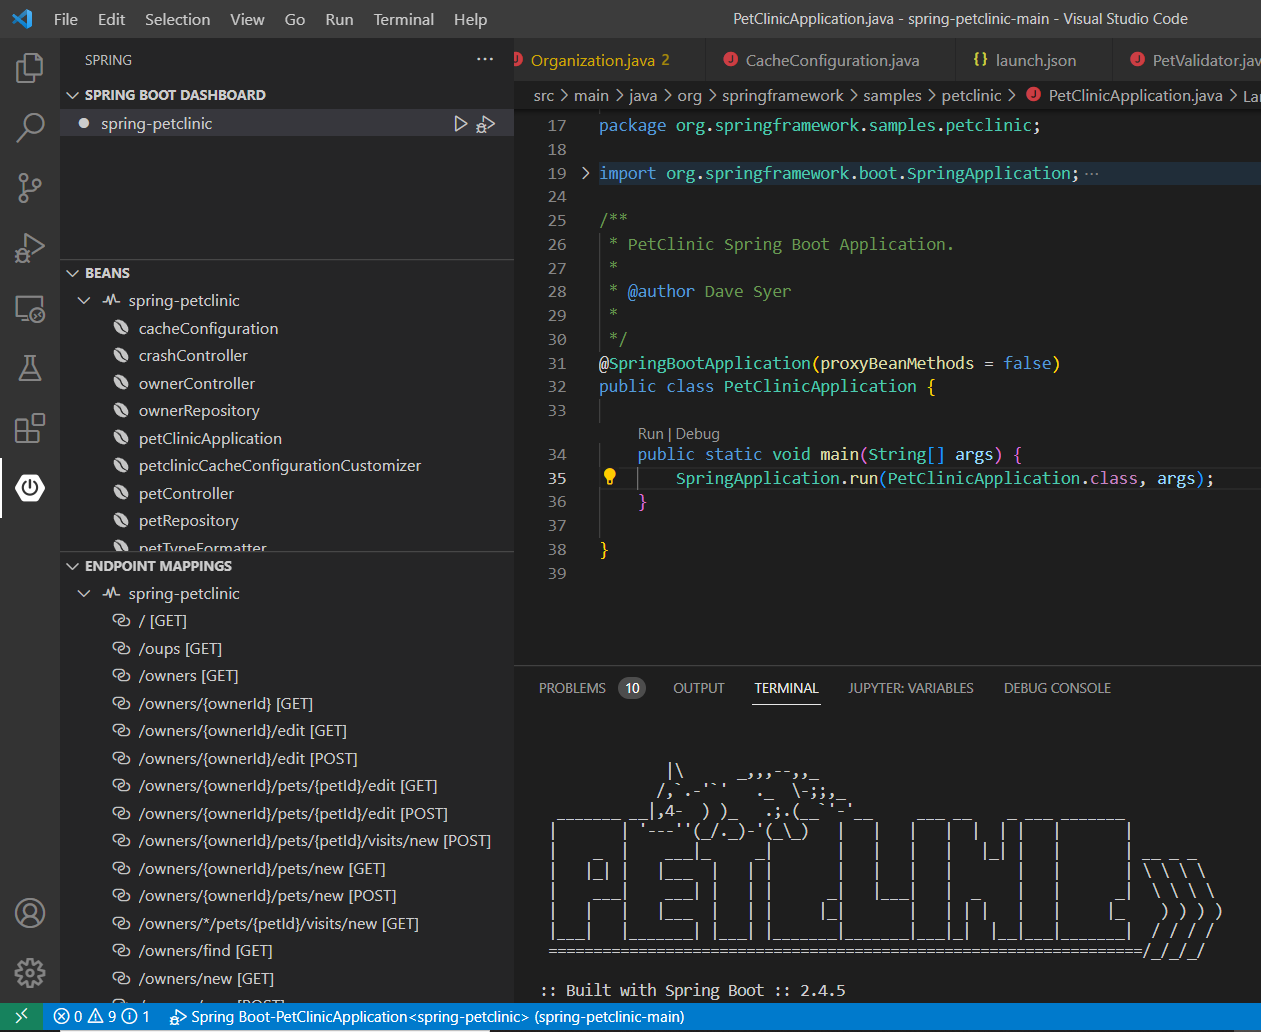
Starting earlier this year, we began to make a series of improvements on Spring Boot dashboard, aiming to increase Spring developer’s productivity on Visual Studio Code. This includes the beans and endpoints mapping view, more live information display for Spring applications and the brand new memory as a graph. We hope that these improvements make it easier to develop Spring applications and observe the state of application when it’s running.
Fundamental Coding Experience Improvements
Coding experience matters. In 2022, We have made a series of important improvements to make Java developer’s daily coding life easier than ever. This includes postfix completion like IntelliJ IDEA, more shortcuts to generate code snippets , signature help optimization and so on. Fundamental experience will continue to be our focus going forward.
Built-in Lombok support
Project Lombok is a popular and widely used Java library that is used to minimize or remove the boilerplate code. Starting in July, our Java extensions can directly support projects that are using Lombok without installing any additional extensions. We also want to thank @GabrielBB who started the original Lombok extension. You can find how to enable the Lombok support in this blog post.
Two million Java developers on Visual Studio Code
In November, we shared the news that there were two million Java developers on Visual Studio Code, this was an important milestone and we wanted to thank for all the support from the community, thank you!
In addition to the highlights from the 2022, let’s look at the new features from the latest release!
December 2022 Update
Spring Boot – Live Memory View
As the highlight of this month’s update, we are introducing a new graphical memory view as the newest addition to the Spring Boot Dashboard. This feature is a result of collaboration between VMWare and Microsoft (special thanks to @vudayani-vmw, @martinlippert, and @Eskibear). The memory view visualizes the memory and the garbage collection activities of a running Spring Boot application, much in the same way than the Spring Boot Dashboard already provides you with insights into running Spring Boot applications like active beans and request mappings.
There are four graphical real-time visualizations available under the memory view:
- Heap memory – provides a stacked overview of the different heap areas, the total memory used and total memory size in the JVM
- Non-heap memory – displays a stacked overview of the different non-heap regions in JVM relative to the total memory used and total memory size
- Gc Pauses – depicts the frequency and duration of pause time for a GC event
- Garbage Collection – displays the count of the GC events in the application
The memory view uses the Spring Boot Actuator data to gather the data from the running application, in the same way the other live data from running Spring Boot applications is gathered from running Spring Boot applications. So as soon as you have the Spring Boot Actuator dependency on your project, you will be able to use the live memory view.
In contrast to the beans and request mapping views of the Spring Boot perspective in VSCode, the memory view displays information from one specific running Spring Boot application only, it does not visualize the data from multiple running applications simultaneously. Therefore, you can select which application the view should visualize directly inside the view.
Here is a demo for this live memory view feature. Please note this feature is only available when you start an application from Spring Boot dashboard.

Annotation processing support in Gradle
Annotation processing is a Java compilation option which has been around since Java 5. It enables the generation of additional files during compilation, such as classes or documentation. If we are using Gradle and want to use annotation processing, we do this by marking a particular dependency as part of the annotationProcessor dependency configuration. For example:
dependencies {
    annotationProcessor 'org.mapstruct:mapstruct-processor:1.3.1.Final'
    ...
}
In our latest release, we have supported annotation processing in our Gradle for Java extension, so if you have annotationProcessor marked in your dependencies, you will be able to see your generated files during compilation. Here’s a demo for this feature.

User Experience – Better Build Error Message Prompt
When our extensions detect a build error in the project, usually there is a pop-up that prompts the user to take certain actions. However, previously there are certain limitations with this pop-up. In our latest release, we have made improvements regarding two main scenarios.
Projects without build tools (Unmanaged folder)
Previously, if there are multiple folders in the workspace, and only one of the folders has errors, and the user is trying to run the other folders, we will still prompt the user with build error pop-up, which is not good user experience. We have improved this behavior and now we will now only prompt the build error message if the current folder has an issue. Here’s a demo.
Maven project
We have also made improvements for Maven project. If you have a multi-module project and there is an error in one of the dependencies, we will prompt you with the build error message. However, as soon as that error is fixed, the prompt will be gone and you will be able to run the application smoothly. Please see the demo below.

Last but not least, you might have noticed, the prompt now has changed to “Continue”, “Always Continue”, Fix” to be more straightforward to the user.
Visual Studio Code Java in 2023
Once again, we want to thank everyone for all the awesome support in the past year. We wish everyone a merry Christmas and happy new year. There will be many great updates coming in 2023, so please stay tuned, and see you in next year!
Install Extension Pack for Java
To use all features mentioned above, please download and install Extension Pack for Java on Visual Studio Code.
If you are a Spring developer working on a Spring Boot application, you can also download the Spring Boot Extension Pack for specialized Spring experience.

Feedback and suggestions
As always, your feedback and suggestions are very important to us and will help shape our product in future. There are several ways to give us feedback
- Leave your comment on this blog post
- Open an issue on our GitHub Issues page
- Send an email to: vscjfeedback@microsoft.com
Resources
Here is a list of links that are helpful to learn Java on Visual Studio Code.
- Learn more about Java on Visual Studio Code.
Working with VSCode in Java has come a long way - though I have historically used IntelliJ for Java projects, I am once again looking to see whether I can use VSCode for them.
The major thing I have currently impacting productivity is IntelliSense; whilst this has improved over the year, I still find that it is much slower compared to IntelliJ - a latency of ~2 seconds compared to less than 1 (near instant) with IntelliJ. Is there scope to improve this? That said, after a little warm up, IntelliSense is able to suggest albeit still not as instantaneous...
Hi Shamil, thank you for comment as well as valuable feedback here. Code completion performance and quality is always one of the our top priorities. An example was code completion performance improvement in this blog post (https://devblogs.microsoft.com/java/java-on-visual-studio-code-update-october-2021/). We also have telemetry and chart to monitor the latency for users overall. If it is an issue for you, then it means something along the way is probably not performing well, it could be a case-by-case analysis. Please feel free to open an issue on our repo(https://github.com/microsoft/vscode-java-pack) and provide some additional info, and our team can help debug it for you.
Always look forward to reading these monthly updates. You folks are delivering features month-after-month at a staggering rate.
VS Code has blossomed into a fantastic JVM development platform these last ~2-3 years, at least for both Java and Scala (with the Metals) extension.
No luck for Kotlin yet, but I’m holding out hope ;^)
Thank you! We will keep delivering features in 2023 so stay tuned :). Please let us know if there is anything we can do to improve. Many developers ask for Kotlin as well so we are currently evaluating the feasibility, thanks!