

In our last engagement we had the opportunity to work with one of our partners on very large scale Monte Carlo simulations in the cloud. By large scale, I mean very large scale, up to 400.000 simultaneous compute cores.
At this scale (or even smaller scale) we can start making a real difference when it comes to carbon (CO2) emissions by making some smart choices while planning and orchestrating the computations.
This post is a walkthrough of some of the ideas we worked with, and how you can also use these concepts when working on your own applications.
Fun fact: It might be hard to comprehend how large this scale is, but to give an example of the issues we ran into, one was that we needed to discuss with the individual Azure regions to verify that we could get allocated capacity to execute these simultaneous on that many compute nodes.
An Azure region like West Europe or East US consists of multiple data centers.
Background of the problem and solution
Our partner (working in the energy sector) needs to simulate their production facilities with a lot of different parameters, and over a long period of time, to determine where, when and how big they can make their new production sites.
Each simulation was a job with multiple stages, each with a collection of computation tasks (where each task takes around 3 minutes) and once all the computation tasks complete, the data is consolidated and moved to the next stage of the simulation using a MapReduce pattern. One such stage, can have up to 20.000 individual computation tasks that could execute in parallel.
We were asked to help them move these simulations from their on-prem supercomputer to the Azure cloud, to allow for the large variations in compute needed. As part of this journey they were also very interested in lowering the CO2 emissions as much as possible. All within acceptable cost of lowering the CO2 emissions. I.e. it is reasonable to pay a bit more for a large gain, but not a lot more for very little gain.
These jobs takes a long time to process. In theory we could spin up a large number of compute nodes to complete the job as fast as possible, but this would not be very efficient as starting a virtual machine and stopping takes time.
Azure Batch was the ideal solution for this problem. Azure Batch is a fully managed High Performance Compute (HPC) platform for cloud-scale job scheduling and compute management.
What can we do to reduce CO2 emissions?
Green Software Foundation has defined a a set of green software principles that can be used to guide us in making our software more green.
- Carbon Efficiency: Emit the least amount of carbon possible.
- Energy Efficiency: Use the least amount of energy possible.
- Carbon Awareness: Do more when the electricity is cleaner (more nuclear and renewable power sources) and do less when the electricity is dirtier (more fossil fuels).
- Hardware Efficiency: Use the least amount of embodied carbon possible.
- Measurement: What you can’t measure, you can’t improve.
- Climate Commitments: Understand the exact mechanism of carbon reduction.
Above are all guiding principals that we should strive to follow. Below is not an exhaustive list, but just a few examples of how we can make our software more green:
- Hosting in the most efficient data center.
- Keeping a high utilization of the hardware. Don’t let the hardware idle. E.g. Azure Advisor has simple rules to help you right-size your virtual machines.
- Turn off hardware when not used. Such as Azure Web App auto-scaling or Azure Kubernetes Service auto-scaler. If possible scale to zero.
- Writing efficient code that uses the least amount of CPU cycles possible.
NOTE: Lots of energy and money is wasted on cooling of servers. Hyper scale data centers, such as Azure, are generally the most efficient. The hyper scale data centers are continuously optimized and often located near renewable energy sources. Read more about Microsoft’s work to make Azure efficient.
In this post we will focus on the carbon awareness. During the engagement we addressed all the green software principals.
Location matters
We know that each country or even part of a country has its own mix of energy sources for electricity, and the sources vary greatly when it comes to how much CO2 they emit.
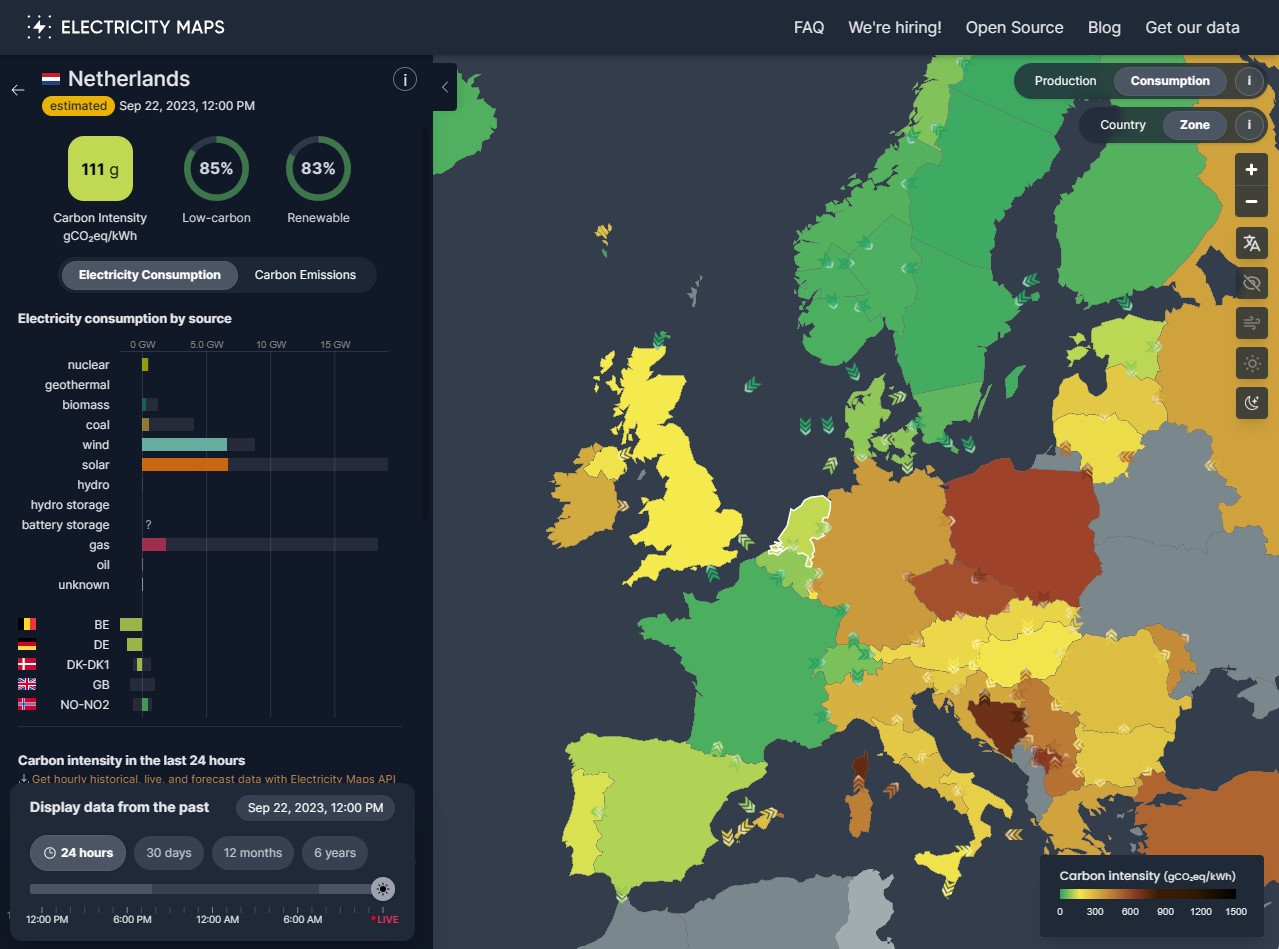
Looking at an example (using Electricity Maps) we can see that at one given moment, the Netherlands, where the West Europe Azure region is located, had an electricity mix of mostly wind, solar and gas which yields and average of 111g CO2eq/kWh. Meaning the carbon intensity of the electricity in that region is 111g CO2eq/kWh.
NOTE: CO2 intensity is the amount of CO2eq emitted per kilo watt hour (kWh) produced. CO2eq (CO2 equivalent) is a measure of the global warming potential of the gas, taking into account the different global warming potential of different gases. E.g. methane has a global warming potential of 25, meaning 1 gram of methane is equivalent to 25 gram of CO2.
 At the same time North Central Sweden, where the Sweden Central Azure region is located had an average mix of 15g CO2eq/kWh due to relying almost solely on renewable energy sources like wind and hydro over coal and gas.
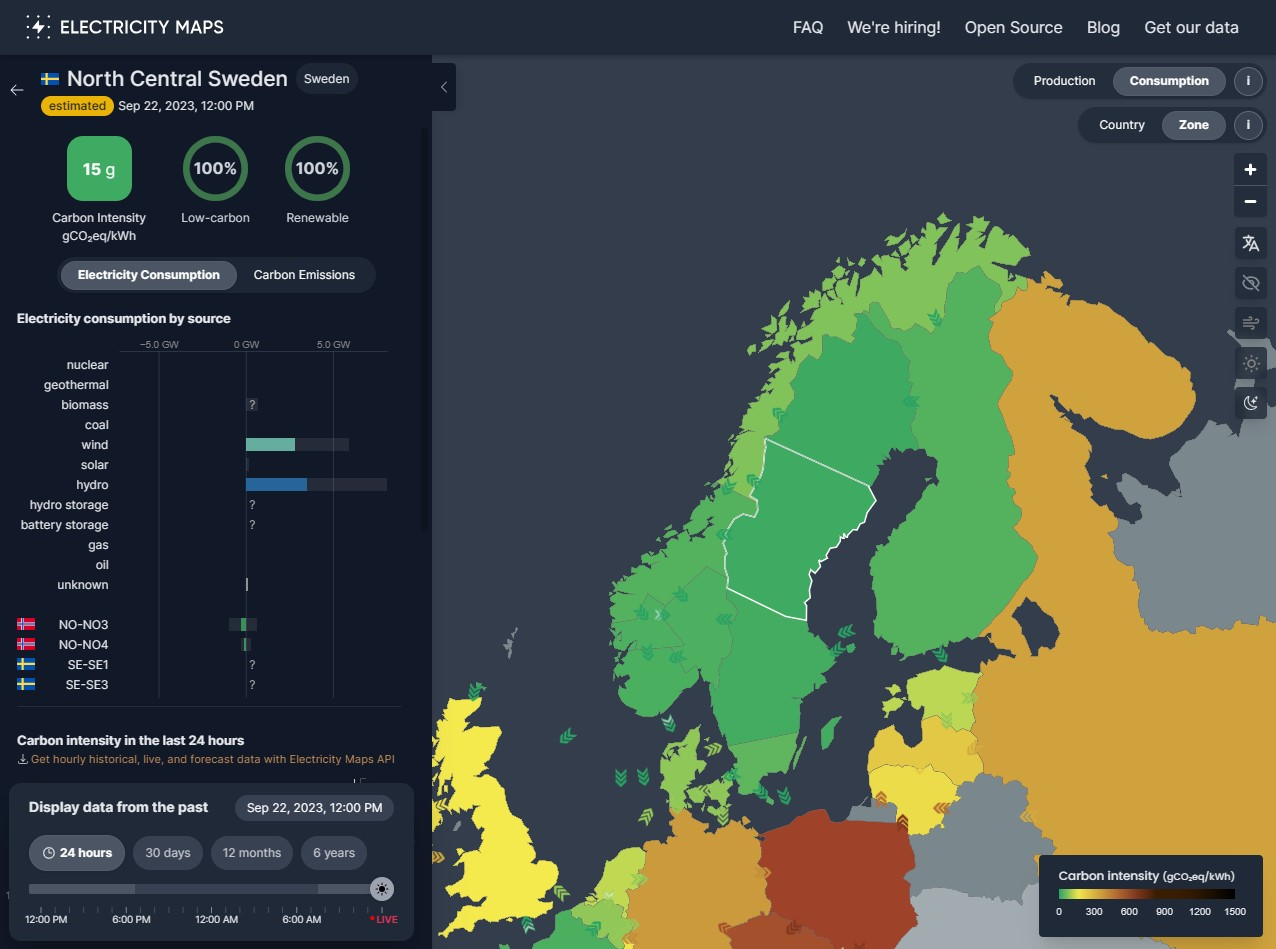 It should be noted though, that this is an average mix for that region, it doesn’t necessarily mean that the actual electricity from the outlet has exactly this carbon intensity, but as electricity flows freely within a grid region, it is an average of all the electricity within the grid region.
Looking at only these figures, and only this moment in time, it would stand to reason that just moving the compute to Sweden Central, we would reduce the CO2 footprint of a simulation by an order of 10 which is a significant saving. We will get to how we can calculate the savings later.
Electricity maps and WattTime both offer an API to get near real time data, but even a static selection of where to host your workload can make a big difference.
How modern your data center is matters
Another factor on location, that is unfortunately a bit harder to measure, is that the data centers are not built at the same time, and new data centers are added continuously. Because of this volatility we could not use this to guide our decisions, but essentially newer generation data centers are significantly more energy efficient than older ones.
Time matters
While some regions are pretty stable over time in their CO2 intensity, others vary greatly throughout the day, and over months and seasons. As an example, on a sunny day, the CO2 intensity in Netherlands may be 111g, but at night where solar is not available, they may resort to coal or gas yielding a very different CO2 intensity.
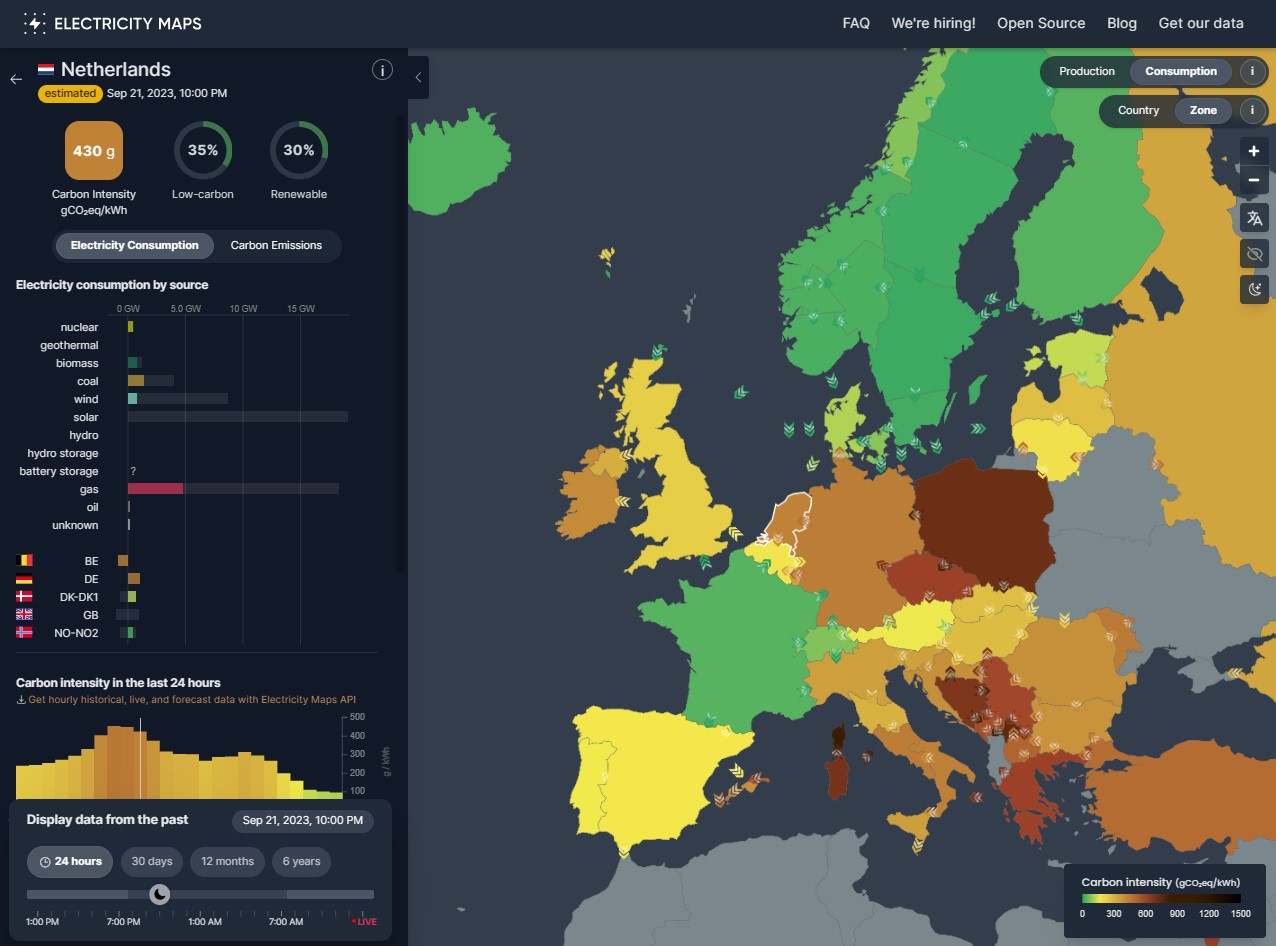
In other regions it may be better to schedule jobs at night when factories and other high energy consumers do not use all the energy, to avoid causing a need to import energy or use non-renewable or low-carbon sources.
Spot nodes and dedicated VMs
Another big influence both on energy usage and cost is spot vs dedicated VMs.
The idea behind spot nodes instances is that, instead of allocating a set of VMs that you may or may not use, you take the “leftovers” from others dedicated VMs when they are not using them. That way the VMs capacity is used better as they are not idling.
The benefit of this, apart from fewer idling VMs is that you get a discount of up to 90% compared to dedicated VMs.
The downside, of course there is no free lunch, is that your workload may be evicted at any time, if the spot prices are higher than you are willing to pay or Azure no longer has compute capacity.
This means that if you run a long-running workload, you may loose your data at any given point so you need to make sure that you have frequent backup points. In our case however, this was not an issue, our individual tasks were approximately 3 minutes long, so if we got evicted it was as easy as re-running the job requesting a new node.
Carbon aware compute
We worked with the Green Software Foundation to extend their open-source Carbon Aware SDK (CA-SDK) to support both time and location shifting. The CA-SDK can help you figure out when and where the workload can be executed with the least amount of carbon emissions.
- Time insensitive workloads execution can be postponed into the future.
- Workloads can be moved to other data centers.
Not all workloads are feasible to move from one data center to another. If the workload requires a large amount of data to process, then the energy required to move the data to another data center might outweigh the savings of processing in the greener data center.
An example of using the CA-SDK to get the best time to execute a 10 minute workload from the current time until next morning:
GET emissions/forecasts/current?location=swedencentral&dataStartAt=2023-10-24T14:00:00Z&dataEndAt=2023-10-25T08:00:00Z&windowSize=10In the above example we mapped the location
swedencentralto a longitude and latitude of the Azure region, but you can use longitude and latitude or map to a name to any location you want.
The result of the query will include the optimal time for execution and a forecast of the carbon emissions for the period specified.
[
  {
    "location": "swedencentral",
    "dataStartAt": "2023-10-24T14:00:00Z",
    "dataEndAt": "2023-10-25T08:00:00Z",
    "windowSize": 10,
    "optimalDataPoint": {
      "location": "swedencentral",
      "timestamp": "2023-10-24T23:30:00Z",
      "duration": 10,
      "value": 27.4451043375
    },
    "forecastData": [
      {
        "location": "swedencentral",
        "timestamp": "2023-10-24T14:00:00Z",
        "duration": 10, // minutes from the timestamp
        "value": 64.02293146
      },
      ...
    ]
  }
]
CA-SDK is open-source and an API, CLI and a C# SDK.
Balancing cost vs CO2 emissions
For the sake of the environment on planet Earth we should strive to limit the amount of carbon emissions. However your workload might not be the best investment for the enterprise to funnel their sustainability efforts. There might be other projects within the enterprise with low hanging fruits that can lower carbon emissions a lot more with the same investment.
The business stakeholder challenges we faced were:
Paying 5% extra for a 50% carbon emission reduction is fine, but paying 50% for a 5% carbon emissions reduction is not.
To solve this challenge we needed a way to prioritize any additional cost of moving the workload to another Azure region over the carbon emissions reduced. Moving a workload to another Azure region will incur a cost of moving the data and the price for the same Azure resource might differ too.
We built the open-source Carbon Economy SDK (CE-SDK) to solve this problem. It uses the CA-SDK to get the must optimal time and location for execution and then the CE-SDK uses the Azure retail pricing API to calculate the cost of moving the workload to another Azure region. The CE-SDK does not move the workload or calculate the cost of moving, but it can be used to make a decision on where and when to execute the workload.
The CE-SDK uses a normalized weight to prioritize any lower carbon emissions over any additional cost.
That way the business stakeholder can decide how much they are willing to pay for a lower carbon footprint.
Scaling up and down
Almost all workloads whether it is an online shop or batch simulation have peaks and valleys in their compute needs. To be able to scale up and down is a key factor in reducing the carbon footprint of your workload.
This is something you can do on-premise, but it is much easier to do in the cloud with a simple API call. Platform as a Service (PaaS) solutions like Azure Batch and Azure Web App has build-in auto-scaling capabilities that can help you scale up and down based on your workload.
In our case we could scale from zero to 400.000 cores. More importantly we could scale down to reduce CO2 emissions when compute power was not needed.
A web server can normally not scale to zero as you never know when a user will hit your site. However you can scale down to a single instance during the night when you know that no users will hit your site.
Calculating carbon emissions
Green Software Foundation has developed the Software Carbon Intensity (SCI) Specification that can be used to calculate the expected kWh usage of your workload.
The formula is:
SCI = ((E * I) + M) per R Where:
- E = Energy used by the software (electricity consumed to run VM, cooling, network, etc.).
- I = Carbon intensity (the amount of carbon emitted per kWh).
- M = Embodied carbon (the amount of carbon emitted during the creation and disposal of a hardware device).
- R = Functional unit (e.g., carbon emissions per additional user, API-call, or ML training run).
Example of calculating for a server running for 1 hour:
- 400 watt server (which consumes is 0.4 kWh).
- 1000 kg CO2 embodied carbon to manufacture, transport and dispose of the server. With a lifespan of 4 years that is 28 g CO2 per hour.
1000 kg / (4 * 365 * 24) = 28 g CO2eq/hour. - 216 carbon intensity based on the electricity in region where the server is located in that hour.
- 398 orders processed in the that one hour.
To simplify the calculation we ignore cooling, networking etc.
SCI = ((0.4 * 216) + 28) / 398 = 0.31 g CO2eq/orderWith the simple and clever formula it is evident what you can do to reduce the carbon footprint of your workload:
| Parameter | Action | |
|---|---|---|
| E | Energy | Lowering the electricity consumption with more efficient hardware, better cooling, etc. |
| I | Carbon intensity | Greener electricity by lowering the CO2 emitted for electricity production with low-carbon or renewable sources. |
| M | Embodied carbon | Improved hardware manufacturing methods or extending the lifetime of the hardware. |
| R | Functional unit | Increasing the throughput e.g number of orders/messages/etc. processed. This is not always in your control. |
Calculating Azure carbon emissions
Microsoft provides the Emissions Impact Dashboard for Azure and Microsoft 365. It is a great tool to get an overview of the carbon emissions of your Azure resources. However it is not possible to get the carbon emissions of a single resource or system.
The authors know of no data center operator or cloud provider that provides this level of detail, as of writing.
In our case, we focused on the carbon emission reductions. With some of the actions we took, we could not measure the carbon emission reductions as we do not have data available:
- We went through regions testing to find the most efficient VM SKU to execute the workload.
- We made sure the VM CPU utilization was as close to 100% as possible.
- We scaled the cluster to meet the workload needs.
- We used Azure spot instances to utilize existing hardware and lower cost.
Above actions are all good for the environment, but we could do more with carbon awareness. Meaning we could move the workload to another Azure region with a lower carbon intensity or postpone the workload to a time with a lower carbon intensity. This enabled us to compare the carbon emissions of the workload in the original Azure region with the carbon emissions of the workload in another Azure region.
- The reduction or increase of carbon emissions postponing the work to later in time via time shifting.
- The reduction or increase of carbon emissions moving the workload to another Azure region via location shifting.
Revisiting the Software Carbon Intensity formula, it meant:
- E is static, as the same hardware is used in both regions.
- I is different for each region and we can look it up via Electricity Maps API.
- M is static, as the same hardware is used in both regions.
- R is static, as the same workload is executed in both regions.
Above is a simplification as data needed to be moved from one region to another, but the carbon emissions is negligible compared to the compute.
That way we could calculate the relative savings of delaying the workload or moving the workload to another Azure region, just be using the carbon intensity of the two regions.
Would you like to to see carbon emission data for your Azure resources? The vote for this feature on the Azure feedback forum.
Our solution
In our solution, we decided to set up clusters of nodes in different regions. Whenever a new job was submitted, the simulation owner got to make a decision on how important cost vs CO2 intensity was, to guide our decision on where and when to schedule the job.
We then consulted the Electricity Maps API to give us a set of Azure regions and time slots ordered by CO2 intensity.
We also gathered data about the predicted cost of spot instances vs dedicated nodes in the different regions, and the queue lengths for our clusters, and combined all of this together with the job owner preferences of cost vs CO2 to make a decision of when and where to schedule the compute.
It should be noted that moving the operation to another data center is not a no-op, we had to incur costs/compute time by moving the input data and ultimately the output data cross regions, but in the scheme of things, this turned out to be a negligible cost.