

At some stage during a project, almost every developer has hit the point where they need to improve the performance of their code. Generally, for .NET projects, the go-to tooling would be Visual Studio’s built in profiler. This works brilliantly if your service is running on your local machine, but unfortunately our situation was a little more complicated.
In our engagement, we were developing a solution to create a mesh of devices and share data and apps between them. The solution included a Kafka instance for internal messaging and a number of microservices. These included services for configuration, discovery, and a service for syncing Kafka topics between devices. It was the syncing service that we wanted to profile in order to find performance improvements which could increase throughput.
A simplified view of our design looks a little like this:
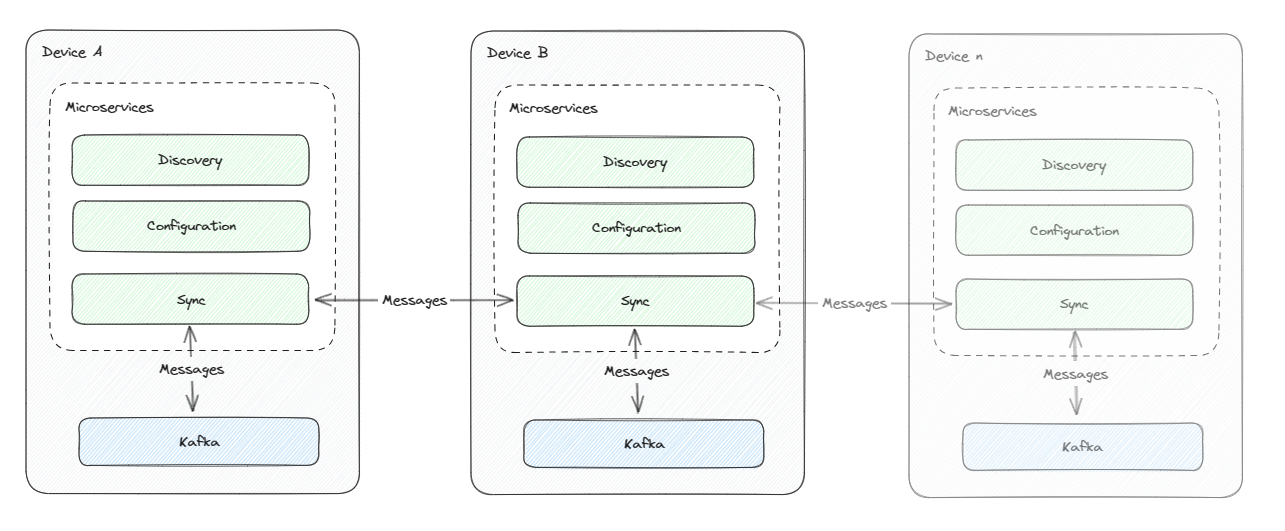
The syncing service had a dependency on an instance of Kafka running, after all, it’s purpose is to sync Kafka topics! For our inner dev-loop, we used Docker Compose to orchestrate the dependencies. This was a great solution for general development as Visual Studio allows us to run our sync service and Kafka instance together with a single click. We could also debug them together as if they were running locally.
When it came to profiling, we hit a snag as the standard Visual Studio profiling tools didn’t support this setup. We needed to find an alternative route.
Docker Compose Basics
Before we jump into profiling workloads inside Docker Compose, let’s take a step back and look at what Docker Compose is, and how it can be used in Visual Studio.
If you’re already familiar with Docker Compose, feel free to skip ahead to the next section.
Docker Compose is a tool for defining and running multi-container Docker applications. It allows you to define the services that make up your application in a docker-compose.yml file, and then run them all. This is great for development, as it allows you to define your entire application stack in a single file, and then run it with a single command.
Visual Studio support for Docker Compose takes this one step further. It allows you define your docker-compose.yml file in a Visual Studio project, which can then be used as a launch profile. This means that you can run your entire application stack from Visual Studio, and then attach the Visual Studio debugger to any of the running services.
If you want to try some of this out in your own project, there’s a tutorial on how to get started with Docker Compose in Visual Studio in the Visual Studio documentation.
Profiling in Docker Compose
So, how do we profile an application running in Docker Compose?
Ideally we’d use the diagnostic tools built into Visual Studio, but unfortunately some scenarios aren’t yet supported. In our case, we wanted to profile a single sync service in our Docker Compose project.
Luckily, there’s a fairly simple way that we can still achieve this profiling. The steps are:
- Update the Dockerfile.
- Run the compose project
- Run the profiling tools in the target container
- Analyze the profiling data in Visual Studio
Update the Dockerfile
The first step is to update the Dockerfile for the service you want to profile to use the .NET SDK, rather than runtime. This will allow us to install and run the profiling tools.
If you’re using a standard Dockerfile created by Visual Studio, the easiest way would be to temporarily change the base image to the .NET SDK, e.g. mcr.microsoft.com/dotnet/sdk:8.0. While this is convenient for one-off profiling, you wouldn’t want to use this in production.
If you want to make profiling a part of your development loop, you might want to consider either creating a separate Dockerfile specific for profiling, or add a profile specific stage to your existing Dockerfile. For the latter, there is additional documentation on multi-stage builds.
Run the compose project
Once you’ve updated the Dockerfile, you can run the compose project as normal. This will build and run the services defined in the compose file, including the service you want to profile.
Run the profiling tools in the target container
Once the compose project is running, we can use the Visual Studio container tools to exec into the target container and install and run the profiling tools.
Once you’re in the container, you can install the profiling tools using the .NET CLI. For example, to install the dotnet-trace tools, you can run:
dotnet tool install --global dotnet-trace
export PATH="$PATH:/home/app/.dotnet/tools"
You can then use the dotnet-trace tool to collect a trace of the running application. For example, to collect a trace of the dotnet run command, you can run:
dotnet-trace collect --process-id <dotnet process ID> --providers Microsoft-DotNETCore-SampleProfilerThe process ID can be found using the ps command, or by using the dotnet-trace ps command. If using the latter, look for the process which references the target service dll.
Putting it all-together in a sample ‘MessageProcessing’ project, the process looks like this:
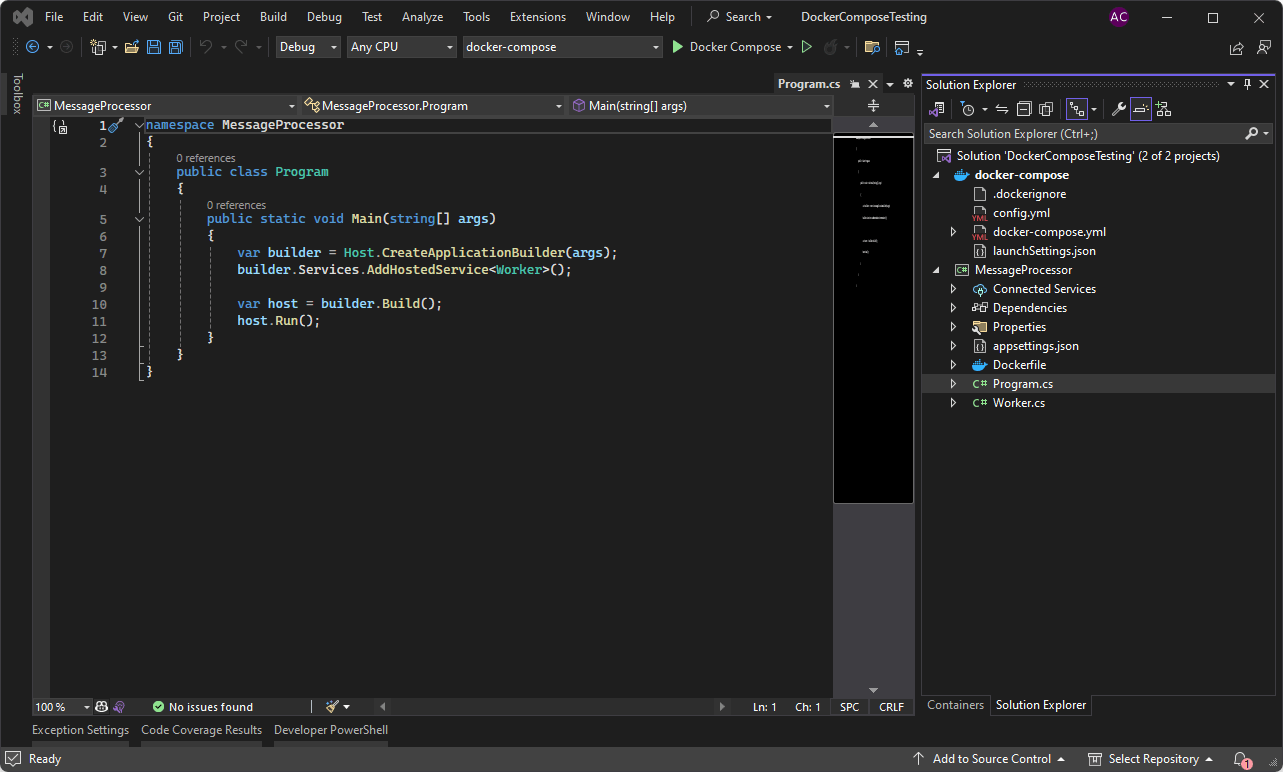
When dotnet-trace is run, it’ll automatically start sampling the running service. Once you’ve collected enough data, you can stop the trace using Ctrl+C. This will save the trace to a file.
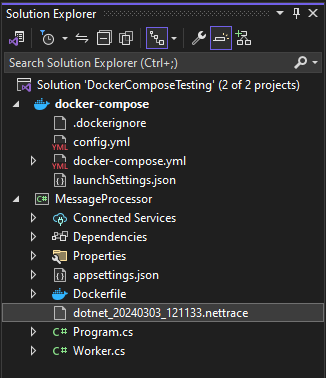
Since we’re running the service through Docker Compose and Visual Studio, the project directory is automatically mounted into the container. This means that the trace file will be saved to the source tree, and will be visible under the project in the Solution Explorer window.
Analyze the profiling data in Visual Studio
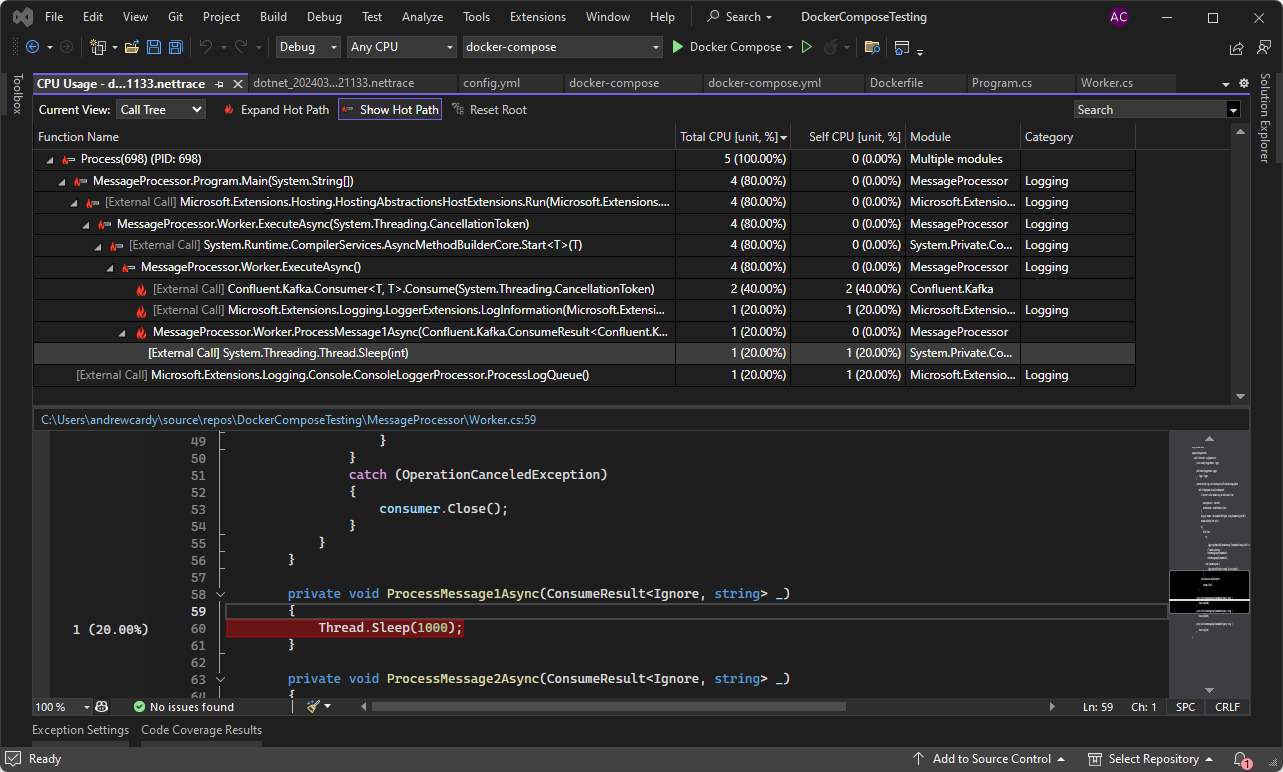
Once you’ve collected the trace, you can open it in Visual Studio. This can be done by double-clicking on the trace file in the Solution Explorer.
This will open the full trace in Visual Studio, and you can use the built-in profiling tools to analyze the trace. This will allow you to see where the bottlenecks are in your code, and make targeted improvements to increase the performance of your service.
Conclusion
Using this methodology allowed us to profile our services defined in Docker Compose, and identify the bottlenecks in our code. In our case, we found some external calls which were increasing processing time, which we could target and improve!
Acknowledgments
I’d like to thank the Crew Clarke team, as we all contributed to developing our usage and knowledge of Docker Compose over various engagements, everyone who has worked on the Docker Compose and Visual Studio tooling and those brilliant developers who contribute to our community by sharing their knowledge and experiences.