Successful web app dev teams generally consider performance a requirement from the beginning, not an afterthought. Performance should be considered in all phases of a project, from design and into production, including updates to the app. That’s not to say you should try to optimize code before you’ve measured it, you really don’t know what needs to be optimized until you measure perf. This tutorial will primarily use a modified version of Tom Dykstra’s EF6/MVC 5 Contoso University app to introduce you to measuring and monitoring performance.
This topic contains the following sections:
- Using the StopWatch filter to time every action method
- Configure Azure settings from Visual Studio
- Configure app settings for Azure
- Limitations of the Perf filter
Using the StopWatch filter to time every action method
Add the StopWatch NuGet package to your ASP.NET MVC app using the following command in the Package Manager Console:
PM> Install-Package StopWatch
The StopWatch package will create a Filter directory and add a class containing the UseStopwatch attribute. You can apply this filter to controllers with the following syntax:
[UseStopwatch]
public class HomeController : Controller
{
To apply it globally (that is to every controller), add the following code to the App_StartFilterConfig.cs file:
public class FilterConfig
{
    public static void RegisterGlobalFilters(GlobalFilterCollection filters)
    {
        filters.Add(new HandleErrorAttribute());
        filters.Add(new UseStopwatchAttribute());
    }
}
Add settings to the root web.config file to control how timing information is sent to the trace system. For development we want all requests to be under 250 MS. Action methods taking more than 500 MS are recorded at the warning level, and requests taking more than 2.5 seconds are considered errors. In the markup below, we’ve also set ShowTimeInLayout to 1 (true), so every page will display the elapsed time. We will show timing information for each page in development and test, but not in production. Later in the tutorial I’ll show how to set these values outside of source code for the Azure environment.
</connectionStrings>
<appSettings>
   <add key="webpages:Version" value="3.0.0.0" />
   <!-- Keys deleted for clarity.  -->
   <add key="TraceErrorTime" value="2.5" />
   <add key="TraceWarningTime" value=".5" />
   <add key="TraceInformationTime" value=".25" />
   <add key="ShowTimeInLayout" value="1" />
</appSettings>
<system.web>
The last change we need to make is to add the timing information to the ViewsShared_Layout.cshtml file:
<footer>
    <p> @Html.Encode(ViewBag.elapsedTime) </p>
</footer>
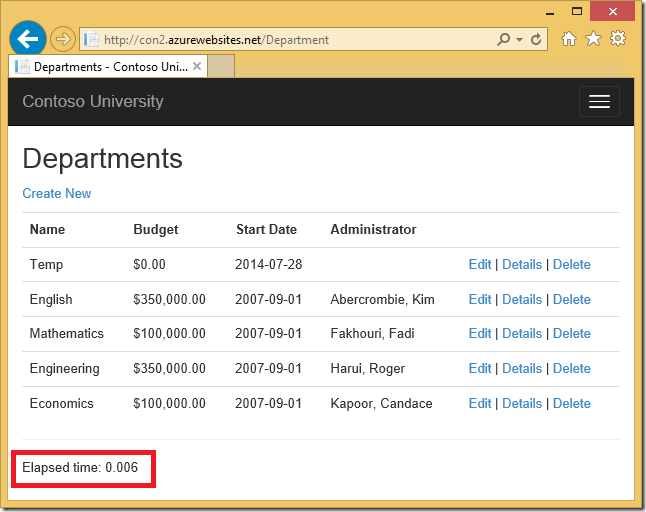
Run the app, each page shows the elapsed time for the action method.
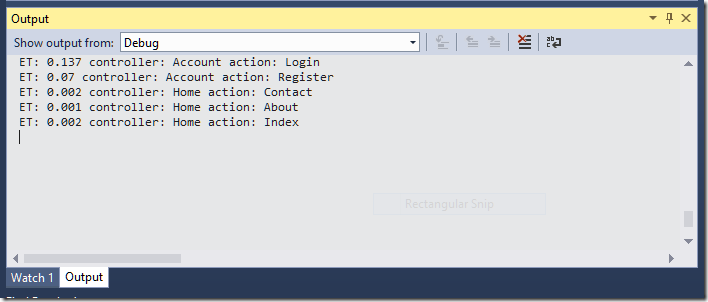
If you’re running in Visual Studio, you can see the trace data in the output window:
Configure Azure settings from Visual Studio
Deploy the app to Azure where you can see the page level timings.
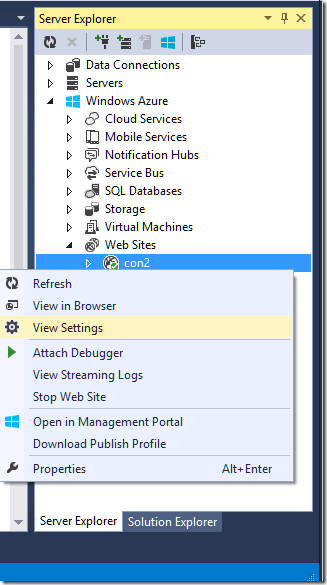
You can configure Azure settings in the Azure portal or in Visual Studio. Most of the steps in the following section will be done in Visual Studio, but they are easily done in the Azure portal. In Server Explorer, navigate to your web site (con2 in the image below), right click > View Settings.
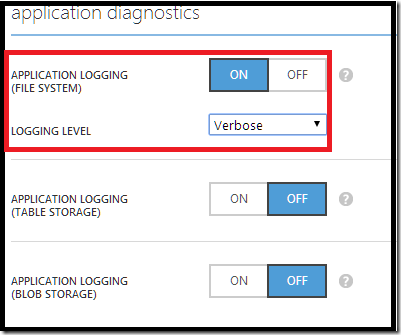
Set the Application Logging level to Verbose. The Verbose level logs all trace message. Setting it to Information logs Information, Warning and Error levels. Setting it to Warning logs Warning and Error levels. You can set the logging level in the Azure portal on the Configure tab of the web site:
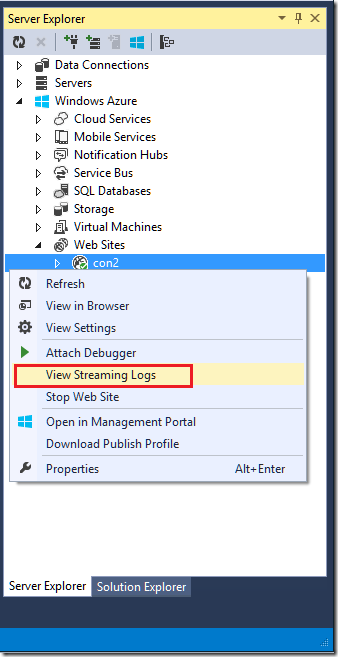
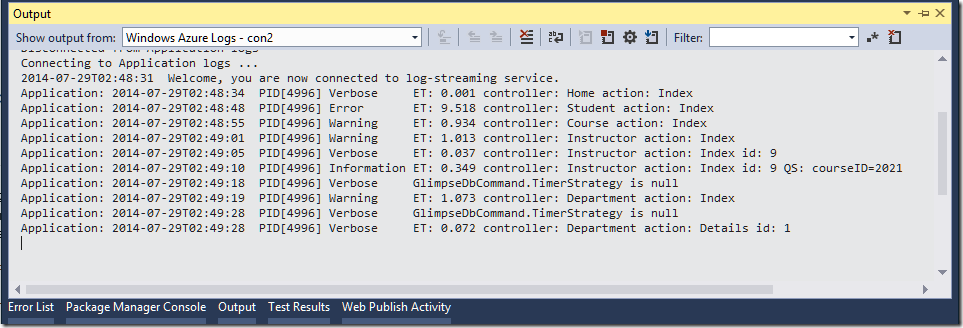
Run the app on Azure, and in Visual Studio, navigate to your web site, right click > View Streaming Logs:
The output window in shows the trace data. Note the filter lists all the route data plus any query string data.
Looking at trace data from Visual Studio is interesting, but it’s not a viable approach to production monitoring. A good way to save trace data on Azure is to connect the trace provider to Azure storage.
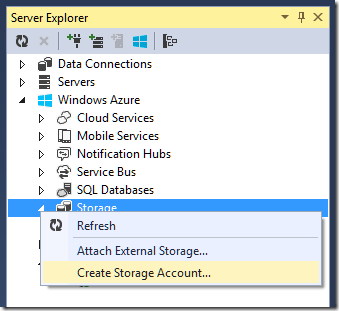
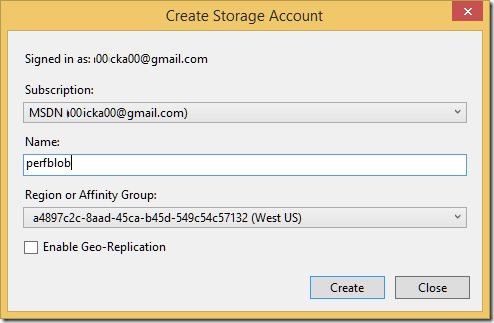
In Server Explorer, right click Storage > Create Storage Account.
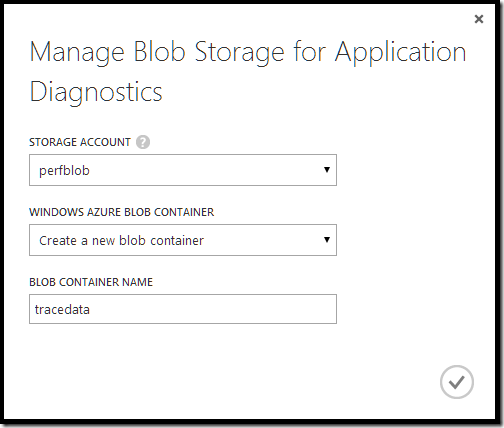
In the Azure portal, click on your web site and select the Configure tab. Under application diagnostics set application logging (blob storage) to On. Set the logging level to Information. Click the manage blob storage button and enter the storage account you created. (Note: if you don’t see the storage account you created from Visual Studio, navigate to the storage account in the portal and force a full refresh of the browser (^F5)).
Click Save. Test you web app so you can generate trace data.
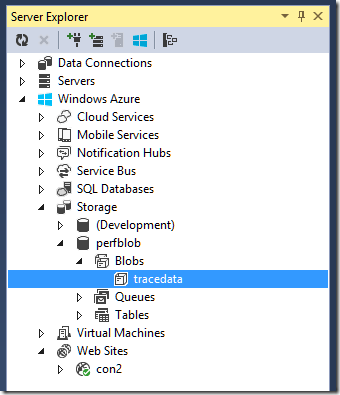
In Server Explorer, navigate to the blob storage you created and double click on the container.
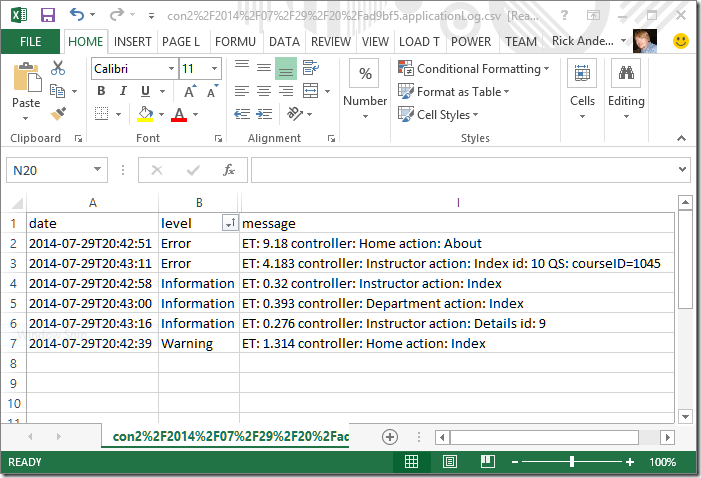
Double click on the trace data log to open it in Excel.
You can use Excel to sort the data and hide columns you’re not interested in.
Configure app settings for Azure
In Server Explorer, navigate to your web site (con2 in the image below), right click > View Settings.
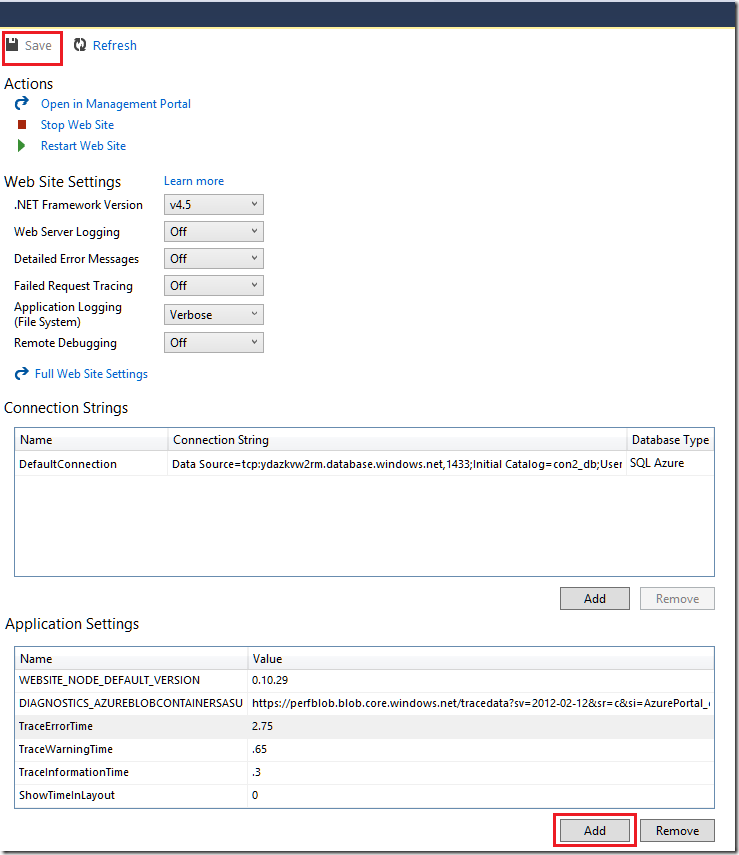
Under Application Settings, hit the Add button to add the app settings from the web.config file. The app settings here will override those in the web.config file. On a production app, we won’t want to show page timings.
Limitations of the Perf filter
The simple stopwatch filter misses the authorization portion of the ASP.NET pipeline (which can be expensive), and it stops timing after the OnResultExecuted completes. The filter completely ignores client side timing, which can be significant. Glimpse is a much more powerful tool to profile and monitor your ASP.NET app – stay tuned, I’ll be blogging on that next.


0 comments