

In Visual Studio 17.1 there are a number of enhancements to Go To Definition (and Go To Implementation, and Go To Base, etc.) allowing you to navigate to source code that isn’t in your current solution. In previous versions of Visual Studio when invoking Go To Definition on a symbol Roslyn would check if the symbol is defined in your current project or any referenced projects, and if a reference was found we would navigate you to that symbol. If a reference was not found we would use ILSpy to decompile part of the referenced DLL and navigate you to the decompiled source of that symbol.
Decompilation is a great way to get a feel for the shape of an API that you’re referencing, but it does have some downsides, the biggest of which is that a decompilation can only be created from the IL that is in the referenced DLL. This means things like comments, variable names and other parts of source code that aren’t represented in IL simply can’t be seen. Sometimes even the code you do see is different, due to compiler lowering. For example, when a simple interpolated string like $”{items.Count}” is compiled, the IL is indistinguishable from if you had written string.Format(“{0}”, items.Count). These types of differences don’t change behavior, but they might be important to understanding the code.
In the latest release we’ve added a few more steps to the process so that where possible, we will now show you the real source code for the symbol, matching exactly what the compiler used to create the DLL.
Finding the PDB file
The first step to locating the real source of something is to find the PDB file. PDB stands for “Program Database” and it is the file format used to store extra information about a library to help with debugging and other scenarios.
The easiest location to find the PDB file, and the first one that is checked, is right next to the DLL on your disk. Whilst the contents of the PDB file don’t affect anything that happens at runtime, it’s very common for them to exist for debug builds, and not too uncommon for release builds too.
The next easiest location for the PDB file is embedded within the DLL itself. For the portable PDB format it is possible to specify <DebugType>embedded</DebugType> in your csproj file and instead of writing the PDB file to disk, the PDB file itself will be embedded in the DLL. This has the advantage of easy distribution of debug information, at the cost of a small increase in file size.
Fortunately, on disk and embedded PDBs are relatively easy to find using the helpful TryOpenAssociatedPortablePdb method that is part of System.Reflection.Metadata.PEReader in .NET.
If that method fails however, then we have to work a little harder, and try to find the PDB on a symbol server. A symbol server is a system that stores and indexes PDBs for later download and use, normally by the debugger. There are various ways to control a symbol server search and these can be configured in the Tools > Options > Debugger > Symbols page in Visual Studio. By default, you should see entries for the Microsoft Symbol Server and NuGet Symbol Server, but you might need to enable them. You can also add symbol servers from an Azure DevOps instance, or any other private symbol server that might be available to you.
It is important that the right PDB is downloaded for the specific build of the DLL that is being referenced, and so the search uses various pieces of information that are pulled out of the DLL. This information helps the debugger locate the right PDB on the symbol server and validate that it is the one that matches the DLL.
So how does Roslyn find this information in order to tell the debugger? For that we need to take a slight diversion into the world of Metadata.
Metadata
A DLL is, to simplify, made up of two parts; firstly, the executable code written in IL, and secondly the metadata, which is information about that IL and the DLL in general, which is needed to help the runtime understand the IL. The metadata stores, for example, the names of every field and method in the DLL, which types they are part of, or return, or take as parameters etc. You can think of the metadata as a little database in the middle of a DLL, which has some tables in it describing the code the DLL came from. We can see these tables in ILSpy (pictured), or you can use an online tool like PeNet which shows things in a little more of a “raw” format.
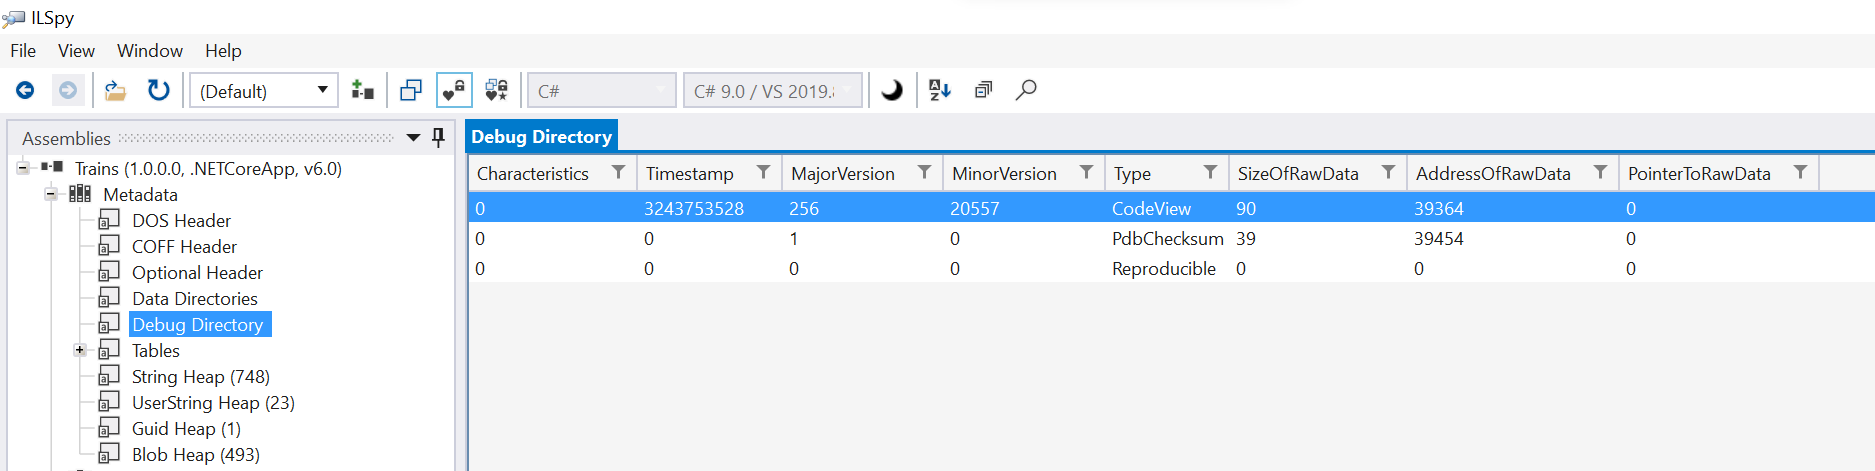
In the above screenshot you can see the Debug Directory table is highlighted, and the row within that which has a Type of “CodeView”. This is where most of the information we need comes from. Using PeNet and clicking the “Debug” button on the left will also show you the CodeView entry itself, however, doesn’t decode the Type column, so pick the tool you prefer to use.
Another useful tool for viewing metadata is mdv which is a console application you can build from source here: https://github.com/dotnet/metadata-tools
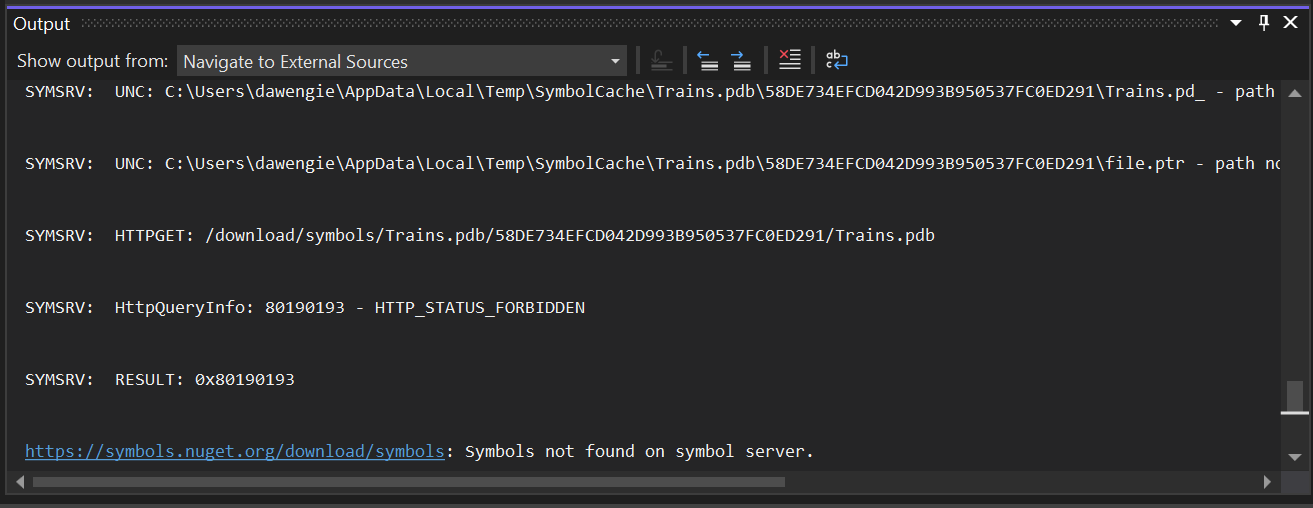
Roslyn iterates through the debug directory, gathering all of the information that the debugger needs from the CodeView and PdbChecksum entries, passes it to the debugger, and it works its magic. The debugger implements the symbol server protocol (see https://github.com/dotnet/symstore/tree/main/docs/specs) to retrieve the PDB from the symbol server. It also uses local caches configured in debug configuration to speed up the look up next time it’s asked for the same PDB. You can see the output of the search either from the Modules tool window when the debugger is active by right clicking on an entry and selecting Show Symbol Load Information, or after using Go To Definition you can find the “Navigate to External Sources” category in the Output Window and some information will be shown there. Note that Roslyn only logs in depth symbol search information if the search fails, whereas the Modules window always has it available.
Finding the source code
Now that we have the PDB file, we have access to a lot more information about where this DLL came from, and we can go ahead and try to find the original source code. As with PDB files themselves, the most straightforward place the source code can be is either on the local disk, or embedded, and so those are the two places checked first, and if neither of those are fruitful then we use another API provided by the debugger and try to download the source via Source Link.
Before we can use either of these methods to find the source code though we need to know which source file we’re looking for, and for that we need to go back to the metadata tables, both from the DLL file but also from the PDB this time, since we now have that information.
Finding the Document record
When Roslyn tries to find source for a Go To Definition command it is essentially saying “Find the source for this ISymbol“. A symbol is the representation of the thing that we’re trying to go to, be it a type, method, property, etc. Each symbol that comes from metadata holds a MetadataToken which you can think of as the key to the database table in the metadata that holds information about the symbol.
Let’s say we’re trying to navigate to the definition of a method called “ReadEntities” which has a MetadataToken of 0x06000038. In order to conserve space, like a lot of things in metadata, these tokens pack two pieces of information into a single four byte number: The first byte, 06, means this token is for the Method table, and the remaining three bytes, 000038, means it is for the 56^th^ row of that table (as 38 in hexadecimal is 56 is decimal).
Looking in ILSpy we can see the information that is stored for this method:
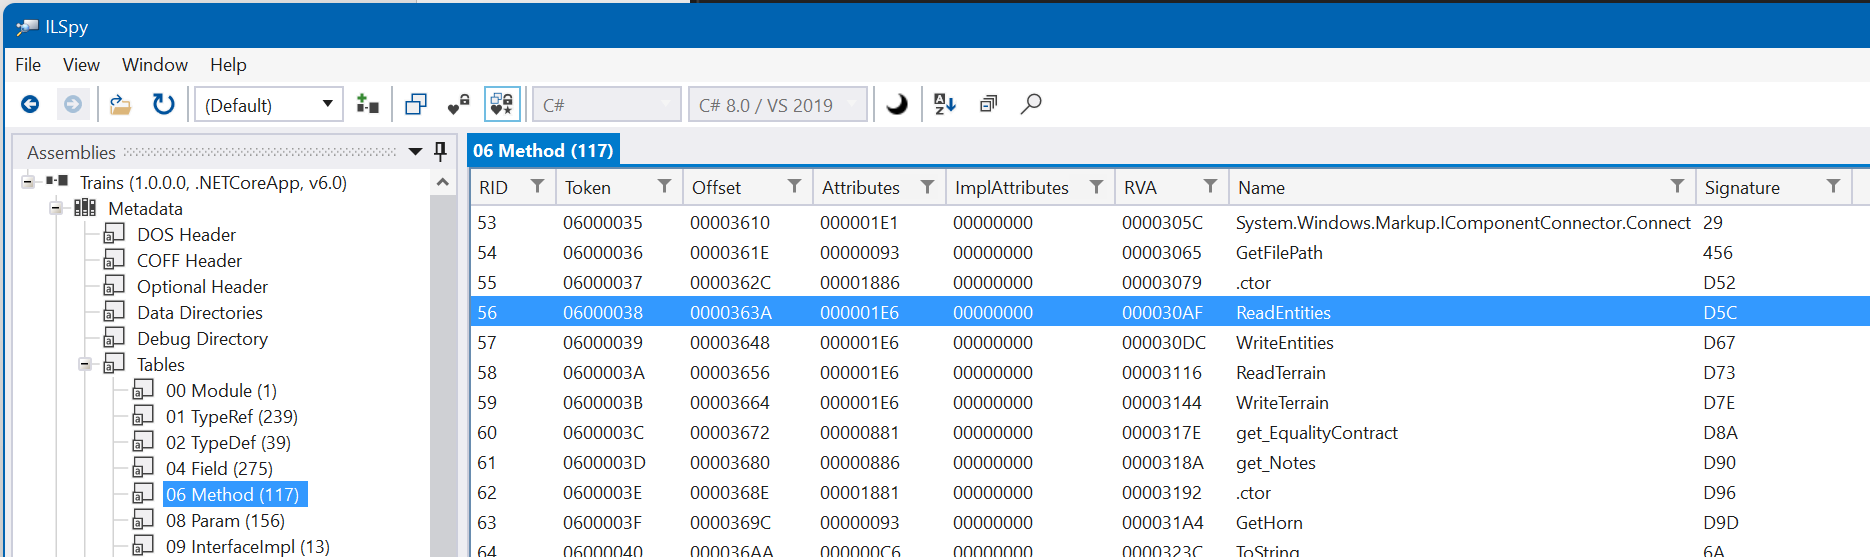
This screenshot also reveals another detail of metadata, which is that it describes runtime concepts rather than language concepts. For example, C# constructors are a language concept, but to the runtime they are the same as methods, albeit methods that happen to be called .ctor. Similarly, you can see get_Notes, which is the property getter for the Notes property on a type, but again to the runtime it’s just another method.
Now that we have found the method row, we can continue to dig into the metadata to find the Document row associated, which comes from the PDB metadata. Exactly how we do this is straightforward, but detailed. You can read the code if you’re interested but the general idea is that, again in the interests of space saving, we only store info for a particular document once. In the past that meant only for methods that have bodies where breakpoints can be placed, as there is a pre-existing concept in portable PDBs to store that info which is already in use. For navigation though we need a little more info, so we added the ability to store document info for types that would otherwise have no document info recorded, like interfaces. What that means in practice is that if we can’t find document info for a method, or we’re looking at a field etc. we check the containing type, and if we can’t find document info for a type, we check for one of the methods it contains (and vice versa!)
For methods we look for the corresponding row in the MethodDebugInformation table, which links to the Document table:
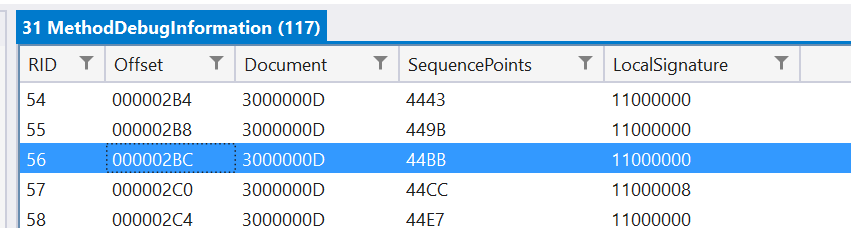
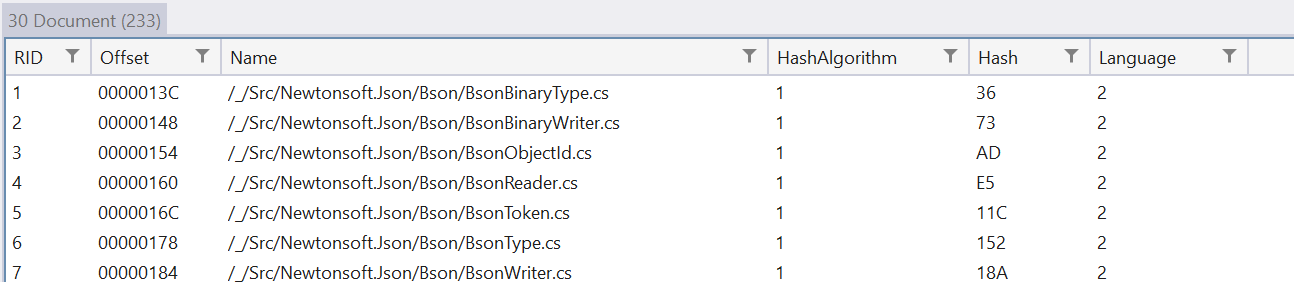
Unlike a normal relational database, there isn’t a field to refer to the Method that the row is talking about, the table just uses the same ID as the Method table itself, so row 56 of the MethodDebugInformation is for row 56 of the Method table. Here we can see a Document field, with the value 0x3000000D. Once again this is a metadata token pointing to the Document table (30) row 13 (00000D in decimal), and we have our result.
For types, the same theory is used except we use the CustomDebugInformation table which is a more general purpose table, so finding the record means looking up not only the ID it refers to, but also a record type. It then similarly points to a row in the Document table, and we have the info we need.
Reading the Document record
The document record is where we finally find the information needed to load the original source file, in one of three different formats. Firstly, and again the simplest case, it could contain the full path to the source file as it was when the DLL was originally compiled, and the source code could be on disk at that location. This is probably not very likely to be helpful, but maybe for very controlled enterprise environments, or independent developers who reference their own packages, it might be just enough.
Secondly the document record could contain a relative path to the source file, with an associated CustomDebugInformation record that stores the actual source for the file, compressed and embedded in the PDB itself. In this case Roslyn will read, decompress and write it to a temp file so that it can be navigated to. Enabling source embedding in a project can be as easy as adding <EmbedAllSources>true</EmbedAllSources> to a .csproj, again sacrificing file size for easy of distribution.
Finally, the Document record could contain a path and the CustomDebugInformation could contain a Source Link map, in JSON format, which tells the system how to map the path to a URL where it can download the source file from a source control repository.
Source Link
Source Link stores a mapping from a relative folder path to an absolute repository URL. For the venerable NewtonSoft.Json library the Source Link information can be seen below:
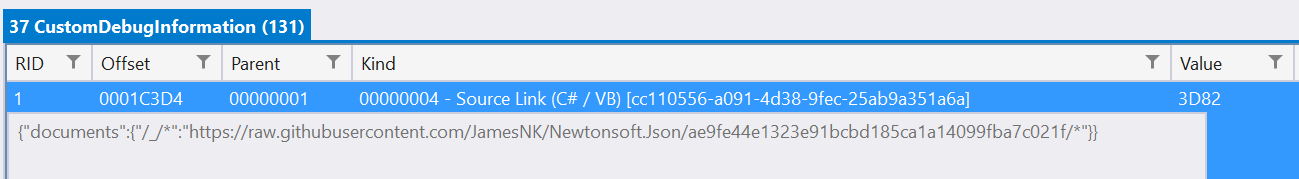
This maps any path starting with “/_/” to the URL shown. Notice how the URL contains a commit hash, which ensures that the right source will be shown for the exact build being referenced. There are a number of Source Link packages that can be referenced by libraries, with each one understanding a different repository provider (eg, GitHub, Azure DevOps, GitLab etc.).
The document info for a document from this PDB contains a normalized path, where the common directory prefix has been replaced “/_/” as per the map above.
Once the relative file path and base URL are known downloading the file is straight forward, though once again we rely on services provided by the Visual Studio Debugger to do so. This ensures that any source code downloaded for the purposes of navigation is automatically available for debugging, so features like breakpoints etc. will work as you would expect. This also means authentication and caching is centrally handled.
Navigation
Now that we know where the symbol comes from, and we have a file on disk, the navigation can happen. All of the downloading of symbols, and source files, could take some time so for now there are various timeouts in place to ensure you’re not left hanging when you want to see some source code. If you see the decompilation for something that you think should have Source Link support, or you notice a timeout in the output window, you can always try again later and the download might have finished in the background!
Of course, all of the PDBs and source files have various checksums, hashes and other checks to ensure that the source you’re seeing is the actual source that was used to compile the DLL, so there are other reasons that could prevent this working, but they will be noted in the output window. At the end of the day we are striving for accuracy so even a decompilation is better than an incorrect copy of the original source, even if it does have variable names and comments.
Give us your feedback
This isn’t the end of the improvements to this area, and we already have ideas for more improvements like:
- Supporting native PDBs, as well as portable
- Finding the implementation DLL for a reference DLL that doesn’t have PDB info
- Being able to switch between Embedded, Source Link or decompiled source at will
- Better support for deep navigation for indirectly referenced DLLs
We would love to get your feedback on the new Go To Definition behavior so please give it a try and let us know what you think! You can share your feedback with us by creating an issue on Roslyn’s open source repo on GitHub. We appreciate your feedback! Also be sure to let us know if you like this in-depth technical type of blog post, or if you went cross-eyed halfway through.
Thanks for the great article.
Is this supposed to work with Nuget packages I created myself as well? Following your steps I loaded the .dll from my package into ILSpy, but I don't see the MethodDebugInformation nor the CustomDebugInformation or Document tables.
Ultimately my goal is to use 'Go to definition' on our own packages without using Resharper. Is this at all possible?
Currently the error message I am seeing after 'Go to definition' in the 'Navigate to External Sources' output window:
<code>
In ILSpy it does say the .pdb was correctly loaded with a message "Debug info: Loaded from PDB file [path/to/my.package.pdb]"
It should work with any nuget package provided the symbols are available, either because they were uploaded to a symbol server that is configured in Visual Studio, the pdb file is included in the nuget package, or the pdb info is embedded in the DLL itself. Since you don't see the MethodDebugInformation tables, etc, in IL Spy it would indicate that the PDB is certainly not embedded, and probably not next to the DLL on disk.
Are you publishing the symbols to a symbol server? If you're publishing to nuget.org this could be a .snupkg package. If so, using Nuget Package...
I'm not sure about this feature. It sounds nice but pretty much turns out useless rather quickly.
For example, you click on hm... DirectoryInfo, pressing F12... you get a temporary disassembly, you see "An external source file is available. Go to file". Yay, exciting. You press the link and what do you get? The source of the -reference- assembly! Filled with useless "throw null" everywhere. Or empty definitions. How does that help in any way? It is worse than the [metadata] temporary disassembly as that one provides at least in-doc commentary.
Is there any library at all (except Json.NET) for which it...
The fact that .NET runtime assemblies are reference assemblies, and hence don't have Source Link information in them, is definitely something that we want to improve over time, but I think the feature is worth shipping in the meantime so that it at least can help in some scenarios. There are a large number of Nuget packages that use Source Link and ship PDBs, but unfortunately if you don't happen to use them then the use of the feature is certainly limited.
It is worth noting that when PDB or Source Link information is not found the system falls back to...
Thanks for the article !
Great article. I would be up for in-depth blogs such as this, though I must confess to being one of the “…went cross-eyed halfway through” brigade on this one.