Last month, we announced .NET support for Jupyter notebooks, and showed how to use them to work with .NET for Apache Spark and ML.NET. Today, we’re announcing the preview of a DataFrame type for .NET to make data exploration easy. If you’ve used Python to manipulate data in notebooks, you’ll already be familiar with the concept of a DataFrame. At a high level, it is an in-memory representation of structured data. In this blog post, I’m going to give an overview of this new type and how you can use it from Jupyter notebooks. To play along, fire up a .NET Jupyter Notebook in a browser.
How to use DataFrame?
DataFrame stores data as a collection of columns. Let’s populate a DataFrame with some sample data and go over the major features. The full sample can be found on Github(C# and F#). To follow along in your browser, click here and navigate to csharp/Samples/DataFrame-Getting Started.ipynb(or fsharp/Samples/DataFrame-Getting Started.ipynb). To get started, let’s import the Microsoft.Data.Analysis package and namespace into our .NET Jupyter Notebook (make sure you’re using the C# or F# kernel):

Let’s make three columns to hold values of types DateTime, int and string.
PrimitiveDataFrameColumn<DateTime> dateTimes = new PrimitiveDataFrameColumn<DateTime>("DateTimes"); // Default length is 0.
PrimitiveDataFrameColumn<int> ints = new PrimitiveDataFrameColumn<int>("Ints", 3); // Makes a column of length 3. Filled with nulls initially
StringDataFrameColumn strings = new StringDataFrameColumn("Strings", 3); // Makes a column of length 3. Filled with nulls initially
PrimitiveDataFrameColumn is a generic column that can hold primitive types such as int, float, decimal etc. A StringDataFrameColumn is a specialized column that holds string values. Both the column types can take a length parameter in their contructors and are filled with null values initially. Before we can add these columns to a DataFrame though, we need to append three values to our dateTimes column. This is because the DataFrame constructor expects all its columns to have the same length.
// Append 3 values to dateTimes
dateTimes.Append(DateTime.Parse("2019/01/01"));
dateTimes.Append(DateTime.Parse("2019/01/01"));
dateTimes.Append(DateTime.Parse("2019/01/02"));
Now we’re ready to create a DataFrame with three columns.
DataFrame df = new DataFrame(dateTimes, ints, strings); // This will throw if the columns are of different lengths
One of the benefits of using a notebook for data exploration is the interactive REPL. We can enter df into a new cell and run it to see what data it contains. For the rest of this post, we’ll work in a .NET Jupyter environment. All the sample code will work in a regular console app as well though.

We immediately see that the formatting of the output can be improved. Each column is printed as an array of values and we don’t see the names of the columns. If df had more rows and columns, the output would be hard to read. Fortunately, in a Jupyter environment, we can write custom formatters for types. Let’s write a formatter for DataFrame.
using Microsoft.AspNetCore.Html;
Formatter<DataFrame>.Register((df, writer) =>
{
    var headers = new List<IHtmlContent>();
    headers.Add(th(i("index")));
    headers.AddRange(df.Columns.Select(c => (IHtmlContent) th(c.Name)));
    var rows = new List<List<IHtmlContent>>();
    var take = 20;
    for (var i = 0; i < Math.Min(take, df.Rows.Count); i++)
    {
        var cells = new List<IHtmlContent>();
        cells.Add(td(i));
        foreach (var obj in df.Rows[i])
        {
            cells.Add(td(obj));
        }
        rows.Add(cells);
    }

    var t = table(
        thead(
            headers),
        tbody(
            rows.Select(
                r => tr(r))));

    writer.Write(t);
}, "text/html");
This snippet of code register a new DataFrame formatter. All subsequent evaluations of df in a notebook will now output the first 20 rows of a DataFrame along with the column names. In the future, the DataFrame type and other libraries that target Jupyter as one of their environments will be able to ship with their formatters.
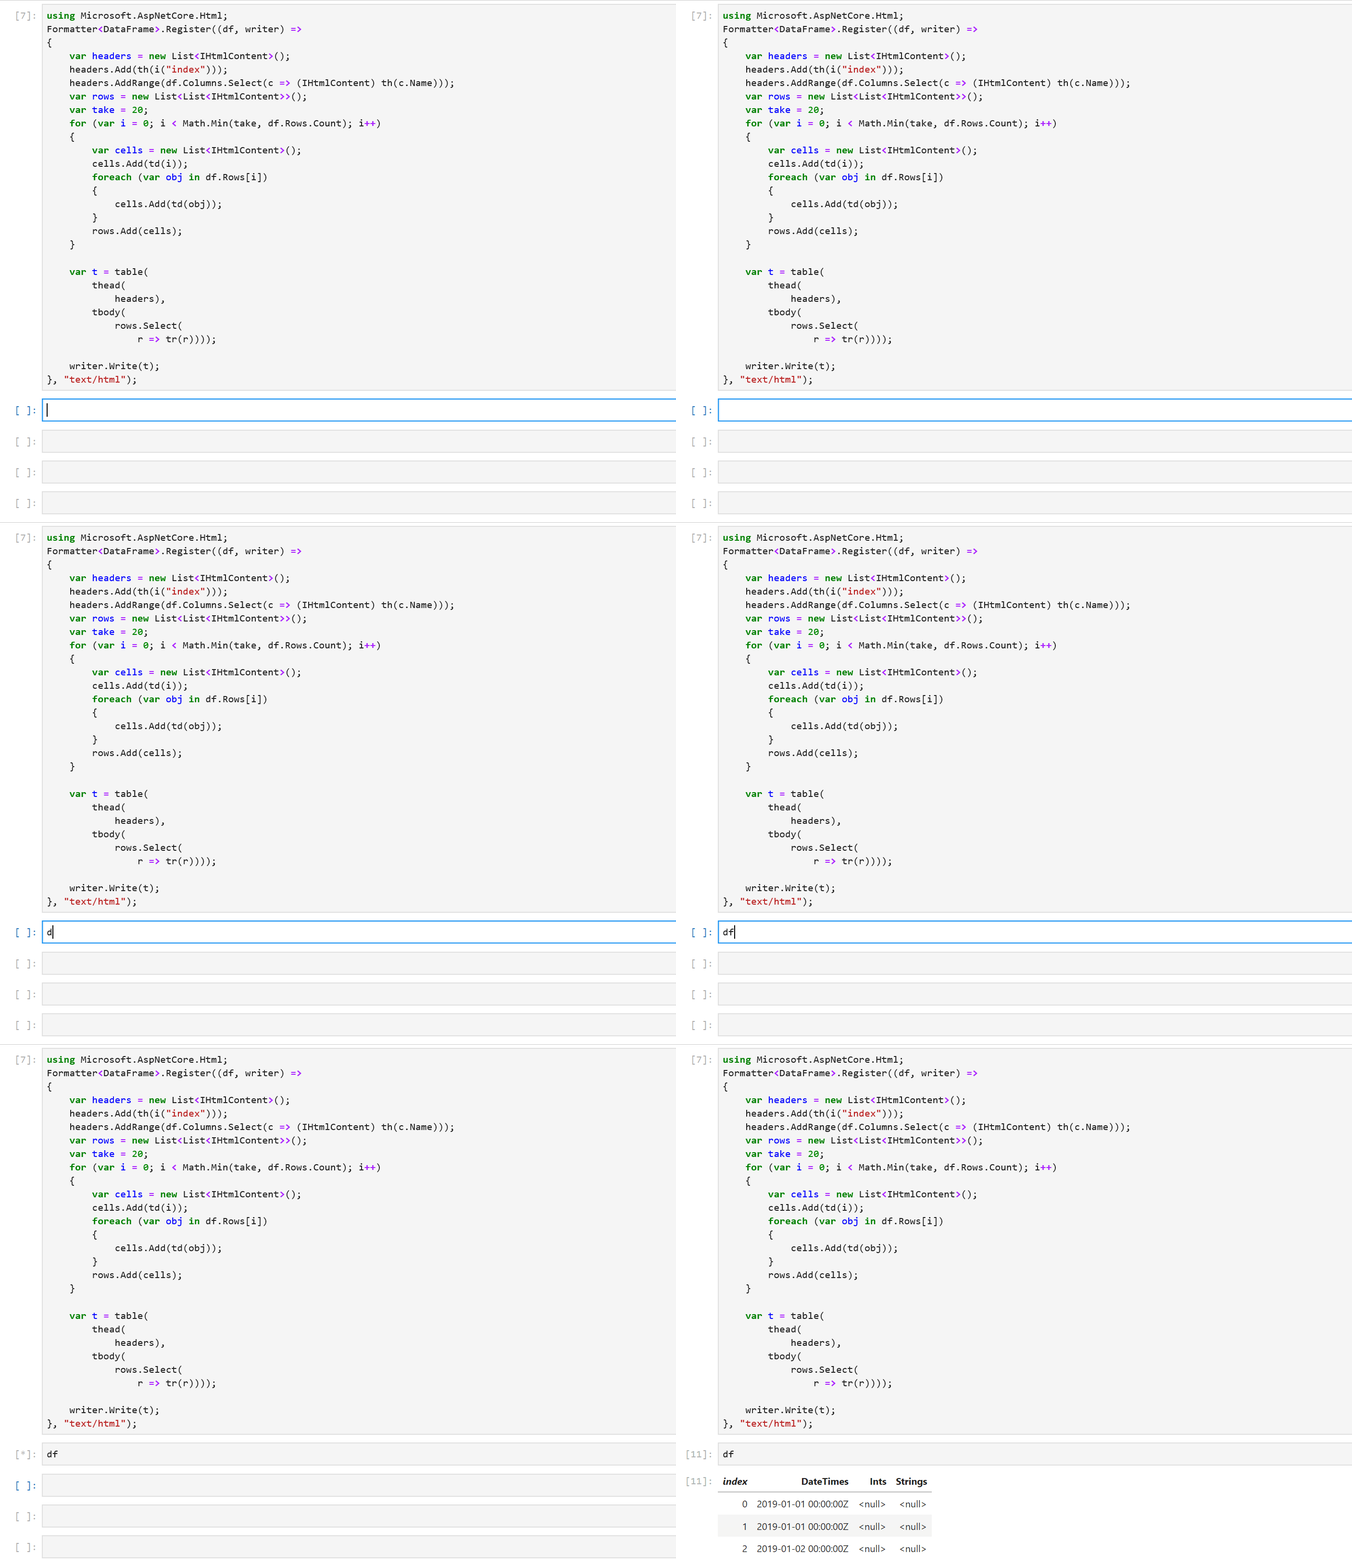
Sure enough, when we re-evaluate df, we see that it contains the three columns we created previously. The formatting makes it much easier to inspect our values. There’s also a helpful index column in the output to quickly see which row we’re looking at. Let’s modify our data by indexing into df:
df[0, 1] = 10; // 0 is the rowIndex, and 1 is the columnIndex. This sets the 0th value in the Ints columns to 10

We can also modify the values in the columns through indexers defined on PrimitiveDataFrameColumn and StringDataFrameColumn:
// Modify ints and strings columns by indexing
ints[1] = 100;
strings[1] = "Foo!";
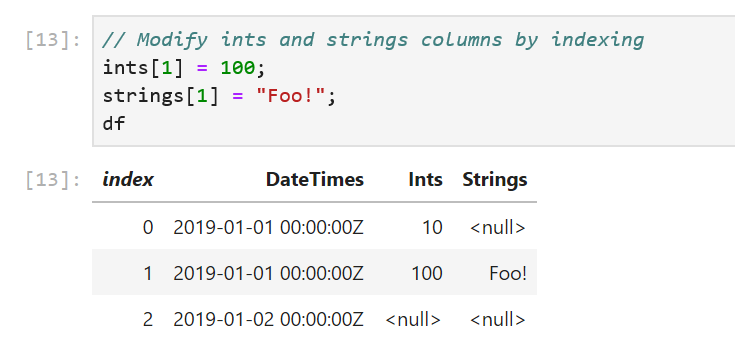
One caveat to keep in mind here is the data type of the value passed in to the indexers. We passed in the right data types to the column indexers in our sample: an integer value of 100 to ints[1] and a string "Foo!" to string[1]. If the data types don’t match, an exception will be thrown. For cases where the type of data in the columns is not obvious, there is a handy DataType property defined on each column. The Info method displays the DataType and Length properties of each column:

The DataFrame and DataFrameColumn classes expose a number of useful APIs: binary operations, computations, joins, merges, handling missing values and more. Let’s look at some of them:
// Add 5 to Ints through the DataFrame
df["Ints"].Add(5, inPlace: true);
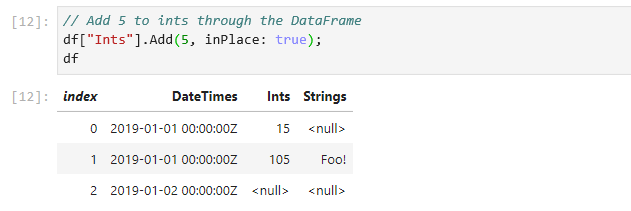
// We can also use binary operators. Binary operators produce a copy, so assign it back to our Ints column
df["Ints"] = (ints / 5) * 100;

All binary operators are backed by functions that produces a copy by default. The + operator, for example, calls the Add method and passes in false for the inPlace parameter. This lets us elegantly manipulate data using operators without worrying about modifying our existing values. For when in place semantics are desired, we can set the inPlace parameter to true in the binary functions.
In our sample, df has null values in its columns. DataFrame and DataFrameColumn offer an API to fill nulls with values.
df["Ints"].FillNulls(-1, inPlace: true);
df["Strings"].FillNulls("Bar", inPlace: true);

DataFrame exposes a Columns property that we can enumerate over to access our columns and a Rows property to access our rows. We can index Rows to access each row. Here’s an example that accesses the first row:
DataFrameRow row0 = df.Rows[0];

To inspect our values better, let’s write a formatter for DataFrameRow that displays values in a single line.
using Microsoft.AspNetCore.Html;
Formatter<DataFrameRow>.Register((dataFrameRow, writer) =>
{
    var cells = new List<IHtmlContent>();
    cells.Add(td(i));
    foreach (var obj in dataFrameRow)
    {
        cells.Add(td(obj));
    }

    var t = table(
        tbody(
            cells));

    writer.Write(t);
}, "text/html");
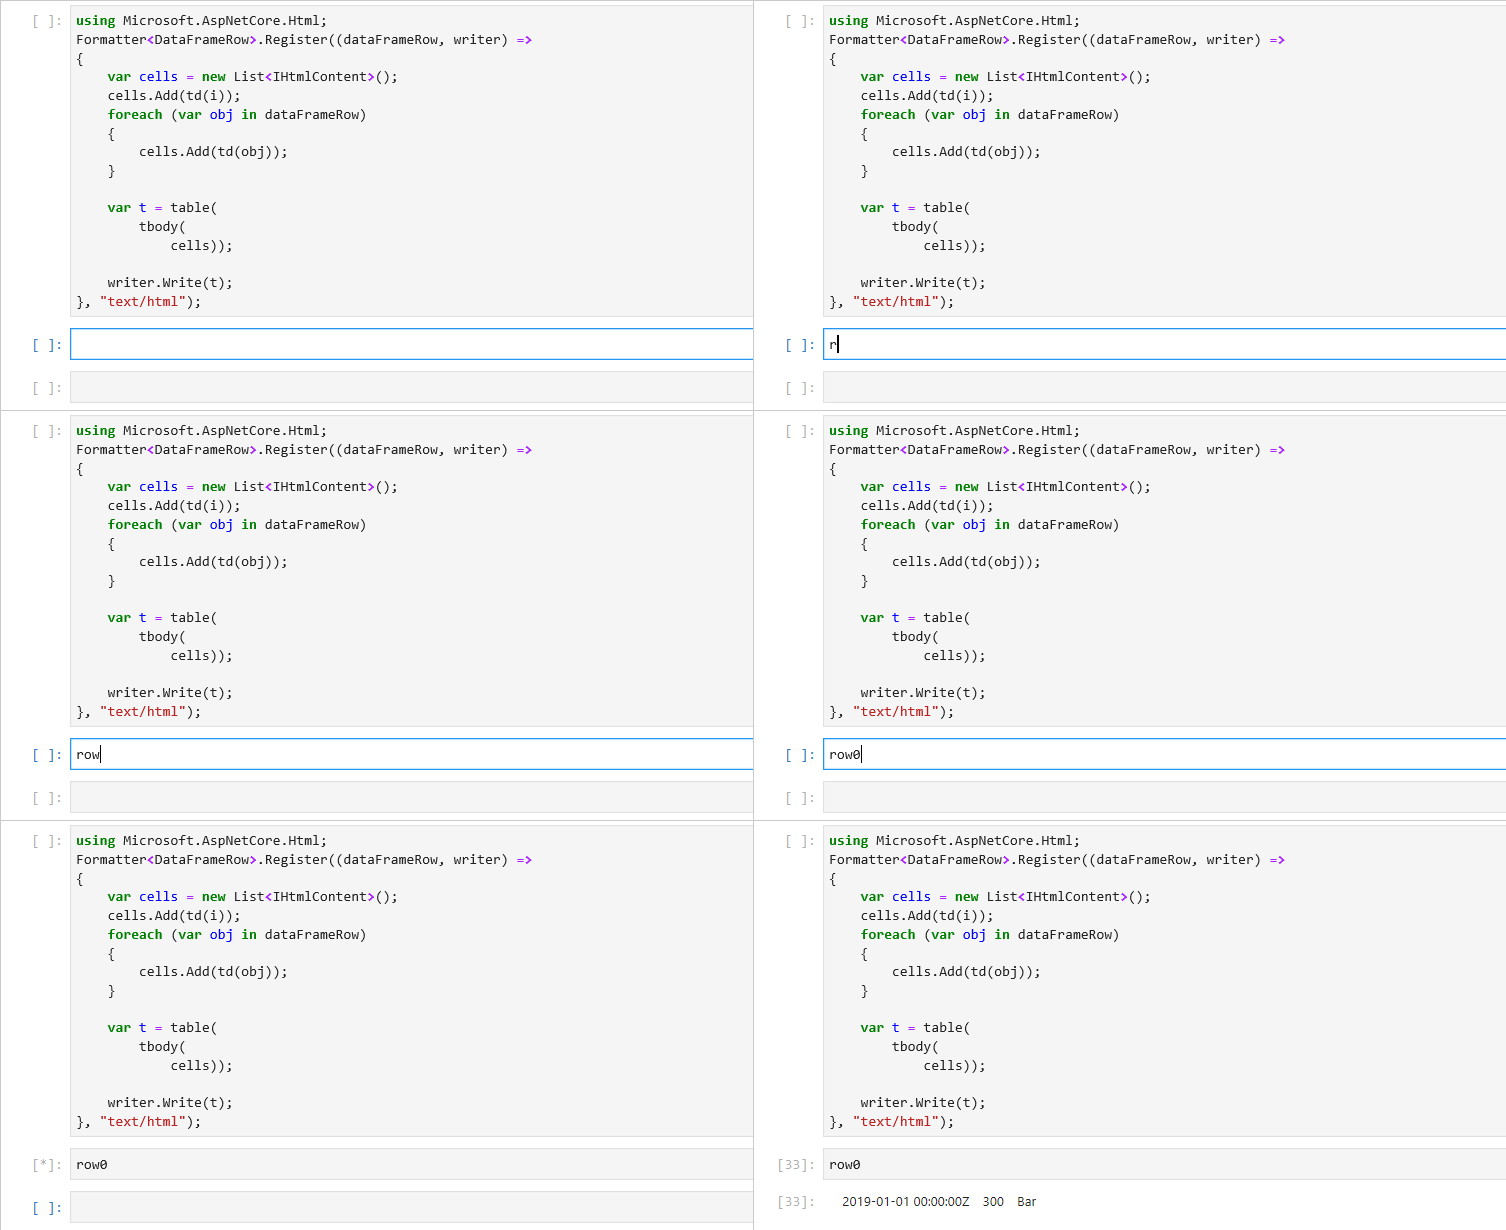
To enumerate over all the rows in a DataFrame, we can write a simple for loop. DataFrame.Rows.Count returns the number of rows in a DataFrame and we can use the loop index to access each row.
for (long i = 0; i < df.Rows.Count; i++)
{
       DataFrameRow row = df.Rows[i];
}
Note that each row is a view of the values in the DataFrame. Modifying the values in the row object modifies the values in the DataFrame. We do however lose type information on the returned row object. This is a consequence of DataFrame being a loosely typed data structure.
Let’s wrap up our DataFrame API tour by looking at the Filter, Sort, GroupBy methods:
// Filter rows based on equality
PrimitiveDataFrameColumn<bool> boolFilter = df["Strings"].ElementwiseEquals("Bar");
DataFrame filtered = df.Filter(boolFilter);
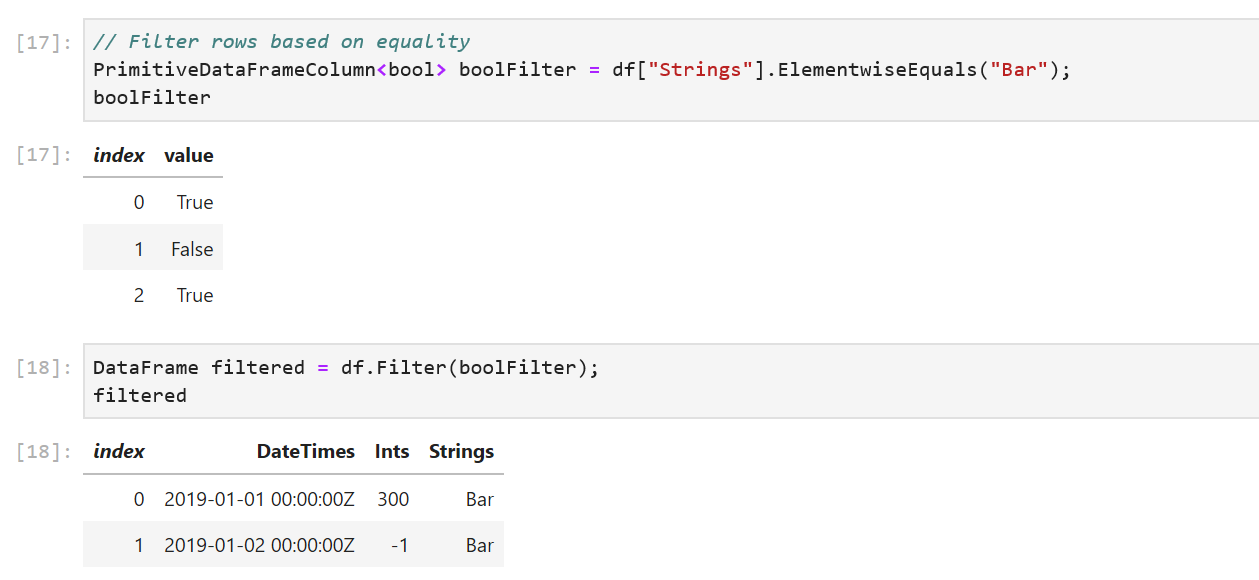
ElementwiseEquals returns a PrimitiveDataFrameColumn<bool> filled with a true for every row that equals "Bar" in the Strings column, and a false when it doesn’t equal "Bar". In the df.Filter call, each row corresponding to a true value in boolFilter selects a row out of df. The resulting DataFrame contains only these rows.
// Sort our dataframe using the Ints column
DataFrame sorted = df.Sort("Ints");
// GroupBy
GroupBy groupBy = df.GroupBy("DateTimes");
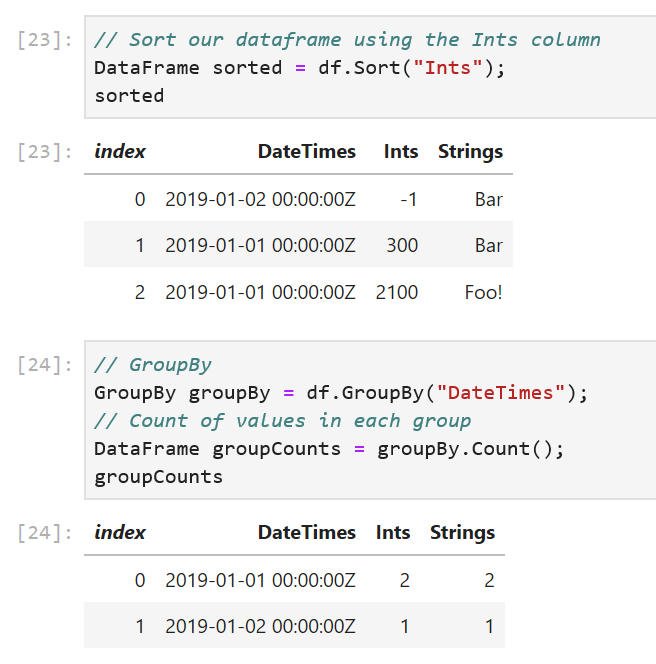
The GroupBy method takes in the name of a column and creates groups based on unique values in the column. In our sample, the DateTimes column has two unique values, so we expect one group to be created for 2019-01-01 00:00:00Z and one for 2019-01-02 00:00:00Z.
// Count of values in each group
DataFrame groupCounts = groupBy.Count();
// Alternatively find the sum of the values in each group in Ints
DataFrame intGroupSum = groupBy.Sum("Ints");

The GroupBy object exposes a set of methods that can called on each group. Some examples are Max(), Min(), Count() etc. The Count() method counts the number of values in each group and return them in a new DataFrame. The Sum("Ints") method sums up the values in each group.
Finally, when we want to work with existing datasets, DataFrame exposes a LoadCsv method.
DataFrame csvDataFrame = DataFrame.LoadCsv("path/to/file.csv");
Charting
Another cool feature of using a DataFrame in a .NET Jupyter environment is charting. XPlot.Plotly is one option to render charts. We can import the XPlot.Plotly namespace into our notebook and create interactive visualizations of the data in our DataFrame. Let’s populate a PrimitiveDataFrameColumn<double> with a normal distribution and plot a histogram of the samples:
#r "nuget:MathNet.Numerics,4.9.0"
using XPlot.Plotly;
using System.Linq;
using MathNet.Numerics.Distributions;

double mean = 0;
double stdDev = 0.1;
MathNet.Numerics.Distributions.Normal normalDist = new Normal(mean, stdDev);

PrimitiveDataFrameColumn<double> doubles = new PrimitiveDataFrameColumn<double>("Normal Distribution", normalDist.Samples().Take(1000));
display(Chart.Plot(
    new Graph.Histogram()
    {
        x = doubles,
        nbinsx = 30
    }
));
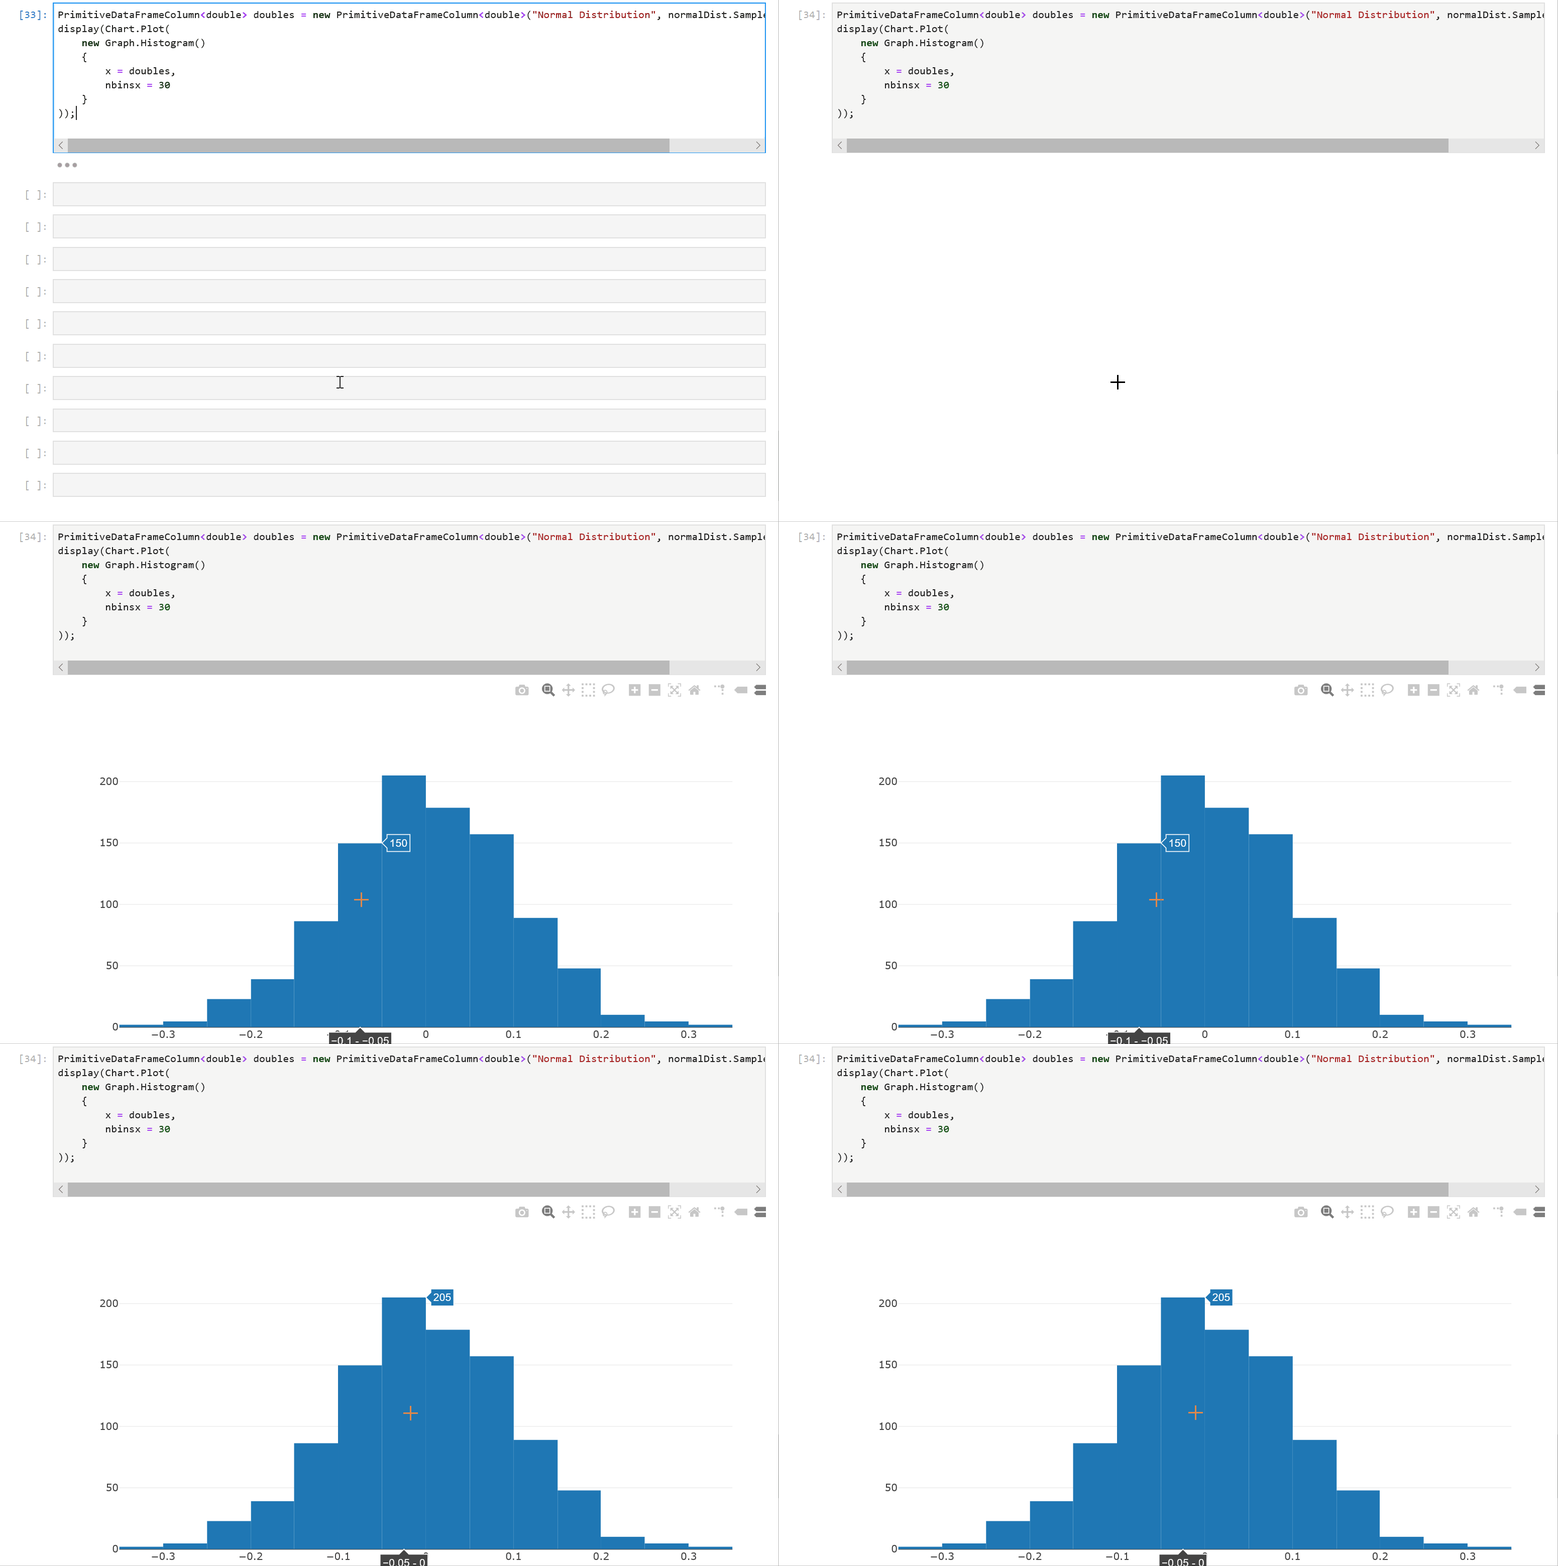
We first create a PrimitiveDataFrameColumn<double> by drawing 1000 samples from a normal distribution and then plot a histogram with 30 bins. The resulting chart is interactive! Hovering over the chart reveals the underlying data and lets us inspect each value precisely.
Summary
We’ve only explored a subset of the features that DataFrame exposes. Append, Join, Merge, and Aggregations are supported. Each column also implements IEnumerable<T?>, so users can write LINQ queries on columns. The custom DataFrame formatting code we wrote has a simple example. The complete source code(and documentation) for Microsoft.Data.Analysis lives on GitHub. In a follow up post, I’ll go over how to use DataFrame with ML.NET and .NET for Spark. The decision to use column major backing stores (the Arrow format in particular) allows for zero-copy in .NET for Spark User Defined Functions (UDFs)!
We always welcome the community’s feedback! In fact, please feel free to contribute to the source code. We’ve made it easy for users to create new column types that derive from DataFrameColumn to add new functionality. Support for structs such as DateTime and user defined structs is also not as complete as primitive types such as int, float etc. We believe this preview package allows the community to do data analysis in .NET. Try out DataFrame in a .NET Jupyter Notebook and let us know what you think!

The Git client was never designed to work with repos with that many files or that much content. If you’ve used Python to manipulate data in notebooks, you’ll already be familiar with the concept of a DataFrame. At a high level, it is an in-memory representation of structured data. https://www.asroon.ir/suppliers/detail/ظفر-بناب/2/view/
Can we read excel file instead of csv? Something likes
No unfortunately. At the moment, only reading from a csv file is supported. You might be able to save the excel file as a csv which you can then read into a
DataFramethoughOkay. That is fine. Another question, there is a trick in python pandas; Which is that we can read excel as html.
Such as
I just wonder that if it is possible in .net DataFrame?
Which namespace is the “Formatter” in?
I haven’t looked at it in a while, but they may be in
Microsoft.AspNetCore.HtmlHow to multiply the value of a cell (double) with a double?
I would like to do something like this:
The last line produces a compiler (type mismatch between object and double).
How can I do what I want?
Hello! You're hitting this because the indexing API is not strongly typed. https://github.com/dotnet/corefxlab/issues/2824 is a similar issue. returns the base object, not the real object. The indexer , therefore loses type information and can only work on . So it complains that doesn't match . One way to solve this is to retrieve the "ClosePrice" column as a first. Then, subsequent operations will always know their type. Here's an example:
<code>
This works for columns of other primitive types too. For the DateTime column type (not a primitive type), the first line in your for loop could...
Thanks!
Yes, I ended up retrieving the whole columns first. At first I just used Columns["field"] and ended up with lots of ugly type casts, so thanks for the hints about the DoubleDataFrameColumn type! But, why is there no DateTimeDataFrameColumn type?
This is the final code:
<code>
BTW: The code editor on this site does not produce my pasted code in verbatim. It did remove the DateTime type in the first declaration, so the above snipped does not show exactly the real code.
Nice!! That looks right. I'm sure it'll help other who face similar issues. The only thing I'd point out is to also look at the and methods(if you haven't already) on (and therefore also on ) for future reference. In fact, if all you're doing is multiplying all the values in the column by a , you should be able to just write . Unfortunately, you can't in this example because it looks like you're accessing the column too. The method does expose the row index though, so that may be an option if...
It would be nice to have a DateTimeDataFrameColumn just to avoid type cast and saving on memory. Better would be to have something like pandas to_datetime(df) in python. Pandas to_datetime(df)
I don’t think I can use the element-wise multiply, since I’m not sure the dates and number of rows in the two columns would match.
Great feature brought to .Net ecoystem. Very helpful in performing EDA.
I was playing around and following HousingML.ipynb as in https://mybinder.org/v2/gh/dotnet/interactive/master?urlpath=lab and https://github.com/dotnet/interactive/blob/master/NotebookExamples/csharp/Samples/HousingML.ipynb.
I am facing an issue while retrieving data for a particular column from a DataFrame. In the example, its accessed through an indexer over DataFrame with column name such as housingData["median_house_value"]. It also works for housingData["longitude"] and housingData["latitude"].
When I try to do same for my data, it gives an error "error CS1503: Argument 1: cannot convert from 'string' to 'Microsoft.Data.Analysis.PrimitiveDataFrameColumn'.
The datatype of my column is System.Single sa per DataFrame.Info()
I looked at the Source code of...
Right. On the latest release (0.3.0), the APIs are slightly different like you discovered.
Thanks for the confirmation!
This is helpful, thank you. I see a DataFrame.LoadCsv method, how can we write a DataFrame to csv? I’m looking for DataFrame.ToCsv or something, but I don’t see it. Can you please advise about how to write to CSV?
The killer combo for me is DataFrames + Multi-dimensional Index + Lazy Evaluation + Pivot Tables, so that you can take large datasets, construct a dimension index, then slice, filter and order, project dimensions onto a table, and finally pull out a segment of the table for and perform aggregations on that segment. Pandas has MultiIndex, lazy evaluated columns, and pivot tables. Fingers crossed that those are all on the roadmap.
It’s great to find this being developed. Mainly helps with me being able to work within the same project as my company’s back end, eventually. I can’t, however, find any documentation to it. Your link takes us to GitHub but there I only see source files. Does any type of documentation exist on this, maybe like an extended version of your post?
Documentation is a work in progress at the moment. However, I do expect to have some documentation out for 0.3.0 or for the 1.0.0 release. In the meanwhile, feel free to create issues on GitHub with API questions. I’m happy to answer them!
Hi,
very interesting I’ll give it a try !
What is the performance level ?
I saw that are developed in C# and not plain C or C++. Can this be a performance penalty ?