


On March 12th, 2026, the DirectX team and our hardware partners hosted DirectX: Bringing Console-Level GPU Developer Tools to Windows at GDC. We shared our dream of bringing console-level GPU developer tools to Windows, and today we are announcing a major step toward that goal with the biggest wave of new tooling features in DirectX’s history.
For the first time, all four Windows GPU hardware partners joined us on stage to demonstrate these features running on their hardware. AMD, Intel, NVIDIA, and Qualcomm have worked closely with us throughout feature development, each making significant contributions to make this release possible. This represents the deepest GPU tooling collaboration across the Windows ecosystem and the future of Windows GPU development.
The announcements included:
- DirectX Dump Files
-
- DebugBreak() in HLSL
- PIX Event Configurability
- Preview: Live Shader Debugging
- Shader Explorer
- Partner Announcements
-
- AMD: PIX/RRA interop and RGP + PIX events
- Intel: timing accuracy improvements on all GPUs
- More PIX Announcements
-
- PIX API
- Tile Mappings Viewer
- GPU Hardware Counters in System Monitor
- New GPU Capture File Format
- Capture/Replay Reliability
- Remote Deployment
- Dr PIX improvements
- Update Notifications + What’s New
- Machine Learning features
DirectX Dump Files
The Problem: GPU Crashes Are Painful
Lower-level APIs like D3D12 extract maximum GPU performance, but they make it easier than ever to hit gnarly GPU bugs – whether during development, QA testing, or on retail gamers’ devices. Existing tools like the Debug Layer, GPU-Based Validation, and DRED each help, but none provide thorough crash dump infrastructure with deep OS integration across all hardware vendors.
We want to change that.
Introducing DirectX Dump Files
DirectX Dump Files are GPU dump files generated when a TDR occurs. They represent thorough crash dump infrastructure in Windows, with robust integration that brings together critical data from all levels of the stack: hardware, user mode and kernel drivers, user mode and kernel components of Windows, and even your game/application via new D3D12 APIs.
The first releases will offer immediate help to developers. After that, our robust infrastructure lays an exciting foundation for everyone to build upon, enabling rapid innovation in this space in the future.
We are very thankful to our hardware partners AMD, Intel, NVIDIA and Qualcomm, who have worked very closely with us throughout feature development. They all joined us on stage during the GDC session to demonstrate DirectX Dump Files running on their hardware. We hope that many of you will try out our previews over the summer and send us your thoughts and feedback. This will help us refine the overall feature and make it as useful as possible for you.
What’s in a DirectX Dump File
A single .dxdmp file brings together data from every level of the stack, so you don’t have to piece together information from multiple sources:
- Hardware and driver state: information from your GPU vendor’s user mode driver and kernel driver about the hardware state including but not limited to register values, shader program counters (PC), shader memory, command buffers, page fault virtual addresses and more.
- DirectX state: information from D3D runtime and DX kernel — including D3D objects, pipeline state objects, DRED data, device error and CPU call stack, adapter info and device configuration.
- Game state: up to 2MB of custom data along with metadata to uniquely identify your data that you choose to include via new D3D12 APIs and callbacks.
All of this maintains Windows process isolation guarantees, ensuring sensitive data from other processes isn’t included in your game’s dump file.
Supported Scenarios
DirectX Dump Files support two critical developer scenarios:
- Retail crashes: collecting crash dumps from retail users
- Local crashes: collecting crash dumps from developer (or QA) machines
Both scenarios are fully supported, with customization available via new D3D12 APIs that will allow developers to sacrifice some application performance to improve crash dump actionability.
Configuring Dump Quality vs. Performance
New D3D12 APIs let you control a trade-off between game performance and dump file actionability, with three levels: no overhead (no runtime performance impact), medium overhead (balanced data with moderate impact), and high overhead (maximum data from the hardware vendor). Hardware vendors will define and document the exact features and impact of each level on their devices.
These levels are divided into D3D12 support tiers. Tier 1, which all devices supporting DirectX Dump Files will support, includes the medium and high overhead options. Tier 2, which some devices will support initially, offers the no overhead option. On Tier 2 devices, the no overhead dumps will be enabled by default by Microsoft. On Tier 1 devices, we will not enable medium or high overhead options by default due to the application performance implications, so it will be up to developers to opt into these settings.
Retrieving Dump Files
You can either retain the dump file (and use it to investigate a local crash or upload it from a retail gamer’s machine to your server) or let Microsoft collect it via Watson. D3D12 provides an optional callback after the dump creation that provides the dump file path.
PIX Support
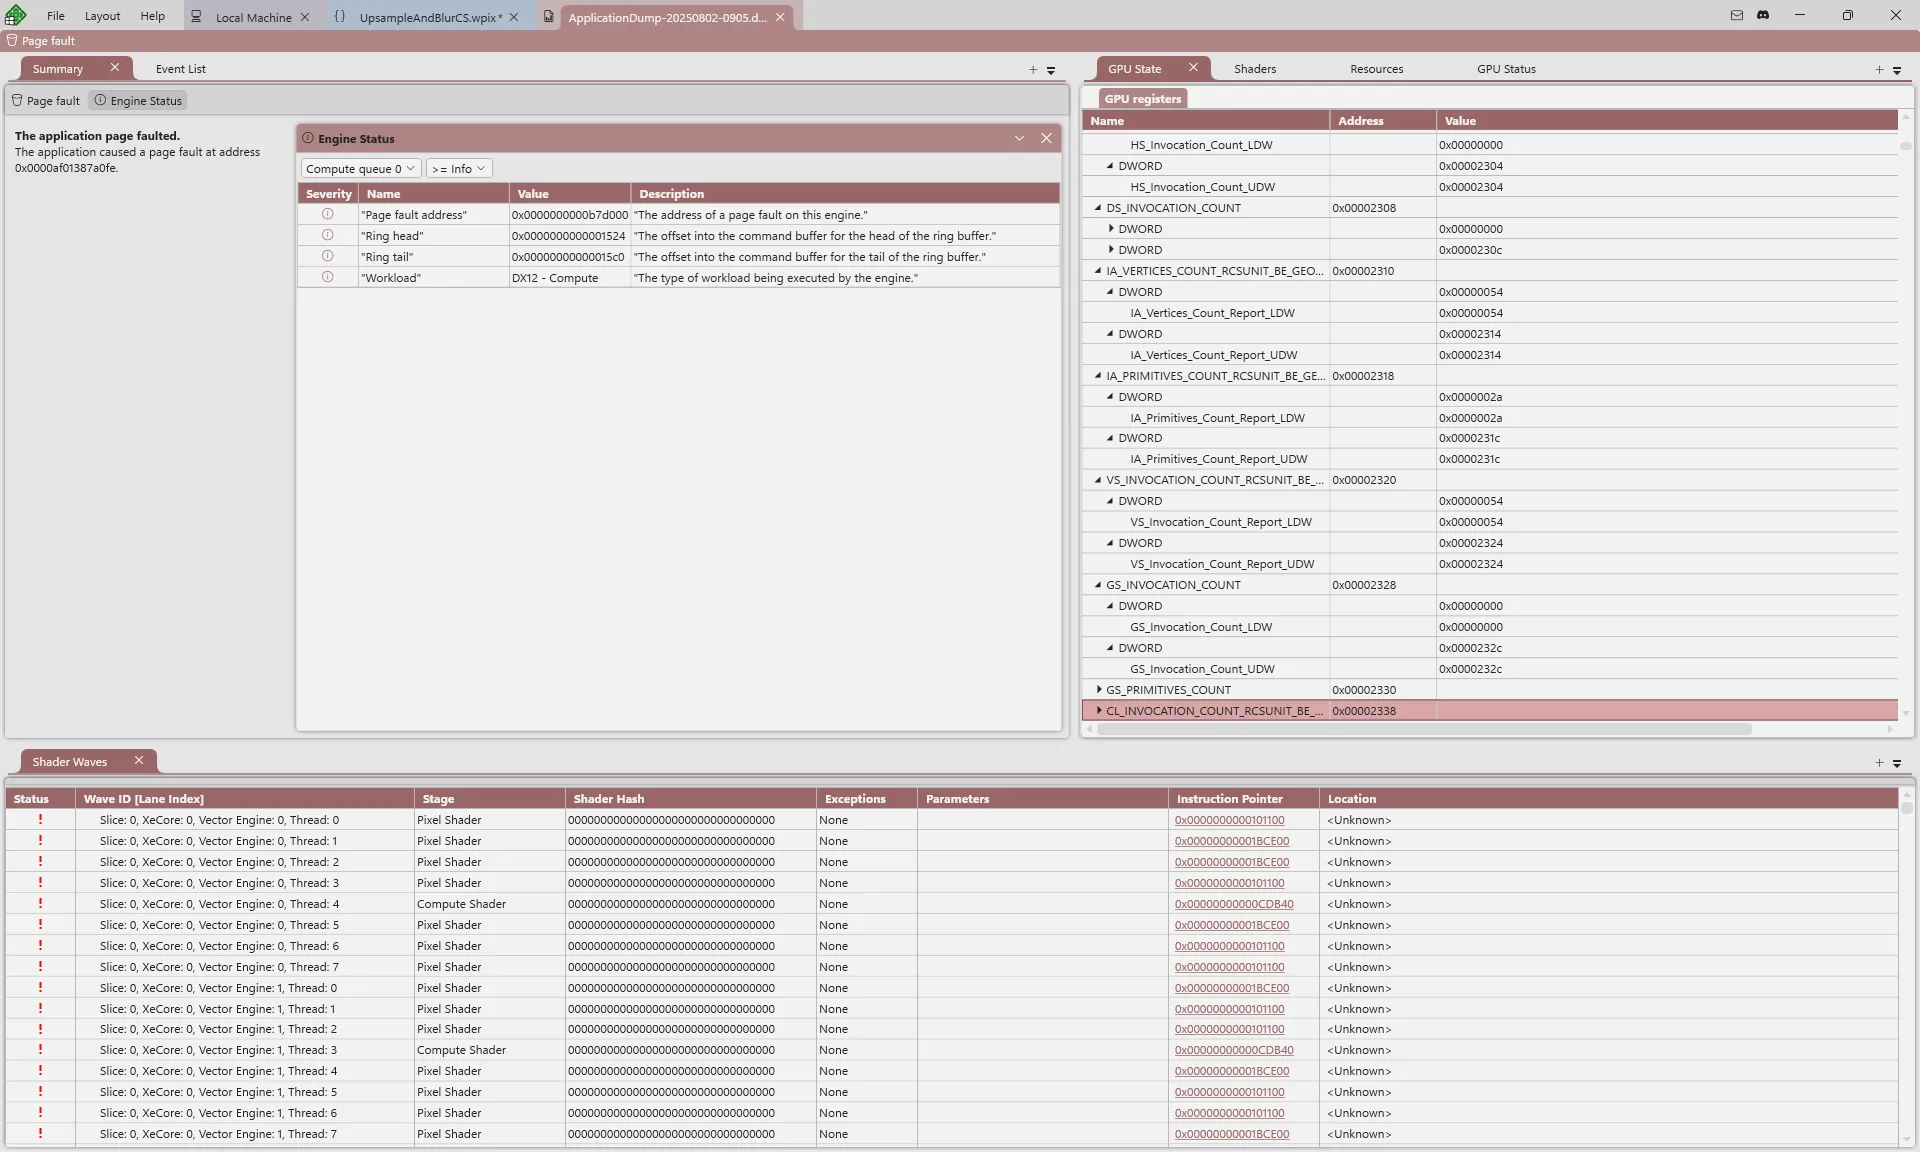
PIX provides full support for analyzing crashes with DirectX Dump Files, inspired by Xbox PIX’s support for hang dumps (“HIX”). You can analyze any crash with a DirectX Dump File in the PIX UI, regardless of which hardware it was generated on.
All four hardware partners have written PIX plugins to decode their hardware and driver state collected in the dump files via the standardized DirectX Dump File UI in PIX, which they each demonstrated during our GDC session.
AMD Demo of DirectX Dump Files in PIX:

Intel Demo of DirectX Dump Files in PIX:
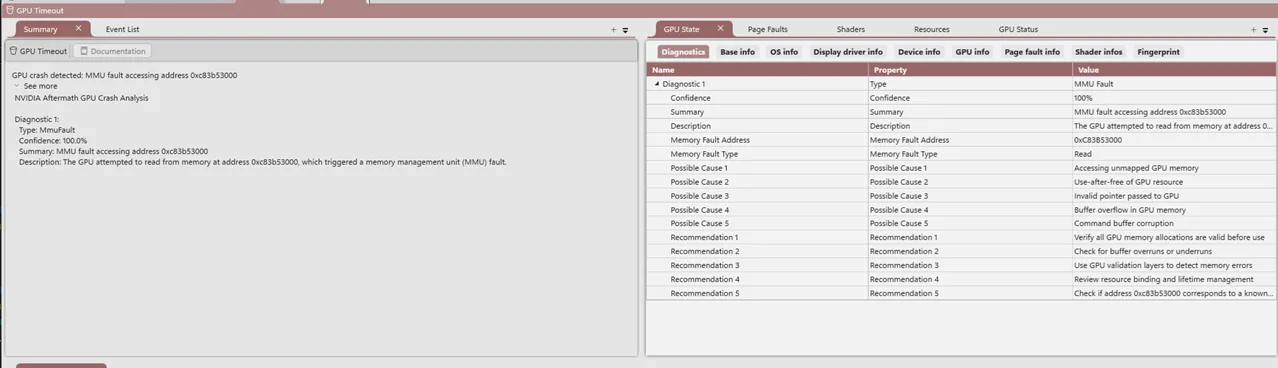
NVIDIA Demo of DirectX Dump Files in PIX:
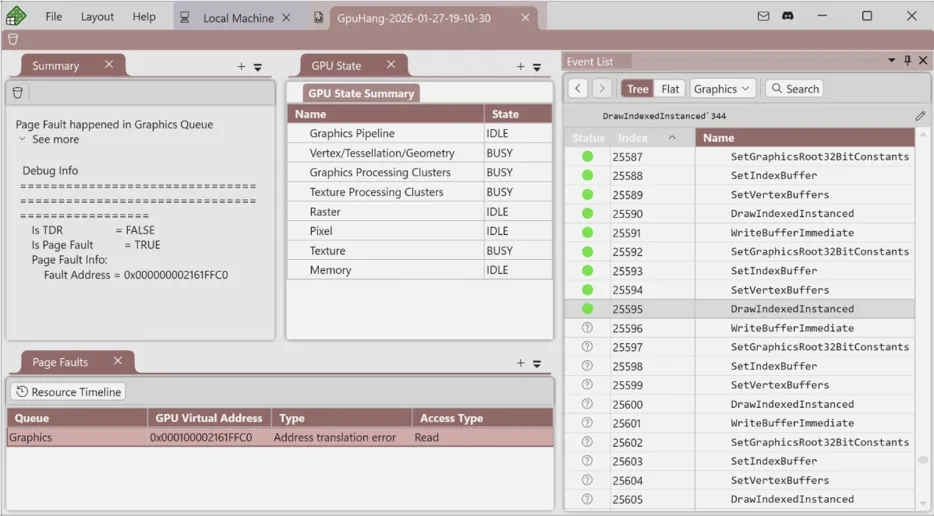
Qualcomm Demo of DirectX Dump Files in PIX:
The PIX API also supports programmatic analysis of a GPU crash and extracting information from a DirectX Dump File. These APIs let you write C++, C#, or Python scripts to investigate crashes in your own environment. This could, for example, be used to analyze DirectX Dump Files that you have gathered from retail users’ machines to analyze patterns and bucketize bugs.
DirectX Dump Files will be available starting in early June 2026.
Auxiliary DirectX Features
DebugBreak() in HLSL
A new intrinsic is coming in April in Shader Model 6.10: DebugBreak().
DebugBreak() will be critical for Live Shader Debugging (see below) but in the short term it can also be used to improve the actionability of DirectX Dump Files. We are adding new D3D12 pipeline state object flags to configure DebugBreak()’s behavior, with one option letting you tell the driver to halt the GPU and immediately trigger a DirectX Dump File when a DebugBreak() is hit. This will enable abort-like behaviors, both in development and even in retail scenarios if necessary, allowing crash dumps to point more accurately to the first problem that occurred rather than a downstream consequence of it that crashed the GPU.
You can read the full spec here.
PIX Event Configurability
PIX events and markers, such as PIXBeginEvent(), have multiple competing use cases: debugging and profiling. Changes to increase their helpfulness for one use case may hurt the other one. This is the main reason why, until now, PIX events would be absorbed by the D3D12 runtime and they wouldn’t reach the driver.
At GDC we announced new D3D12 APIs to let you configure this trade-off. If you tell the D3D12 runtime to pass PIX events to the driver, then the PIX events will be included in DirectX Dump Files to improve their actionability. This configuration also lets other driver-level tools use PIX events: see the Partner Announcements section below for examples of this in action.
Preview: Live Shader Debugging
At GDC we previewed Live Shader Debugging: real-time, on-chip shader debugging that’s coming to Windows. This is a much-loved Xbox feature that we are working to bring to Windows for the first time. It is designed to help you catch ‘needle in the haystack’ type problems – the kind of GPU bugs that are hardest to track down today. This is the deepest GPU tooling collaboration with hardware vendors in Windows history.
We are targeting the first release of this in 2027. We appreciate that it’s very early to announce a feature like this. However, you are likely to see public work for this in the coming months (DebugBreak() above is a good example!) so we wanted to provide some context now about our goals and motivations. Stay tuned for more details later in 2026 and 2027.
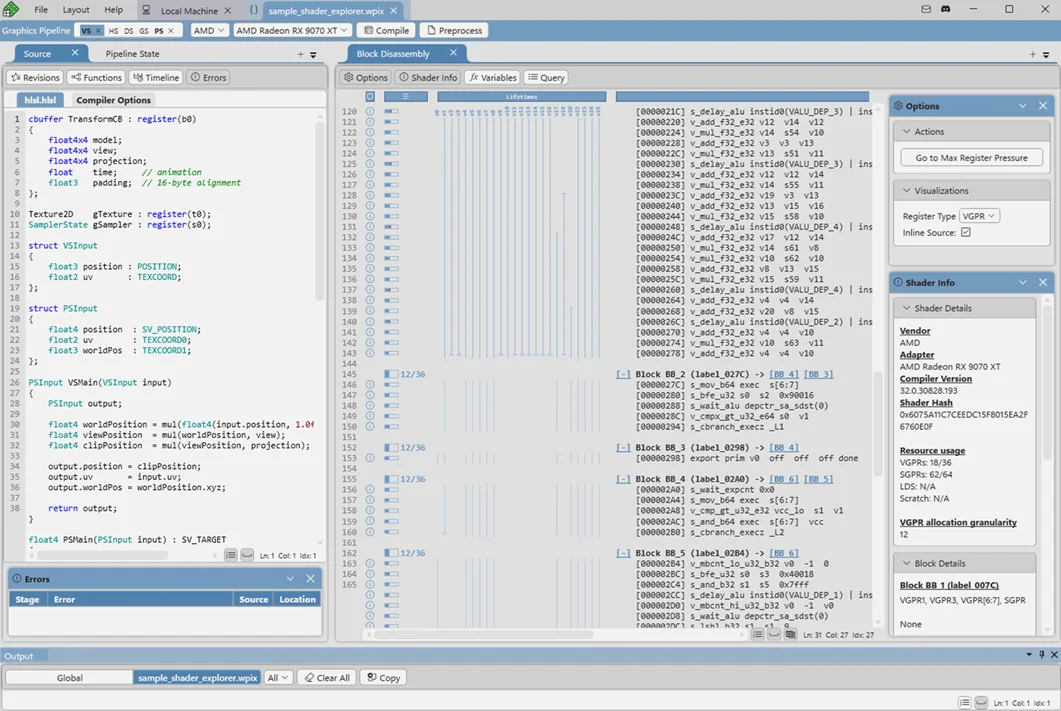
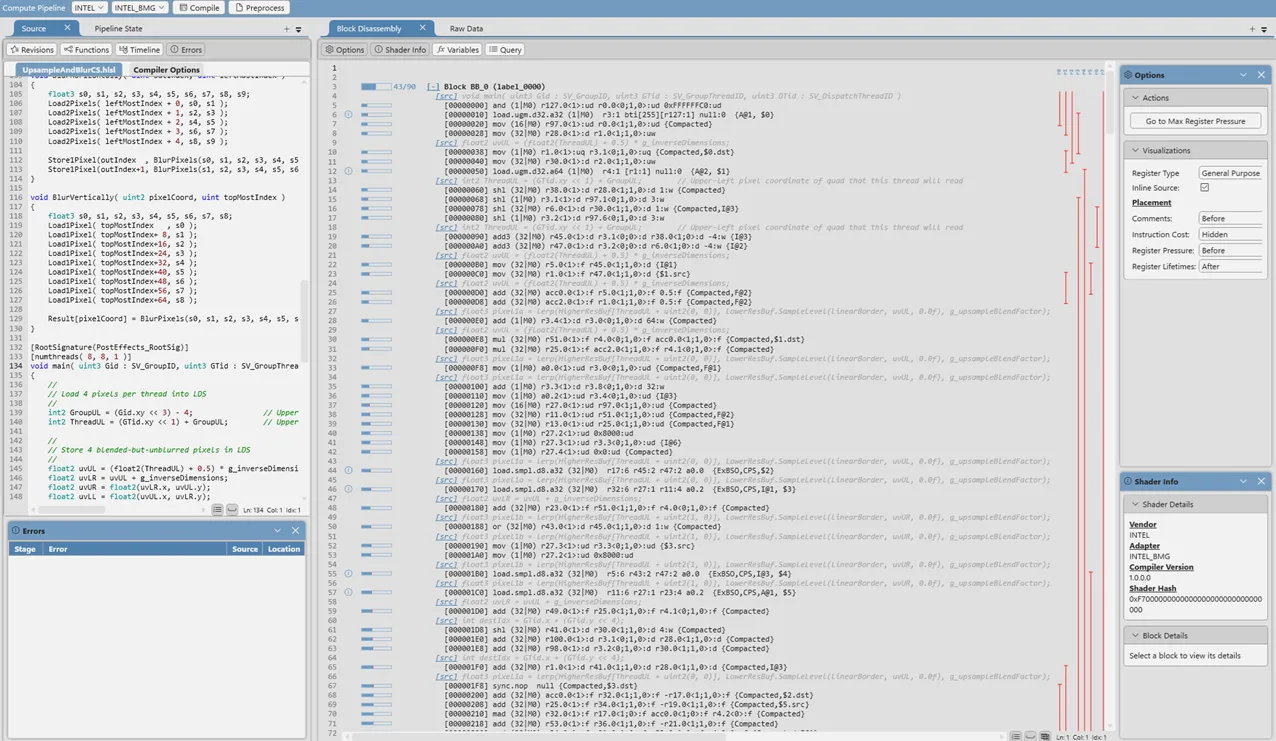
Shader Explorer
We’re thrilled to announce the first version of Shader Explorer for PIX on Windows. Shader Explorer builds on the back-end shader compilers that driver writers must create as part of Advanced Shader Delivery. Together with PIX, they now give you low-level compile-time performance insights for your shaders alongside your HLSL.
Insights that it may show include:
- Register usage and pressure, including automatic features to take you to the max register pressure
- Basic blocks
- Per-instruction data and control dependencies
- HLSL<->ISA correlation (including inlining)
- Per-instruction documentation
Since the compiler is decoupled from the driver, you can use Shader Explorer to analyze shaders for GPUs that you don’t own.
AMD Demo of Shader Explorer in PIX:
Intel Demo of Shader Explorer in PIX:
The Shader Explorer Workflow
Shader Explorer integrates deeply into PIX’s GPU Captures, giving you an intuitive iterative optimization flow:
- Take a GPU Capture of your application and open it in PIX.
- Analyze your capture and find an interesting shader to optimize.
- Export that shader and its pipeline state object into Shader Explorer.
- Iterate on that shader, making changes guided by the static analysis insights. You can select different target GPUs to see how your changes affect each one.
- Export that shader back into your GPU Capture and see its effect on rendering and performance.
You can alternatively just directly load a HLSL file into Shader Explorer and iterate on it, without taking a PIX GPU Capture first.
You can also use the PIX API to analyze shaders programmatically, enabling you to write your own tools to analyze any or all of your shaders in bulk.
Shader Explorer has day one support from AMD and Intel. This collaboration brings new hardware-specific optimization guidance directly into PIX’s workflow.
Partner Announcements
During the GDC session, we were joined on stage by all four Windows GPU hardware partners: AMD, Intel, NVIDIA, and Qualcomm. We are deeply appreciative of these collaborations to make Windows GPU tooling as great as possible.
The features we announced today are the result of deep collaboration across the ecosystem. All four partners demonstrated DirectX Dump Files on their respective hardware during the session, and all four have invested in PIX plugin support to surface their hardware-specific information through PIX’s standardized UI.
Beyond that shared foundation, our partners shared what else they’ve been working on. We encourage you to check them out.
AMD
AMD announced two integrations that go well beyond DirectX Dump Files support.
First, they built interop between PIX and Radeon Raytracing Analyzer (RRA). This new integration allows PIX users to export an Acceleration Structure out of a PIX GPU Capture and deeply analyze it inside RRA, bringing together the strengths of both tools.
Second, AMD showed how the new PIX Event Configurability APIs improve Radeon Graphics Profiler (RGP). With driver-level PIX markers enabled, RGP can now show your PIX markers natively without requiring any PIX header changes – they just work.
For more on AMD’s support for PIX, see here
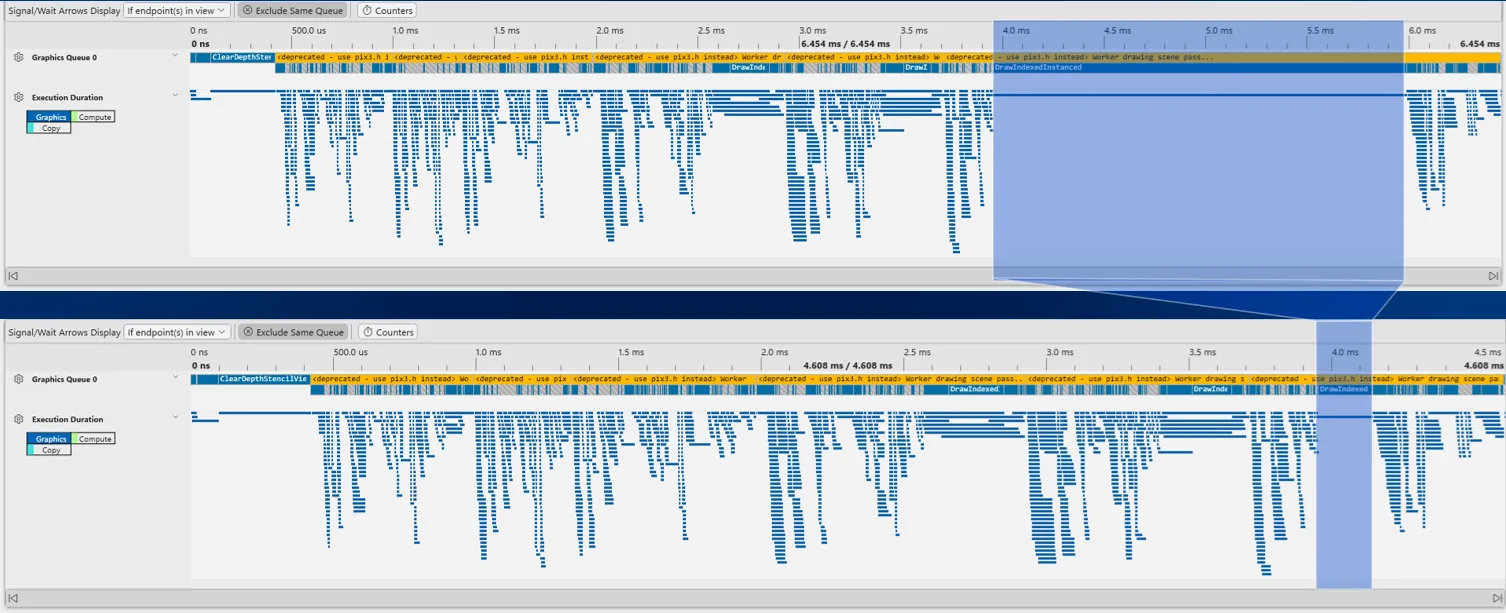
Intel
Intel announced that their collaboration with Microsoft on PIX has moved to a whole new level, extending beyond Intel-specific PIX plugin development and into the core of PIX itself, helping to make the tool even better for all developers. They previewed their work to improve the reliability of Timing Data in GPU Captures, by filtering out misleading data caused by GPU preemption from other processes. This is just the start, and we’re excited for what Intel and PIX will build together next.
For more on Intel’s support for PIX, see here.
More PIX Announcements
Here is a wide range of new PIX features also coming in this wave. We will share more details about each of these in ~May 2026 when they are released alongside the other PIX features above.
PIX API
Our long-term vision is to give you programmatic access to everything that you can see inside the PIX UI. At GDC we announced that the PIX API will be available publicly in May 2026, with support for C++, C#, and Python. It uses a D3D12-style nano-COM interface, supports all new PIX features immediately, and will light up existing PIX features over time.
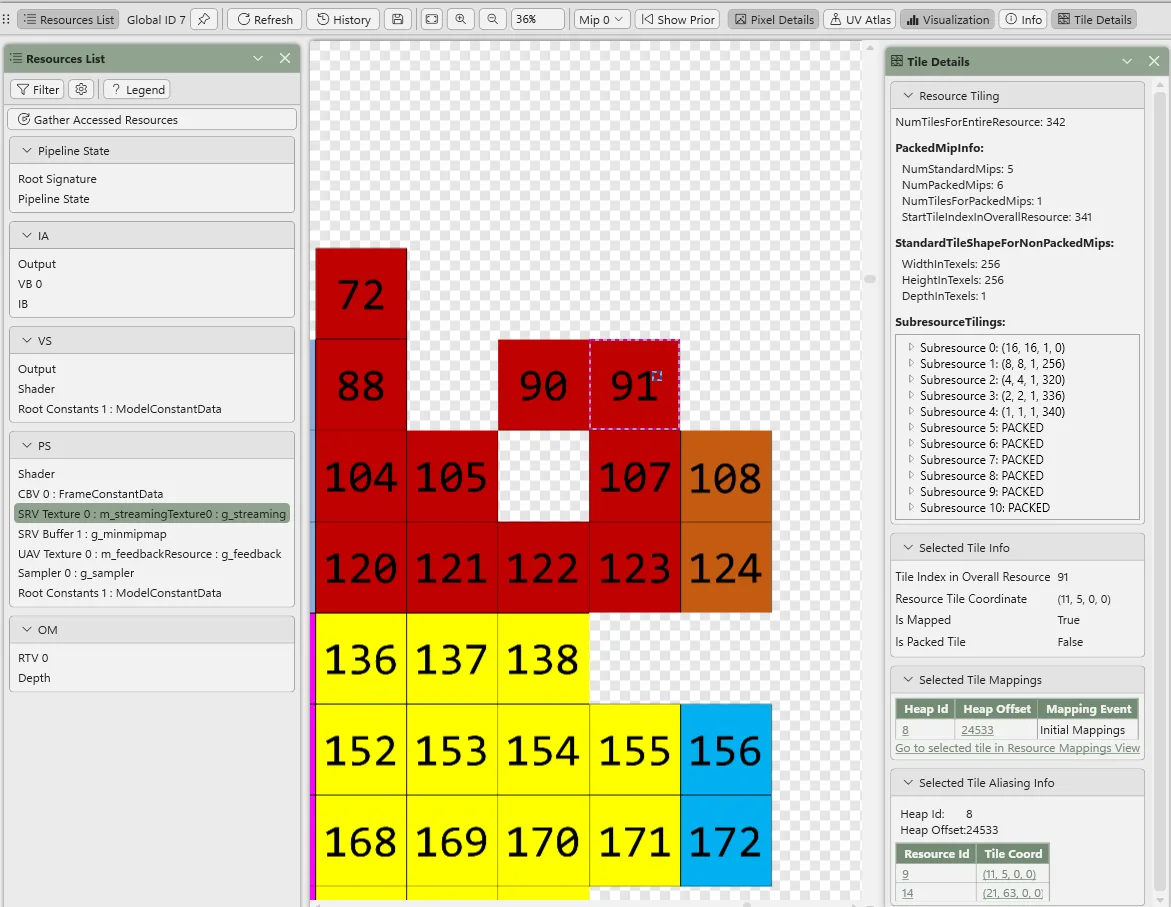
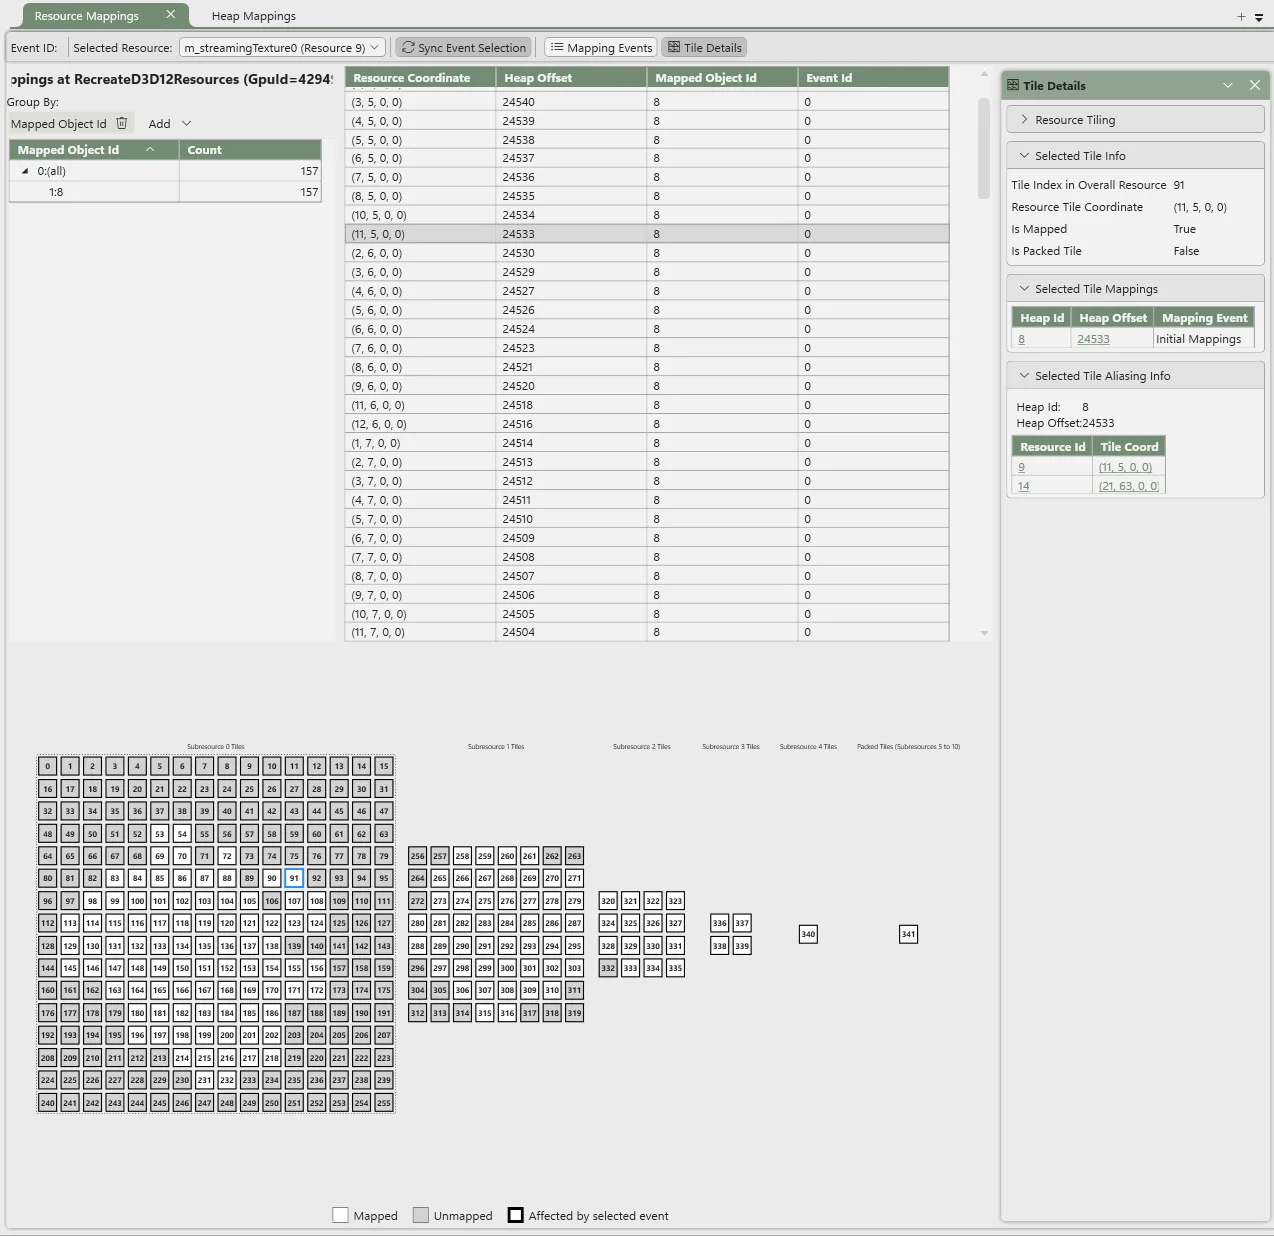
Tile Mappings Viewer
We are bringing a dedicated Tile Mappings viewer to PIX to help you debug and fix issues with your tiled/reserved resource mappings. It includes the ability to see tile information for your selected pixel in the Texture Viewer, see the mappings (including visually) for a particular resource, and see the resources mapped into a particular heap. This will also be helpful for upcoming DirectX features – stay tuned.
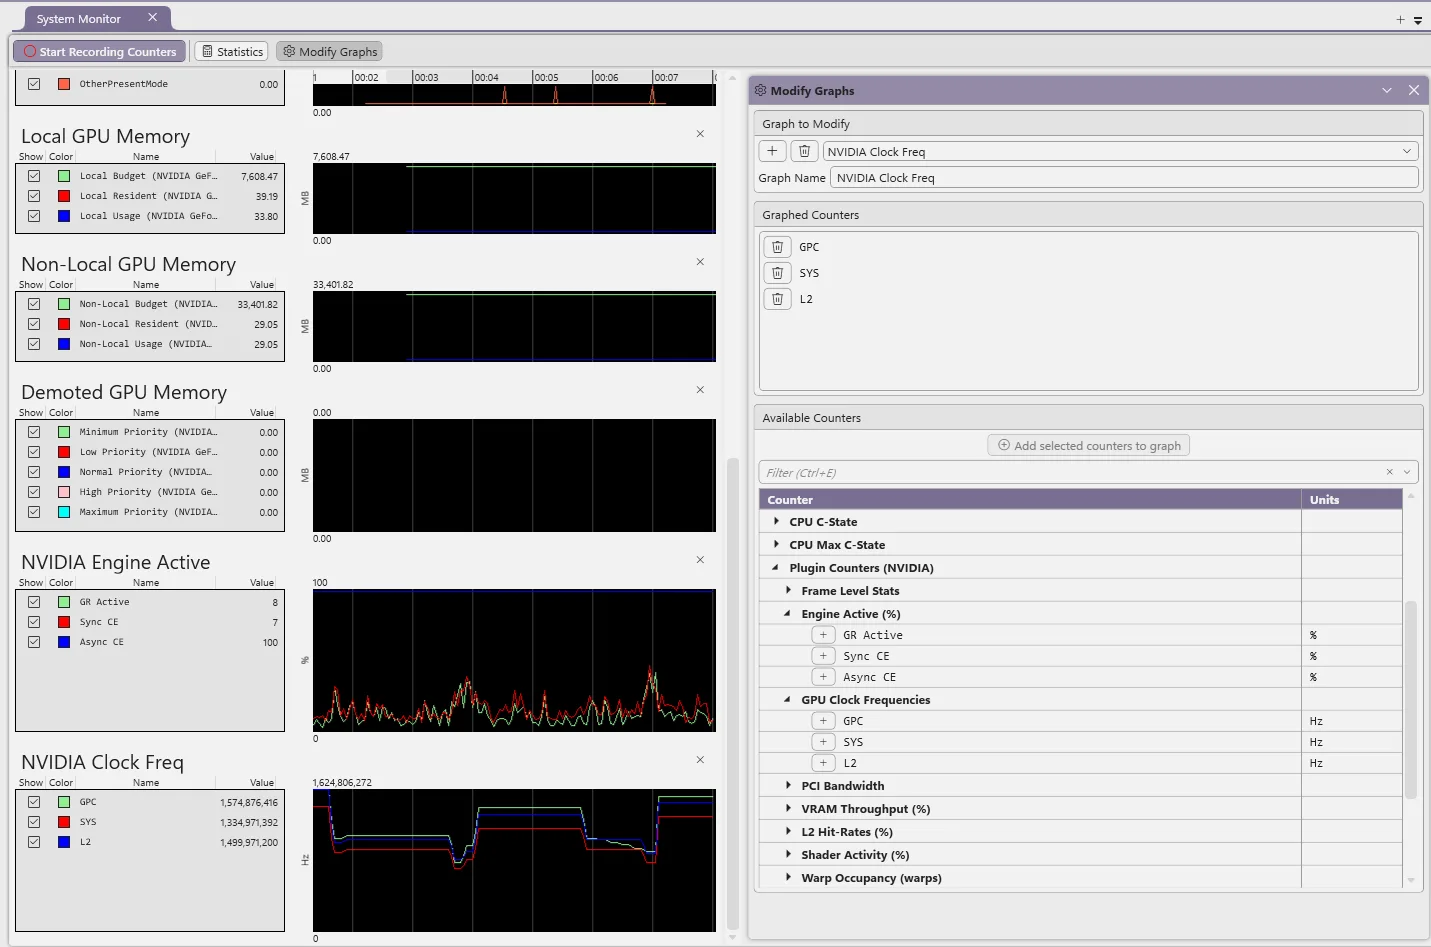
GPU Hardware Counters in System Monitor
PIX’s system monitor view can now show low-level hardware-specific counters while your application runs, powered by our hardware partners’ PIX plugins. These complement existing cross-platform GPU and CPU counters in System Monitor today.
New GPU Capture File Format
We have been working hard to rewrite our GPU Capture file format, and we are pleased to announce the first release of this in May 2026.
This first release comes with three main improvements:
- Performance improvements: 40% faster start analysis times for UE5 so far
- The ability to save Shader PDBs back into the capture file
- The ability to show GPU Capture screenshot thumbnails in File Explorer
We are excited by the potential of this new file format. We look forward to building many new PIX features on top of it – stay tuned for details later in 2026!
Capture/Replay Reliability
We have made many reliability improvements to PIX’s capture and replay infrastructure. This includes turning on new D3D features by default, such as Application-Specific Driver State and RecreateAtGpuva, along with many other fixes to improve the consistency and reliability of your GPU captures.
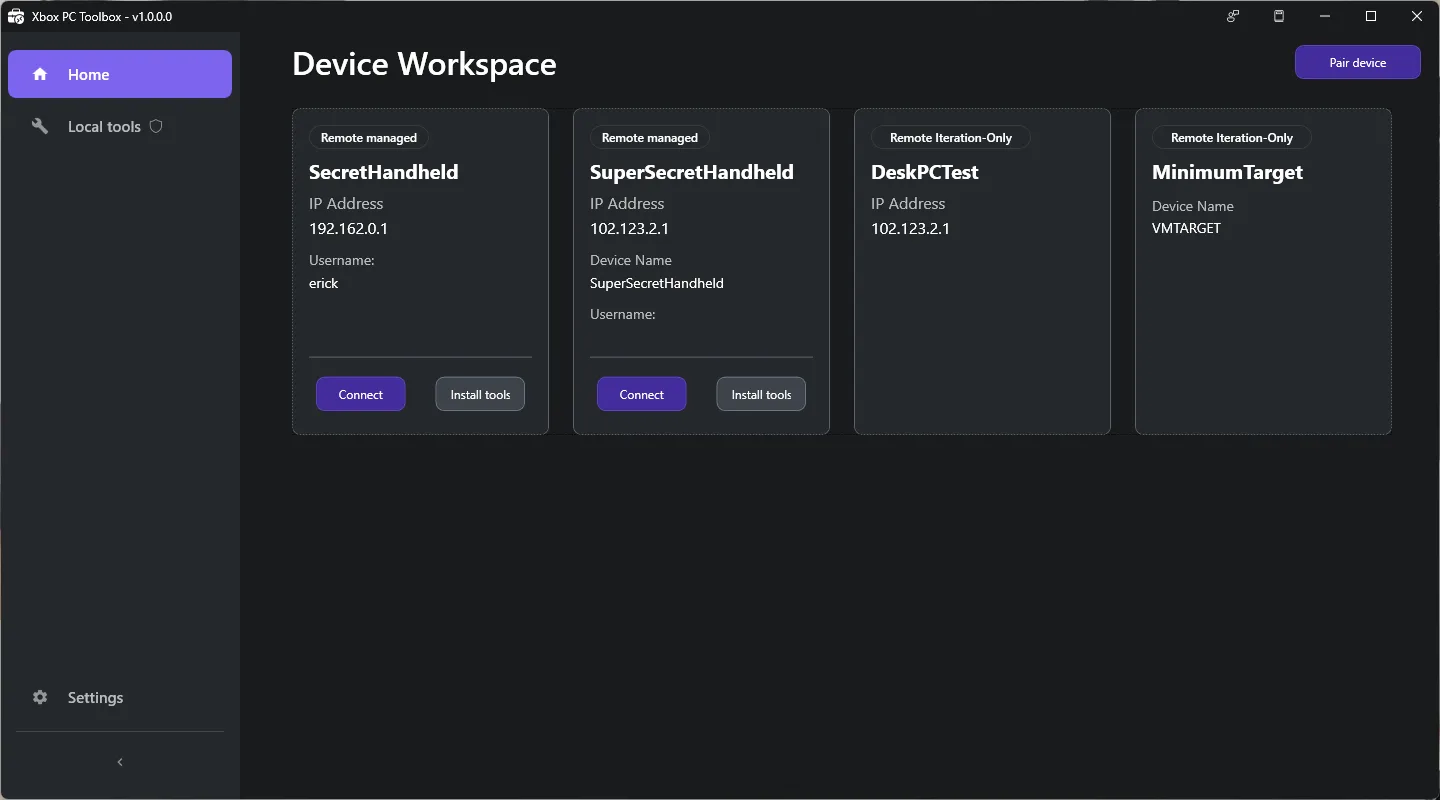
Remote Deployment
We announced new PIX remote deployment features, building on Remote Windows Game Development Tools. Once your local device is paired with a remote device via these remote tools, PIX will be able to automatically deploy itself to your remote machine and connect – removing the need for you to manually run PIX on both devices. This greatly streamlines multi-device development workflows.
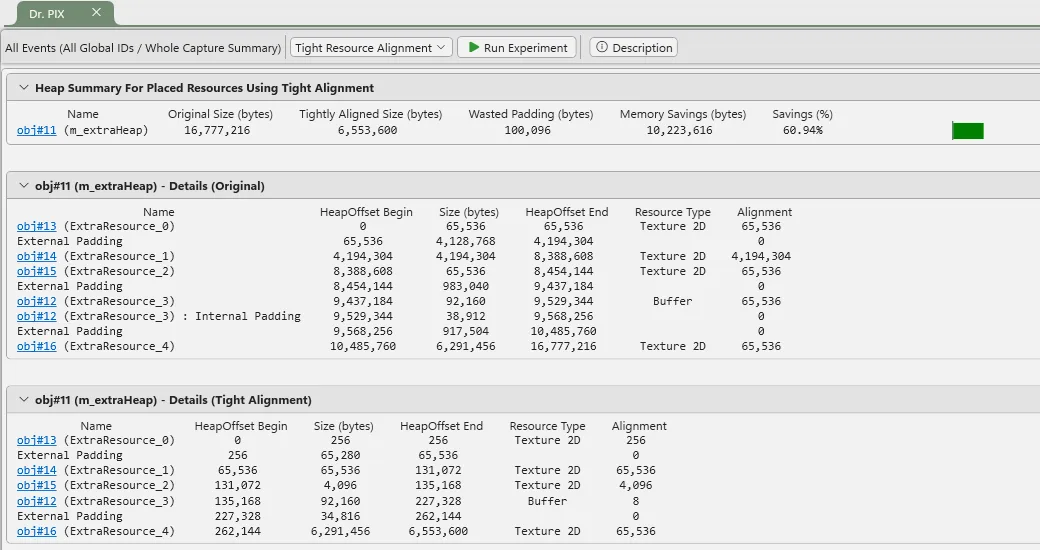
Dr PIX
Several improvements to Dr PIX are coming: a new PIX API to access and run all existing experiments, and a new experiment to help you measure how much improvement D3D12’s new Tight Alignment flag could bring to your application. These join last year’s NonUniformResourceIndexing experiment in making Dr PIX an increasingly powerful tool for finding performance wins.
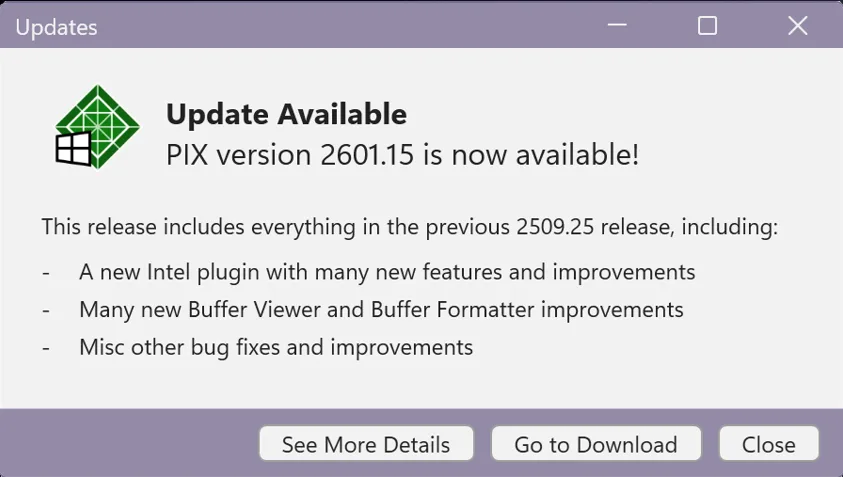
Update Notifications + What’s New
PIX will now automatically notify you when a new version is available, and an updated What’s New page is built directly into PIX so you can easily see what changed.
Machine Learning
PIX supports new ML-driven graphics workloads. For more information, please visit our ML blog.
Coming in May 2026
Our biggest wave of new Windows GPU tooling features ever will mostly be available in preview in May 2026, with the DirectX Dump Files preview coming in early June 2026. DirectX Dump Files will reach retail availability in ~October 2026. Shader Explorer v2 with live/online analysis features will follow in late 2026.
Get in Touch
We are incredibly excited about this wave of new features and the deepening collaboration with our hardware partners. This is just the next big step – we will keep building toward our dream of console-level GPU developer tools on Windows.
We’d love to hear from you:
- Discord: https://discord.gg/directx (look for the #pix channel)
- Email: pix@microsoft.com
- Or use the feedback buttons in PIX
0 comments