Postmortem: Azure DevOps Service Outages in October 2018
Earlier this month, Azure DevOps experienced several significant service outages, for which we are deeply sorry. As with every significant live site incident, we have completed a detailed root cause analysis for these. Due to the proximity of these incidents and common underlying causes, we wanted to share the details with you to ensure that you know what happened and what we’re doing to prevent them from recurring.
October 3, 4 and 8 Incidents
The incident on Wednesday, 3 October 2018 started with a networking issue in the North Central US region. Since our authentication service, SPS, is in this region the issue impacted several of our scale units.
In the customer impact chart below, you can see that most scale units recovered quickly except for the two scale units in South Central US (SU3 and SU5) which took longer to recover, particularly with SU3 where the incident lasted for 75 minutes.
Initially we attributed this to a brief networking issue, but we did not fully understand why it took so long for SU3 to recover. It was a harbinger of the follow-on incidents. The real problem in this incident was not the brief networking issue, but the fact that it sent the scale unit into a tailspin. More on this later.
The next day on Thursday, 4 October 2018, we hit a very similar incident and initially attributed it to another networking issue. You can see from the customer impact chart below that this incident lasted about an hour, primarily impacting customers on SU3 in the South Central US region.
When we followed up with the Azure networking team, we learned that there were no networking issues during this period. We did find a brief 90 second spike in SPS response time starting at 17:48 UTC which precipitated the issue on SU3.
On Monday, 8 October 2018, a number of scale units were impacted by another outage. We saw brief instability with most scale units recovering quickly while three scale units experienced a prolonged outage especially one of our West Europe scale units.
During each of the incidents, we reacted by collecting a dump from an unhealthy Application Tier machine (AT) and then recycling the machines. We follow a practice of pulling one AT out of the load balancer at time to recycle it. We found that this was not helping resolve the incident and had to resort to restarting all the ATs in quick succession.
After the second incident, we realized there was something fundamentally wrong with the service, so we analyzed the telemetry and poured over the dumps. We saw high request queuing which is typical if a dependency is slow, but the request queue remained high well after the dependency had recovered. We have circuit breakers built in for external dependencies and did not see circuit breakers tripping. Even after analyzing the dumps, we could still not determine why a brief outage in a dependency was causing such an extended outage in TFS.
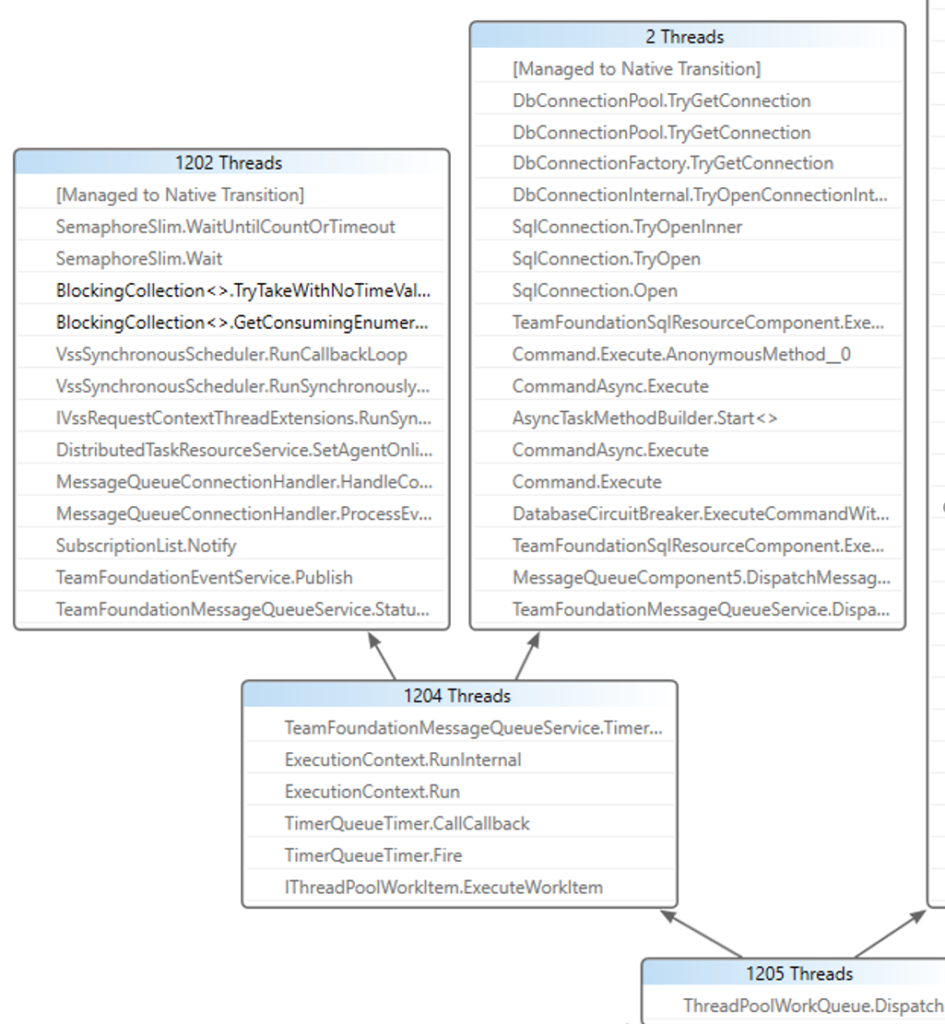
A breakthrough came during the Monday incident, when one of our engineers observed that after a machine was pulled out of the load balancer to collect a dump, the thread count on the machine continued to rise, showing that something was going on even with no load coming to the machine. He took a dump and analyzed the active threads, and found:
You can see 1202 threads all have the same call stack.
The key call is this one:
Server.DistributedTaskResourceService.SetAgentOnline
Agent machines (build agents and release agents) send a heartbeat signal once a minute to signal to the service that they are still online. If we haven’t heard from an agent for more than a minute, we mark it offline and require the agent to reconnect to signal it is once again available. During these brief periods, agents couldn’t connect to the service, so we marked them offline. The agents continued to retry connecting and eventually succeed.
As they succeeded, we stored the agent in an in-memory list on the AT, and then queued a timer job to process them so in cases like this one, where potentially 1000s of agents are reconnecting at a time, we will batch process recording them as online.
Recently we have been adopting asynchronous call patterns in preparation for moving to ASP.NET core. Since we are still on ASP.NET which is synchronous, the code is synchronizing the async calls. Some of this code was added in the Sprint 140 deployment which has been fully deployed for weeks.
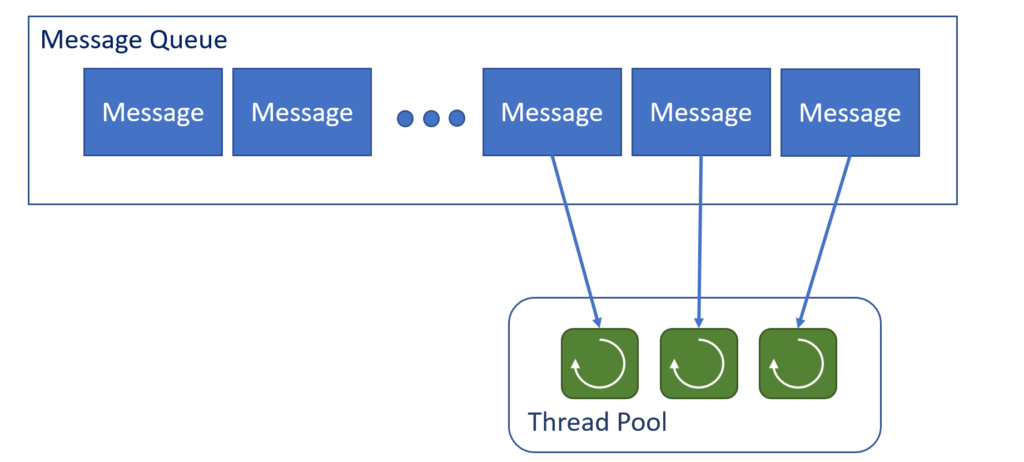
The .NET message queue keeps a queue of messages to process and maintains a thread pool where, as a thread becomes available, it will service the next message in the queue.
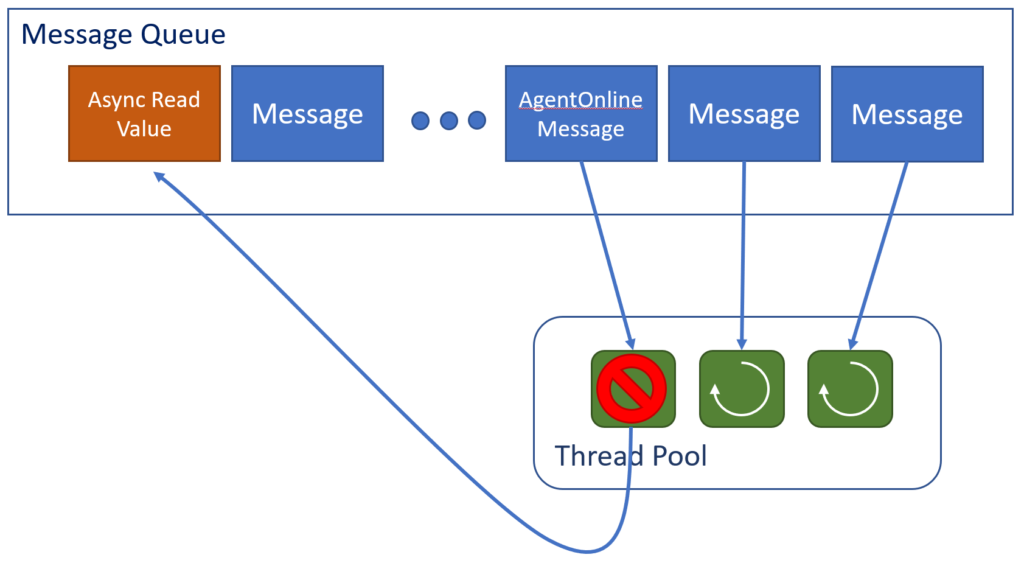
The thread pool in this case is smaller than the queue, so for N threads we are simultaneously processing N messages. When an async call is made it uses the same message queue and queues up a new message to complete the async call to read the value.
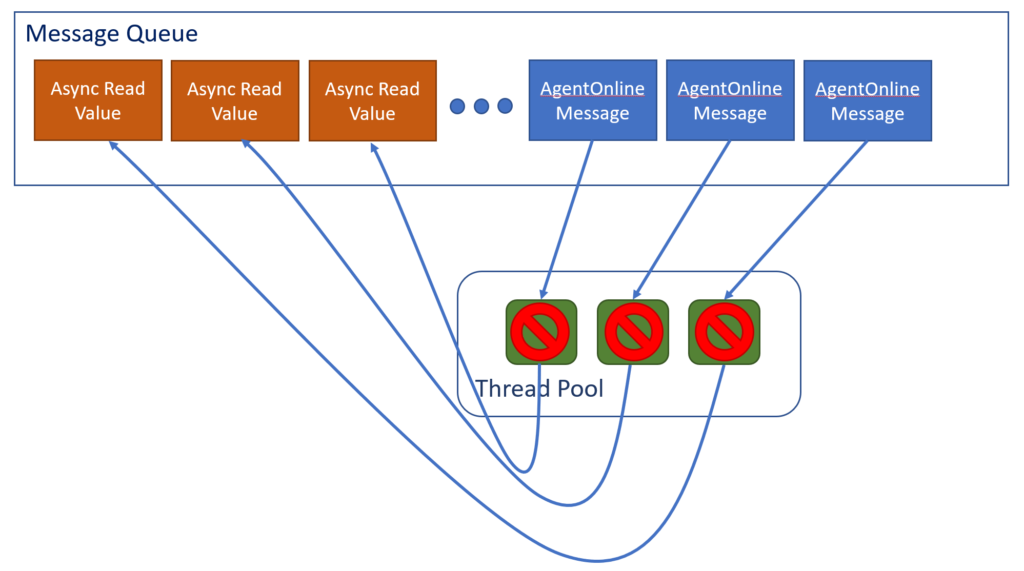
But since this call is now at the end of the queue, and all the threads are occupied processing other messages, the call will not complete until the other messages in front of it have completed, tying up one thread. As soon as we are processing N of these messages, where N equals the number of threads, we are at a standstill. As a result, an AT that gets into this state can no longer process requests, including health probe requests, causing the load balancer to take it out of rotation.
Our immediate fix was to conditionalize this code so we weren’t making this async call any more since the pool providers feature hasn’t been rolled out yet.
Here are the repair items we will complete as a result of these incidents:
- Hold off on adopting async patterns. Getting this right is tricky, and unless the entire stack is async, doing sync over async can lead to this class of issue.
- Move the message queue service to a separate app pool. The message queue service is the service that manages the agent connections. By moving it to a separate app pool it will isolate most user functionality from issues like this one.
- Add a mitigation to recycle all app pools at once in extreme circumstances.
- Do fault injection testing to simulate slow SPS calls on SU0 (our dogfooding instance). We have done this in the past and will pick up a regular cadence for doing it. One tricky aspect here is scale. We do have large machine pools we are using for running our CI tests and will also dial down our thread pools sizes on SU0 to ensure we catch this class of incident.
- Create region specific DevOps dashboards including all services to evaluate the health during incident. Currently we do not have a dashboard that shows all services in a given region. That would be helpful for the class of incident that are specific to a particular region.
October 10 Incident
On Wednesday, 10 October 2018 we hit an incident with a 15-minute impact for most TFS scale units, but a prolonged impact to one of our West Europe scale units.
The initial impact was caused by a spike in slow response times from SPS, which was ultimately caused by contention in the one of the databases. One thing putting pressure on SPS was a TFS deployment we did. When we deploy TFS, we deploy sets of scale units called deployment rings. When the deployment completes for a given scale unit, it puts extra pressure on SPS as it re-hydrates identity caches. To accommodate that extra load, we have built-in delays between scale unit deployments. We are also in the process of “sharding” SPS in preparation to break it into multiple scale units. The combination of these things caused concurrency circuit breakers to trip in the database, leading to slow response times and failed calls.
As I said above, most TFS scale units recovered quickly, but our WEU-2 scale unit did not recover on its own.
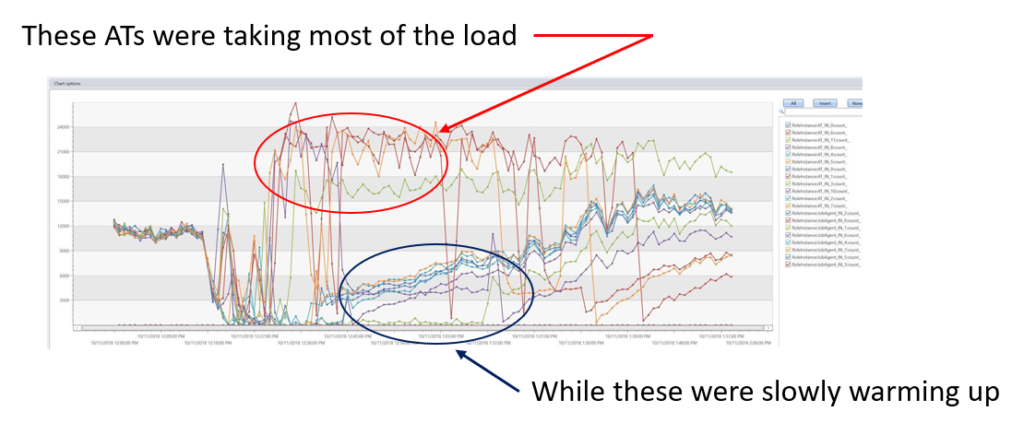
We looked at the ATs and could see a few unhealthy ATs that appeared to be carrying most of the traffic, but not able to keep up. What we see is ATs 1, 6, 8 and 10 recovering more quickly, and then taking on all the load while the other ATs slowly ramp up.
Looking at our activity log, we were able to see these few ATs serving up most of the requests:
And most of the slow and failed requests came from these stressed out ATs:
 So, what was going on here? ATs 1, 6, 7 and 10 reported back to the load balancer that they were healthy before the other ATs did, resulting in the load balancer sending them all the requests.
Then as the other ATs came online, the load balancer evenly distributes new requests to all available ATs, including those ATs that were struggling since they had not yet breached the unhealthy threshold.
We mitigated this incident by manually recycling the unhealthy scale units.
Here are the repair items that came out of this incident:
- Increase the delays between scale unit VIP swaps
- Check SPS health before VIP swap and wait to VIP swap until SPS is healthy
- Add concurrency thresholds to the SPS client to reduce traffic from a given AT
- Increase the size of the SPS DB
- Add a mitigation to recycle all ATs at the same time
- Add a hot path alert on health checks to get alerted to severe incidents sooner. We got an alert right about the time of the first customer escalation, and are investing in getting a faster signal
- Investigate ways to more evenly balance the load between ATs
Conclusion
We apologize for the impact these incidents have had on you and your team. Since we use the service daily, we know how impactful these outages can be. As a result, we have been working on fixing these issues with high priority and urgency. In addition, we are committed to learn from these incidents, so we can improve our resiliency, detection, and mitigation capabilities with an aim to avoid these types of outages in the future.
Ed Glas Principal Group Engineer Manager, Azure DevOps




 Light
Light Dark
Dark