A week ago we posted an incomplete postmortem and are now following up with the completed version. If you want the full story of how we progressed through this incident, start by reading that. This postmortem will cover the full root cause analysis but it won’t rehash the first part of the investigation.
Customer Impact
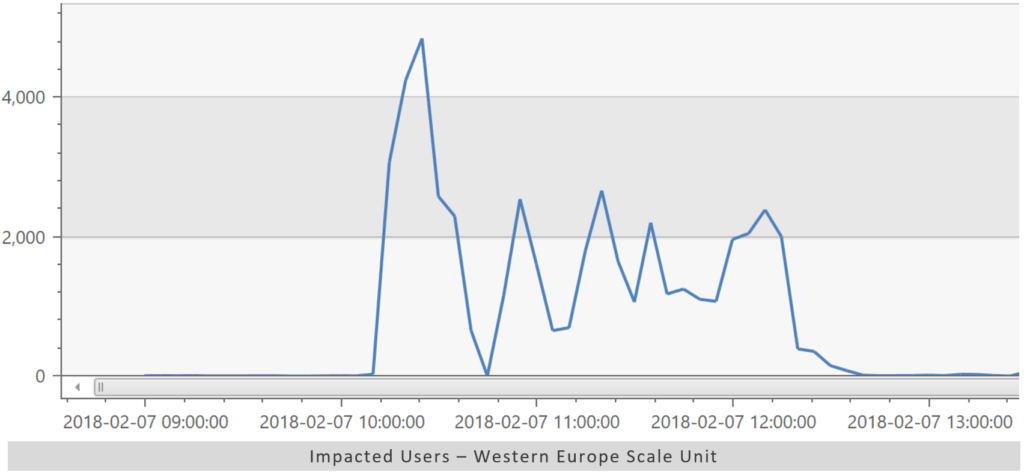
On 7 February 2018 we had an incident which impacted users in our Western European scale unit. During this time, users experienced slow performance and 503 errors (service unavailable) when interacting with VSTS services. Close to 5,000 users were impacted at the peak of the incident. The incident lasted for two and a half hours from 10:10 – 12:40 UTC.
Quick aside on the graphs shown in this post: All times are in UTC and all graphs were generated using the internal version of Azure Log Analytics, lovingly known to us as “Kusto”. We’re on an old version of the client which is why our graphs look different than those produced by the public version of Azure Log Analytics. We cannot praise the Log Analytics team enough for the product they produced. It has fundamentally changed how we do DevOps and we couldn’t imagine trying to do this type of analysis without it.
In the earlier postmortem, we posed these two questions:
- What caused the initial failure?
- Why didn’t the system automatically recover given the reactive measures we already have in place?
When doing a postmortem for a long running incident like this, it is usually the case that what caused the start of the incident is the same thing that made the incident long running. That is, you can identify an event (e.g., a deployment carrying a bug, an increase in load, a bad SQL query plan, etc.) that causes the system to go into a bad state, and the system will stay in that state until you undo the effects of that event. It’s typically related to the root cause. We found in this situation that the event that caused the bad state and the reason for staying in that state were unrelated. That caused us to follow the wrong path repeatedly.
What caused the initial failure?
Early on, we noticed a few things. First, we noticed the spike in SignalR reconnects. Here’s the graph of reconnects that we looked at last time.
Second, we noticed that one of our databases got overwhelmed and concurrency circuit breakers were opening:
However, neither of these led us to the initial failure. The reconnects subsided rather quickly, and circuit breakers are a symptom but not a cause. This line of thinking caused us to waste time running down theories that proved incorrect (some I covered in the initial postmortem and some aren’t interesting for this write up).
In the end, we found that the SignalR reconnects triggered the incident and were the cause of the SQL circuit breakers tripping. However, those aren’t what caused it to keep going. We deal with blips like this all the time and most of the time the system recovers just fine. So, onto the real question…
Why didn’t the system automatically recover given the reactive measures we already have in place?
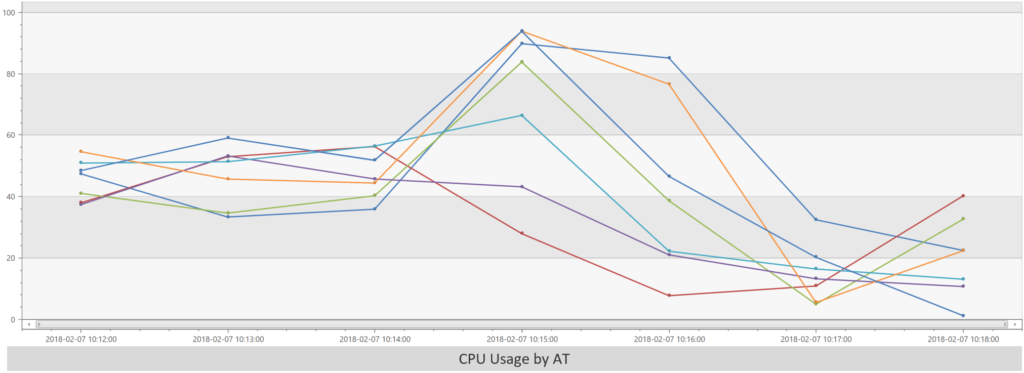
Let’s take a step back and see what happened when the event started. We see our first impact at 10:15 UTC. One key thing stands out. At 10:14, CPU usage is normal across the 7 application tiers (ATs). At 10:15, CPU usage spikes on several ATs. By 10:17, CPU usage has fallen significantly on all ATs.
Any time we see all AT CPUs move together like this, the general assumption is that there is a shared resource that is affecting all of them. So, let’s check the usual suspects. SQL?
No, database CPU drops. We check log writes / TempDB pressure just to make sure something else isn’t wrong there, and everything looks okay (though the DB CPU drop is suspicious). Network?
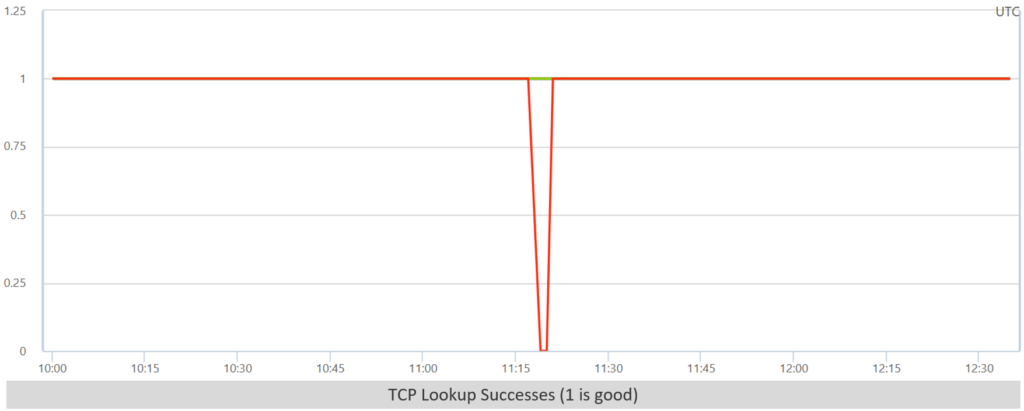
Network is fine outside of that one blip. Of course, we noticed that blip during the incident and chased it for a while. Shared Platform Services (SPS)? Looks fine. Storage? Looks fine. Redis? The exceptions for Redis accesses are spiking. That looks promising.
There is always one big question with Redis though: Is it the cause or the victim? That is, since Redis runs on all the ATs, is it the reason that the ATs are performing poorly, or, is it being impacted by High CPU on each of the ATs? It’s virtually always the victim and hardly ever a cause in our experience.
Fortunately, we’ve gotten pretty good at determining whether Redis is a victim. Since each scale unit has ATs and job agents (JA), we can look to see if the JAs are experiencing issues with Redis:
Redis is working great on the job agents. Conclusion: As usual, Redis is the victim, not the cause.
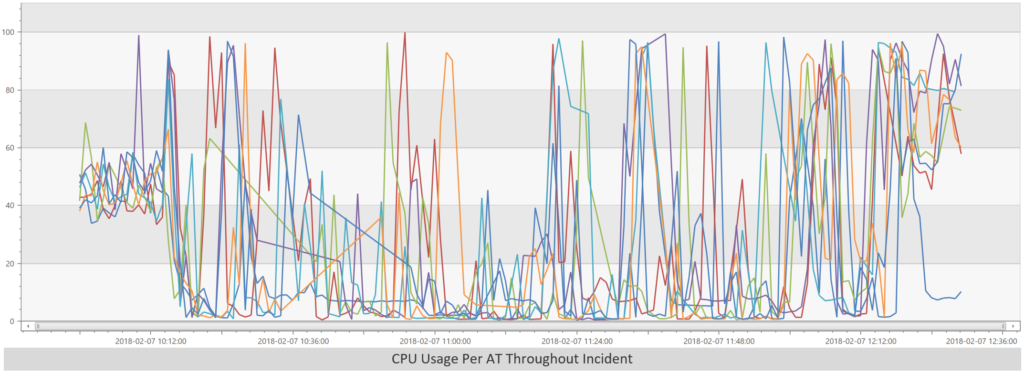
At this point, no shared resource is standing out as the problem. Let’s go back and look at the ATs again. Are they all moving together throughout the incident?
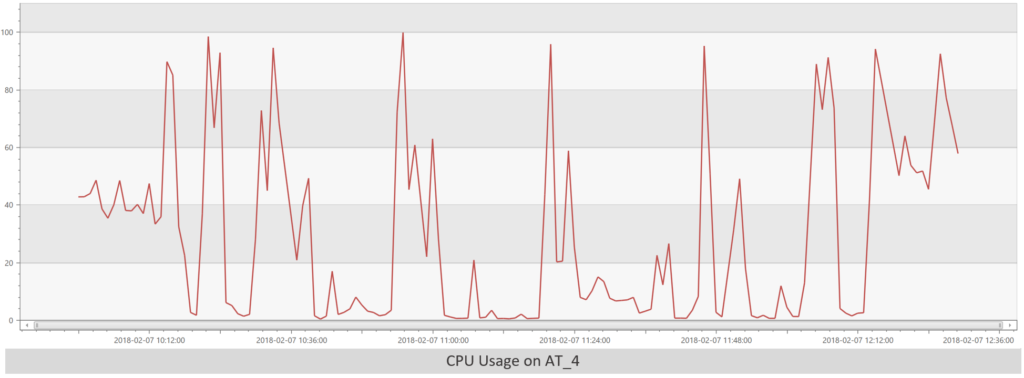
Okay, that’s suspicious. It looks like each AT is spiking at different times. Furthermore, it appears that a given AT is either doing nothing or completely slammed. Here’s a graph of CPU usage on AT_4 to show that better:
Let’s discuss background for a moment. Because of issues we’ve had in the past, we’ve created something called the VssHealthAgent which attempts to auto mitigate issues. One of the things the VssHealthAgent does is look for ATs that are under significant load, pull them out of the load balancer’s rotation, take a process dump, recycle, and then put them back in rotation. It is supposed to have the following protections in place to prevent degenerate behaviors:
- Only pull one AT out of the load balancer at a time.
- Only pull a given AT out of the load balancer once per hour.
So, does the VssHealthAgent have a bug causing it to be overzealous and continually pulling ATs out of rotation? To make a long story a little less long, while this first looked like a promising theory, ultimately the VssHealthAgent worked as expected throughout this whole period. Due to the time it takes to run the analysis on an unhealthy AT, it continually had one AT out of rotation for the whole incident, but it never had more than one in that state.
What are the ATs doing when their CPU is spiked?
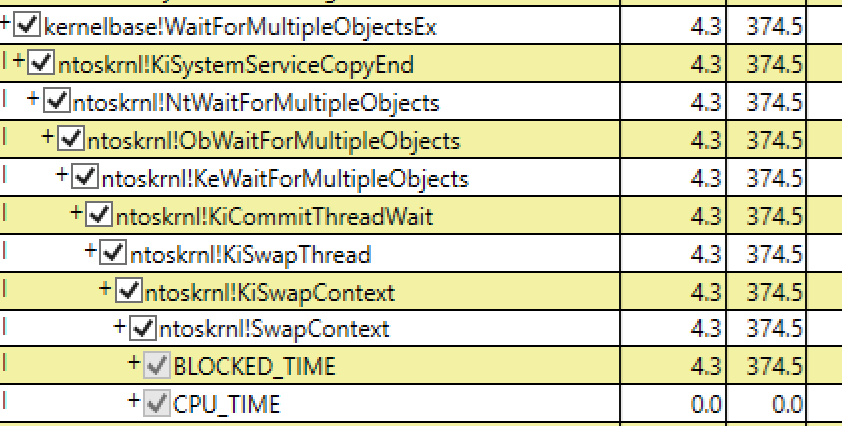
For this we need PerfView. PerfView is a tool we use frequently to diagnose performance issues. PerfView is a command line tool. How are we going to run it? We could have someone log in and run it on the machine that’s having issues, but that’s a bad idea since it’s both manual and for intermittent perf issues you’ll likely miss capturing data at the right time. To solve this, we use an internal tool called Service Profiler that’s running as a service on the VM and automatically captures PerfView traces (you can get similar functionality for your own service using Application Insights Profiler for Azure App Service). Here is what we saw in multiple PerfView captures:
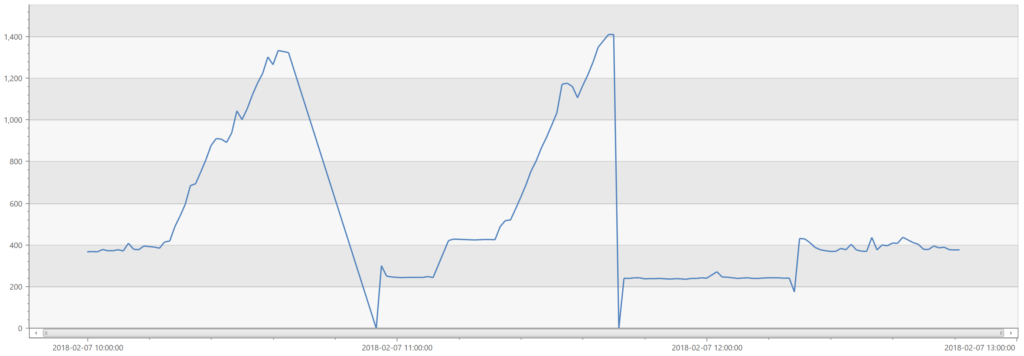
The column headers are missing from the screen shot, but that’s a kernel context swap taking 374 milliseconds. That’s an incredibly long time for a SwapContext call. A common cause for that is thread starvation. We see signs of this in the HTTP calls we’re making from the server as well – they are stuck waiting on threads to spin up. Let’s look at active thread counts on a given AT:
That jagged line indicates a problem. The way the CLR ThreadPool works is that it will expand very quickly to the number of threads specified in the MinWorker setting. Once that number is exceeded, it will throttle the addition of threads to once every 500ms. Our MinWorker setting is currently at 192. (Note, we have two processes on each AT which is why things grow quickly until it reaches close to 400). Once we exhaust that many active threads, thread creation is throttled and work starts to build up. The graph above and the PerfView analysis both indicate that the starved resource preventing work from proceeding was the number of threads available to process incoming requests.
Why are the ATs creating a huge number of threads?
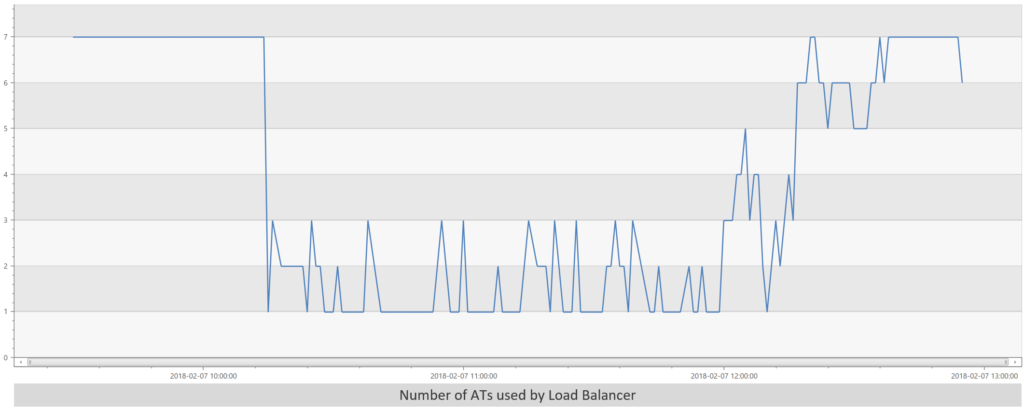
This is the key question that took us a while to answer. We have 7 ATs that were handling the load fine before the event. Since the event wasn’t persistent, why can’t they handle the load after the event went away? Let’s ask a basic question: Do we really have 7 ATs? We know that the VssHealthAgent has one pulled out of rotation for the length of the incident. And while the ATs were running relatively hot before the incident, we should be able to run on 6 ATs here. The key question actually isn’t how many ATs are running, but it’s how many the load balancer has in rotation accepting requests. The load balancer will only send traffic to ATs that are responding correctly to its probes. Let’s graph the number of ATs that the load balancer is actually using:
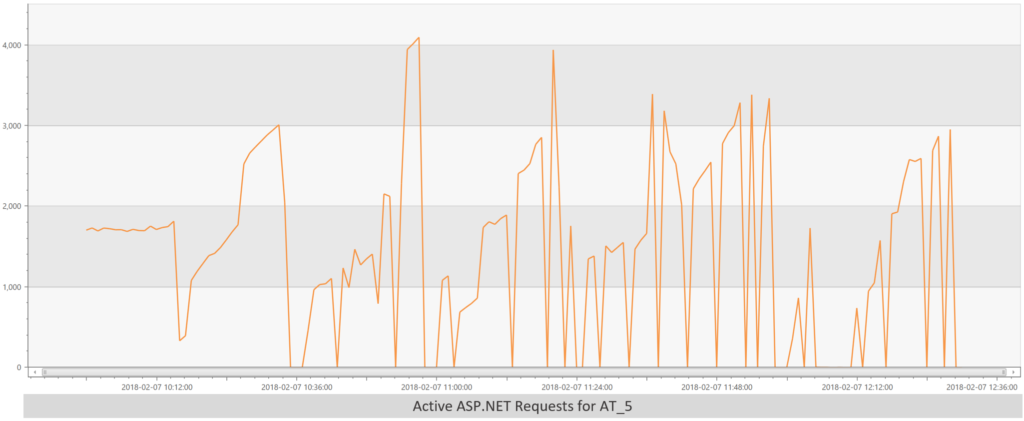
And there’s the smoking gun. Throughout the incident, the load balancer was only successfully probing between 1 and 3 ATs. Here’s a graph of the active ASP.NET requests on a single AT for the length of the incident:
This shows that after spinning up and telling the load balancer it was ready for requests, an AT would get overwhelmed with requests because the load balancer didn’t have enough ATs for fair distribution. The load is far too large for only having up to 3 ATs.
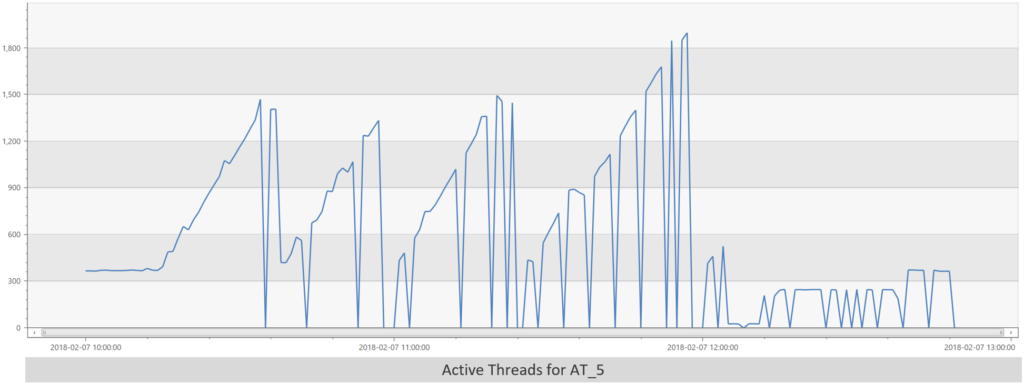
That should be fine though. ASP.NET will queue up requests so that a process doesn’t get overwhelmed and can continue to churn through requests. Remember the thread starvation issue from earlier? Here’s a graph of the active thread count on AT_5.
As soon as an AT spins up, it exhausts the 192 threads available to it and begins thrashing as thread creation is throttled. Furthermore, it won’t crash and recover. It’ll just sit there thrashing. The probes from the load balancer are HTTP requests that go into the same ASP.NET queue. The time to respond will be too long, and the load balancer will stop sending traffic to AT_5. Once it stops taking traffic and catches up, the load balancer probes are once again successful. The cycle for the AT repeats. Each of the ATs repeatedly cycles through this state, leaving this scale unit badly under provisioned.
In conclusion, for those two hours, what we have is a vicious cycle of ATs spinning up and getting instantly overwhelmed and thrashing.
What caused this vicious cycle?
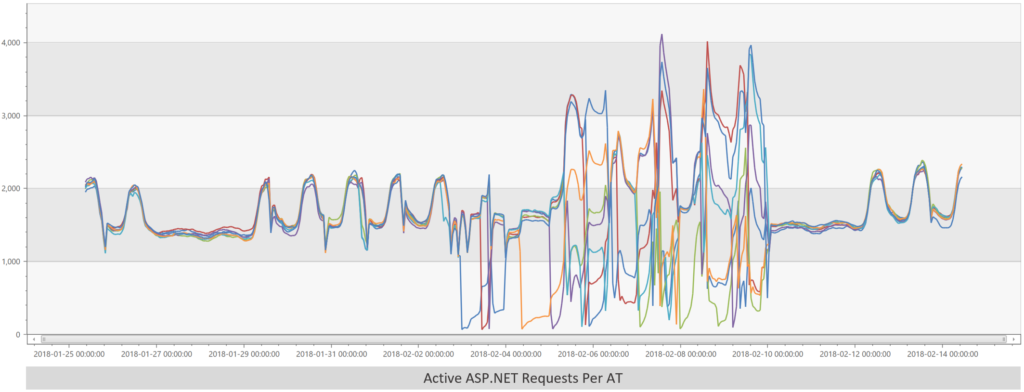
It turns out there was something recently that put much more stress on the system. Here’s a graph of active requests per AT for the past month:
You’ll notice that all of the ATs received load evenly up until 2 February and again after 10 February. What happened between those two dates? We introduced a bug that caused the AT process to intermittently crash. When that happens, the other ATs must pick up the load. With enough headroom in the system, that would have been okay. However, multiple ATs were going down at the same time. That puts the system under more pressure and when the SignalR reconnect spike event occurred, it sent the whole system into a tailspin. Here’s a graph of process crashes leading up to and during the event (across all ATs, bucketed per 5 minutes):
One embarrassing thing here is that we were partially blind to these crashes. We have telemetry set up to detect and alert on process crashes. Unfortunately, that telemetry had a bug in it. It only reported 10 crashes during this period, and all of those were during the incident. If this would have been working properly we could have likely avoided the incident altogether. This issue also ended up hurting this postmortem process significantly. The fact that we weren’t seeing crashes in our telemetry invalidated the theory about what was happening here a few different times. It wasn’t until we double-checked that telemetry, and found that it was wrong, that we were able to tie the whole story together.
In conclusion, a broad generalization of what went wrong is that the system was running too close to the point of exhaustion due to the intermittent crashes, and an event that should not have been a problem caused a high-severity incident.
Mitigation
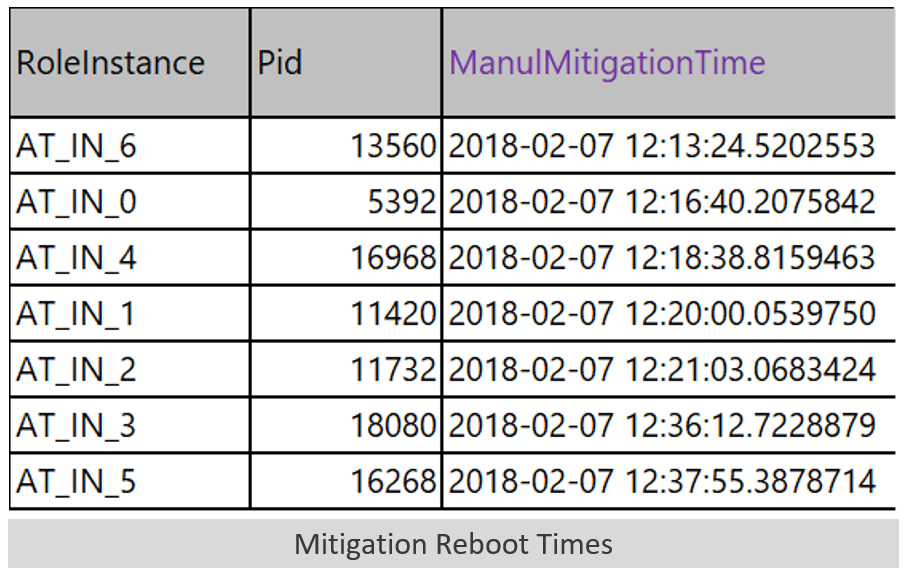
The mitigation that ended up working for this incident started at 12:13. We saw request rates return to normal between 12:18 – 12:21 depending on the AT. During that period, we decided to do a manual process recycle on all of the ATs. Here’s a chart of when we did the reboots:
It turns out that we got lucky in the order that we rebooted the instances. AT_IN_6, AT_IN_0 and AT_IN_4 were in a zombie state at the time we started mitigating. By having those three come up in close succession, along with having some other functional ATs in the mix already, the system stabilized. Here’s the AT load balancer graph again where you can see the ATs recover around 12:20.
Oddly, we unknowingly tempted our own fate by continuing to recycle instances after that point. You can see dips in the number of the ATs in the load balancer after things have recovered as we continued to progress through the full mitigation. Had those been combined with a poorly timed crash or two, we could have restarted the tailspin. This further shows the need to be able to have insight into what ATs the load balancer is routing requests to at real time.
Action Items
Here are the repair items from the last attempt at this root cause analysis:
- We’ve fixed the process crash issue that was one of the causes of ATs being unavailable during this outage.
- We’ve added code to our clients to have them stagger reconnect calls so that an incident that causes connections to be severed isn’t made worse by SignalR sending thousands of reconnect calls simultaneously.
- We’ve decreased the size of the SignalR message cache so that reconnect processing will be less CPU intensive on the ATs.
In addition to those, here are further improvements we plan to make now that we fully understand what happened here:
- We need to figure out what the right setting is for MinWorker threads that we set in our w3wp process. An AT shouldn’t be able to be overwhelmed with requests and it shouldn’t thrash due to thread starvation. We need to optimize the thread count for best performance.
- We need to do the same analysis for MinIO threads.
- We have perf counters for Worker threads. We need to add one for IO threads to be able to detect if we ever have a similar problem there.
- We need to set MaxRequest threads to an amount lower than our MinWorker threads can handle.
- During an incident we need to have a view in a dashboard of the number of ATs the load balancer thinks it can access. If we would have had insight into this early on but the mitigation and postmortem would have happened much faster.
- Along with #5 we should consider if it’s feasible to auto-mitigate the situation where the load balancer doesn’t think it has enough ATs by automatically adding more.
- We need to fix our telemetry pipeline to accurately capture all AT process crashes and test it.
- We need a monitor to measure when a process is thrashing in cases similar to this.
- If we can reliably achieve #8 we should implement an auto-mitigation as part of the VssHealthAgent for recycling the process since it is unlikely to recover on its own. This would need to come with adequate safe guards to prevent this from getting in too tight of a cycle where it could make a bad situation worse.
We apologize for the impact this had on our users. This incident has highlighted areas of improvements needed in our telemetry, detection and auto-mitigation capabilities. We are committed to delivering the improvements needed to avoid related issues in the future.
Sincerely, Taylor Lafrinere Group Engineering Manager, VSTS Continuous Integration







0 comments