
Edit February 26, 2018: We have just posted an updated and complete postmortem here: https://devblogs.microsoft.com/devopsservice/?p=16295
Customer Impact
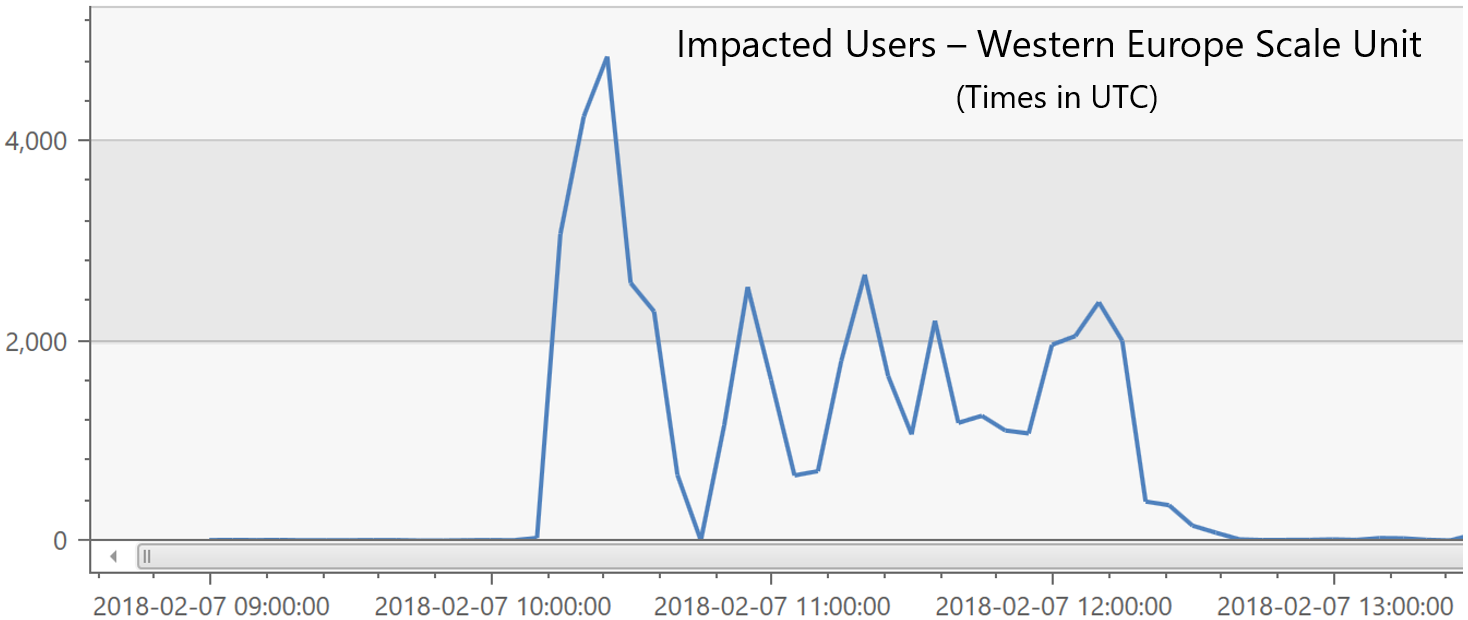
On 7 February 2018 we had an incident which impacted users in our Western European scale unit. During this time, users experienced slow performance and 503 errors (service unavailable) when interacting with VSTS services. Close to 5,000 users were impacted at the peak of the incident. The incident lasted for two and a half hours on 7 February 2018 from 10:10 – 12:40 UTC.
What Happened
Our root cause analysis (RCA) has not gone well for this incident. We’ve had several theories that have taken up significant time but ultimately have proven to be false. The result is that we don’t yet have a complete RCA on this incident. We are posting this update to share what we do know and what prevention steps we’ve put in place thus far, but, also to communicate that we are still actively investigating this issue.
Ultimately, we’re trying to answer these two questions:
- What caused the initial failure?
- Why didn’t the system automatically recover given the reactive measures we already have in place?
First, here is what we do know. This scale unit has 7 application tiers. This graph shows the sum of CPU usage (red) across those instances as well as the request queue length (orange) which is a good proxy for impact in this case:
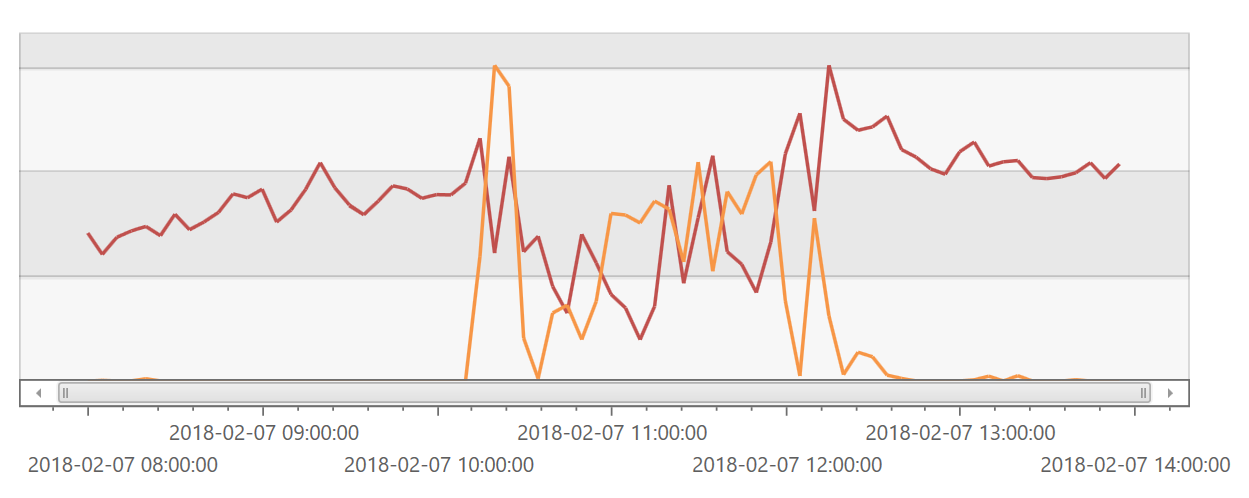
The odd thing here is that CPU usage falls for most of this incident. When the incident resolves, the CPU usage rises to a higher level. That is generally the opposite of what we expect. The key here though is that this is the sum of the CPU usage across all 7 ATs. When we look at each of the individual ATs, we see that over the course of the incident that often a number of them are not processing requests at all. This puts extra burden on the remaining ATs, ultimately causing them to become overwhelmed and to fail. We believe this is happening for two reasons:
- We identified a bug in our application host shutdown logic that can cause an unhandled exception on a background thread to bring the entire process down. We saw 7 occurrences of this crash during the outage window.
- We have a tool known as the VssHealthAgent that will take automatic actions to help us diagnose an issue. For instance, if it notices that CPU or queued requests have spiked, it will pull the AT out of the load balancer, collect a set of diagnostics, and then place the AT back in rotation. This tool has throttling built in to ensure that it won’t pull more than one AT out of rotation at any given time. We noticed several oddities during this period:
- A few times, the time taken to collect diagnostics on a given AT took much longer than expected. Throughout this entire period, we were without 1 AT due to the VssHealthAgent collecting diagnostics. Even with that, we should have had enough ATs to handle the load with one of them taken out of rotation.
- During the outage, we found that at different points in time, a given AT was not in contact with the load balancer to let it know that it was available for work. This caused the number of functioning ATs to drop below the number required to support the load.
While we are beginning to understand why this outage lasted as long as it did, the question of what caused it still remains.
VSTS makes heavy use of SignalR to provide live updating web views. When a SignalR connection is severed, or it fails to receive a ping for 30 seconds, it will attempt to reconnect with the server. We noticed that two of the bigger spikes in impact correlate with large reconnect spikes (in blue):
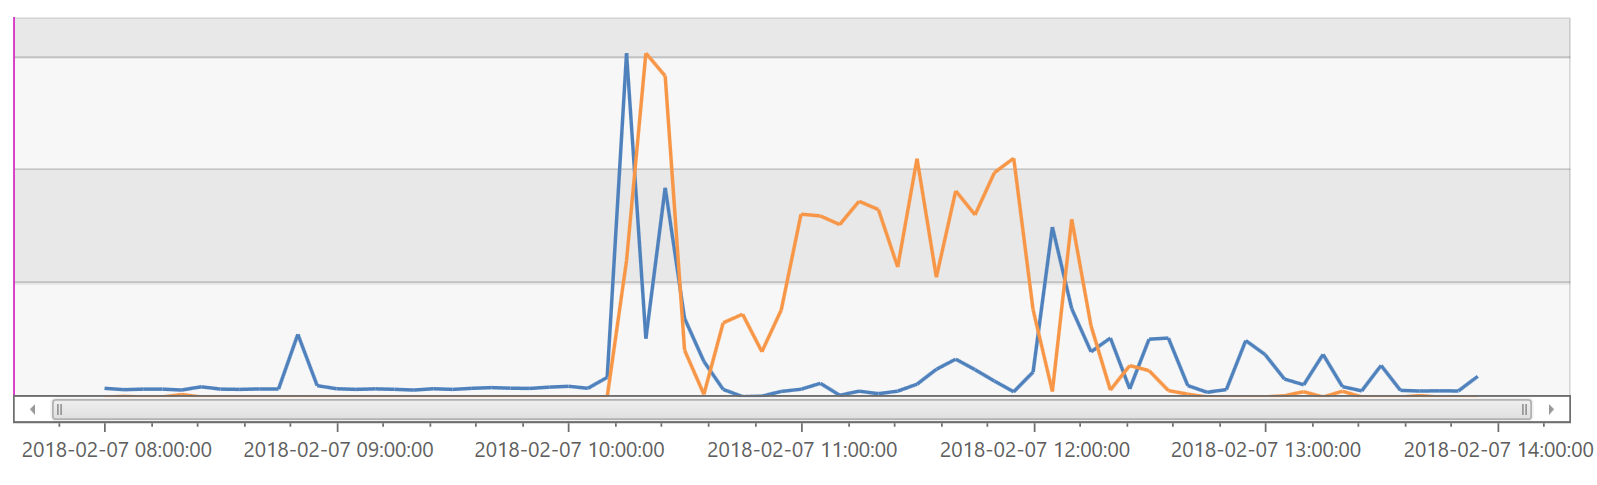
Note that the graphs here have different y-axis values. We know that the spike in reconnect calls here has a negative impact on the server. It is still unclear what caused those reconnects to happen and if they were the cause of the queued requests on the ATs or instead a victim of things getting slower.
We’ve taken several steps so far to prevent these conditions from recurring:
- We’ve fixed the process crash issue that was one of the causes of ATs being unavailable during this outage.
- We’ve added code to our clients to have them stagger reconnect calls so that an incident that causes connections to be severed isn’t made worse by SignalR sending thousands of reconnect calls simultaneously.
- We’ve decreased the size of the SignalR message cache so that reconnect processing will be less CPU intensive on the ATs.
There are still a number of things that we need to investigate:
- We need to understand what is causing the spike of the queued requests. We’ve noticed an increase in load directly before this event, but it isn’t enough that clearly makes it the cause. We need to investigate further in order to understand the make-up of that load by analyzing call telemetry and perf view traces.
- We need to understand what triggered the SignalR reconnects to start. This is something that we’ll likely need to add additional telemetry to capture.
- At the very beginning of this incident, the CPUs on most of the ATs spiked and then nearly all of them went to being underutilized. We need to understand what caused that coordinated drop in CPU usage across many ATs.
- We need to understand why functional ATs were not being given work by the load balancer.
Once we understand those variables, we’ll be able to comment on further steps we’ll take to ensure this doesn’t happen again, and we’ll update this RCA write up.
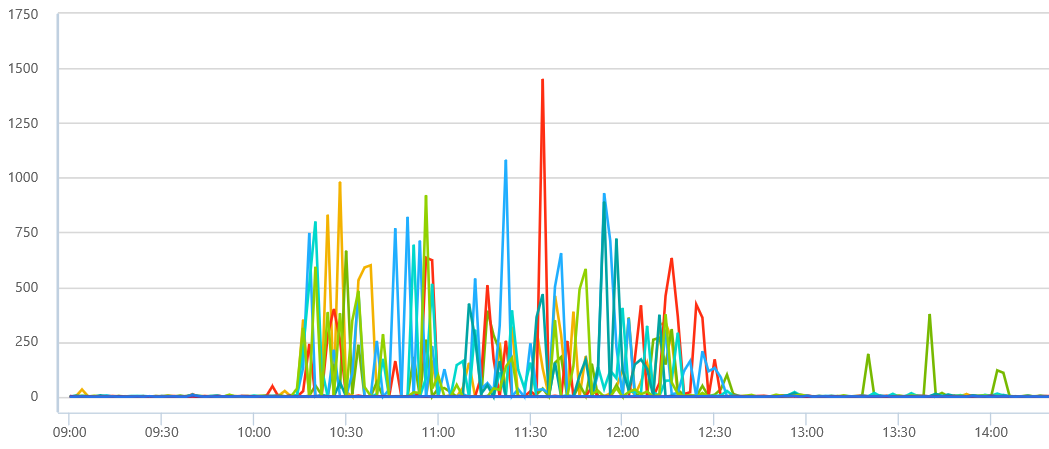
Summary of RCA investigation and mitigation steps: The delay in mitigating the issue was primarily due to mistakes made in diagnosing the root cause, and also a reliance on human judgment in interpreting telemetry signals. The eventual fix was to recycle the web servers which were experiencing high CPU utilization. Our implementation of the mitigation steps was delayed by incorrectly focusing on a possible network issue due to slow service to service calls. The specific telemetry signals which led us to suspect a networking issue were delays of more than 5 seconds for calls between Team Foundation Service (TFS) and the Shared Platform Service (SPS) for user authentication and authorization as shown in the chart below.
We eventually determined that the delay in service-to-service calls was not due to network delays. At 12:00 UTC (2 hours after the start of the incident) we redirected our RCA investigation to focus on the high CPU utilization and thread contention on our web servers. At this point, we recycled the web servers, and the issue was mitigated a half hour later.
Next Steps:
- Complete this RCA and update this post.
- Make improvements to internal telemetry to remove conflicting data points and enable drill downs
- Investigate opportunities for automated mitigation for cases where root cause is clearly identified through the telemetry
Sincerely, Taylor Lafrinere Group Engineering Manager, VSTS Continuous Integration
0 comments