
We are excited to announce an easy-to-use solution for integrating Power BI with VSTS Analytics. You don’t have to know how to write OData queries anymore! Our new feature Analytics views makes getting VSTS work tracking data into Power BI simple, and it works for the largest accounts. Similar to a work items query, an Analytics View specifies filters that scope the result of work items data and the columns. Additionally, views allow you to report on past revisions of work items and easily create trend reports.
We provide a set of Default Analytics views that work well for customers with smaller accounts and basic scenarios. Larger accounts might need to scope down the data they are pulling into Power BI. Analytics views let you do just that. Scope your data and history to exactly what you want to report on in Power BI. Analytics views you create in the Analytics hub in VSTS are immediately available to select from the VSTS Power BI Data Connector.
How do I create my own view?
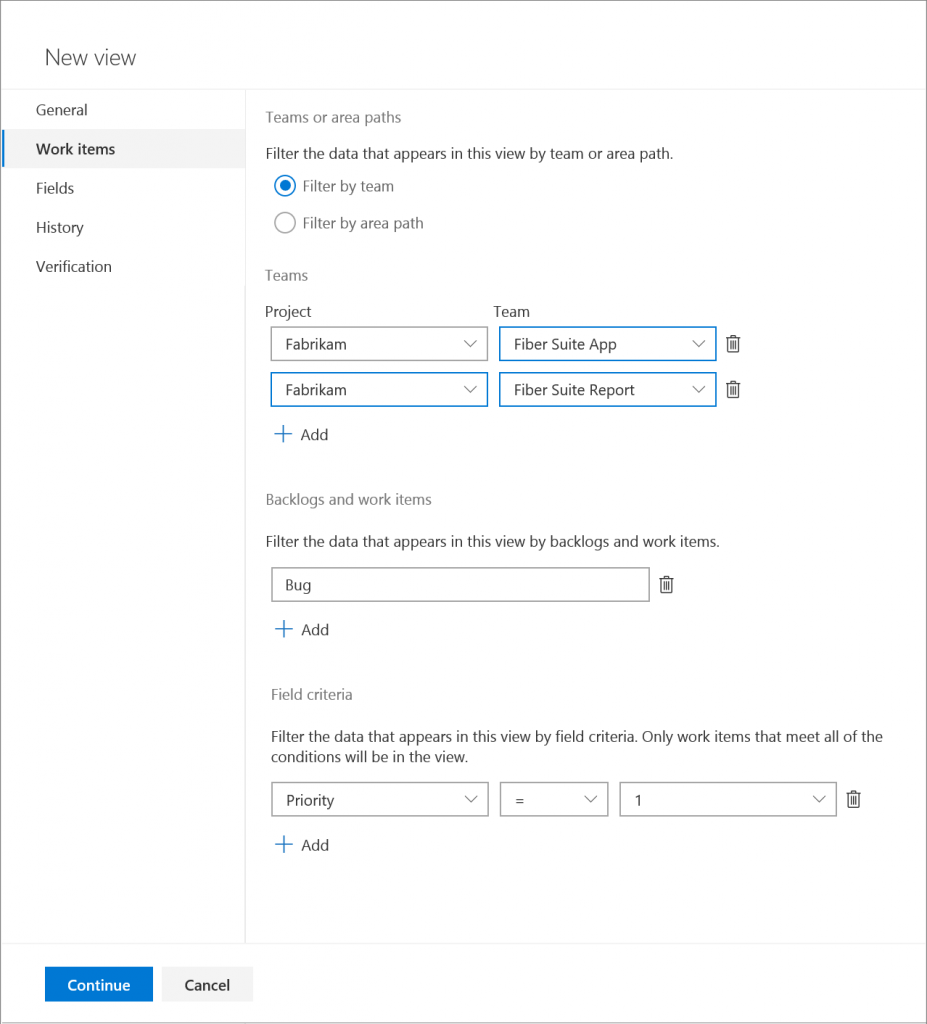
Creating a view is easy. Name is the only thing mandatory. You can add as many filters as needed. A View can be scoped to one or more teams and Area paths. You can also have a view that includes data from multiple team projects. For example, the following images shows a view configuration for high priority bugs across two teams
When creating a new view in VSTS, you can control the following aspects :
Name and sharing options
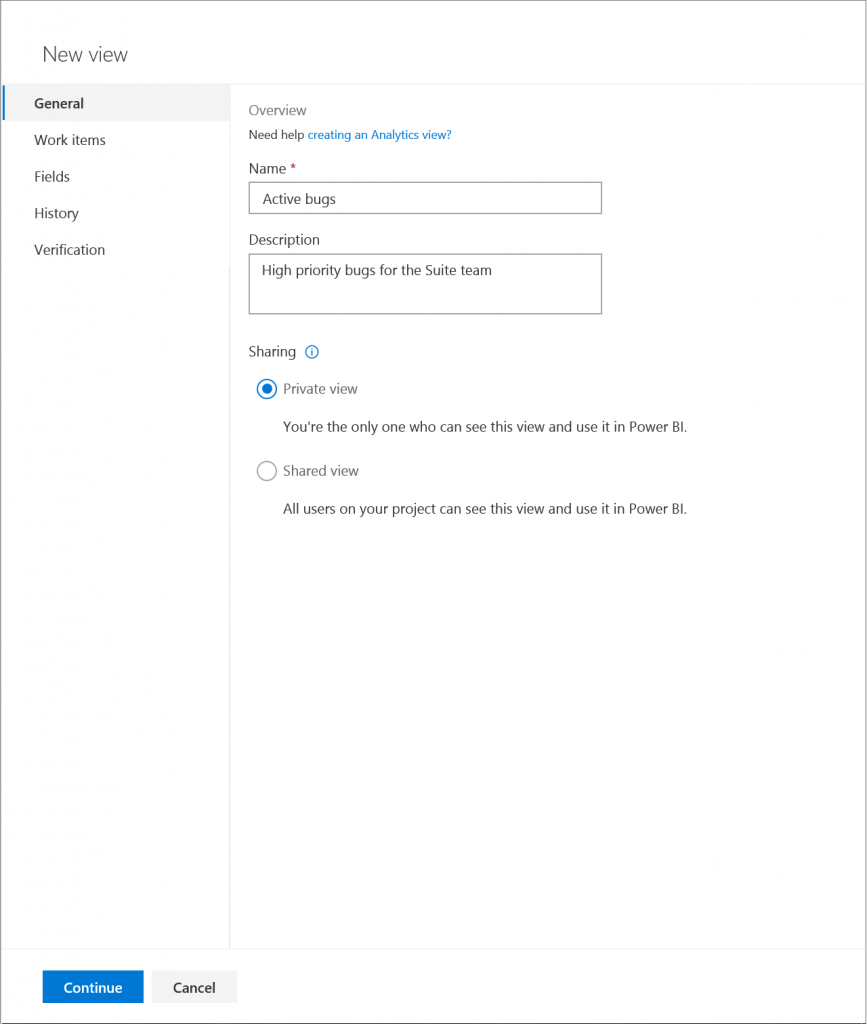
Filtering options
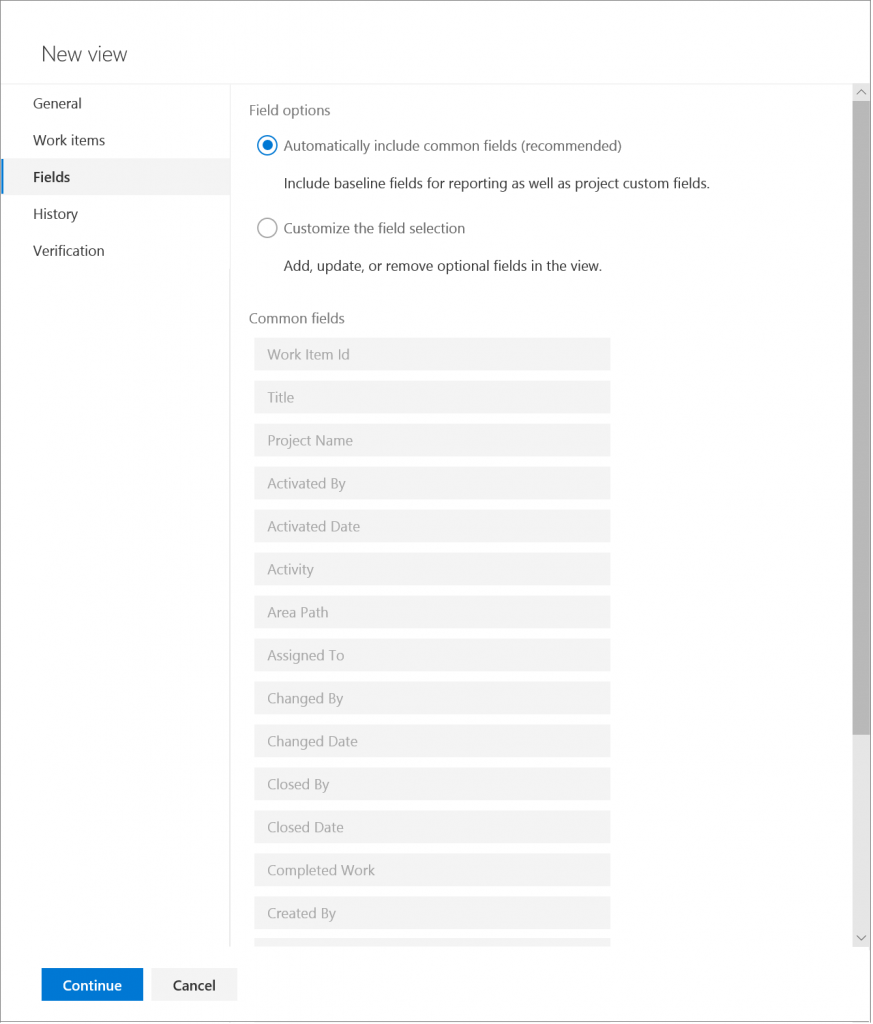
Views columns
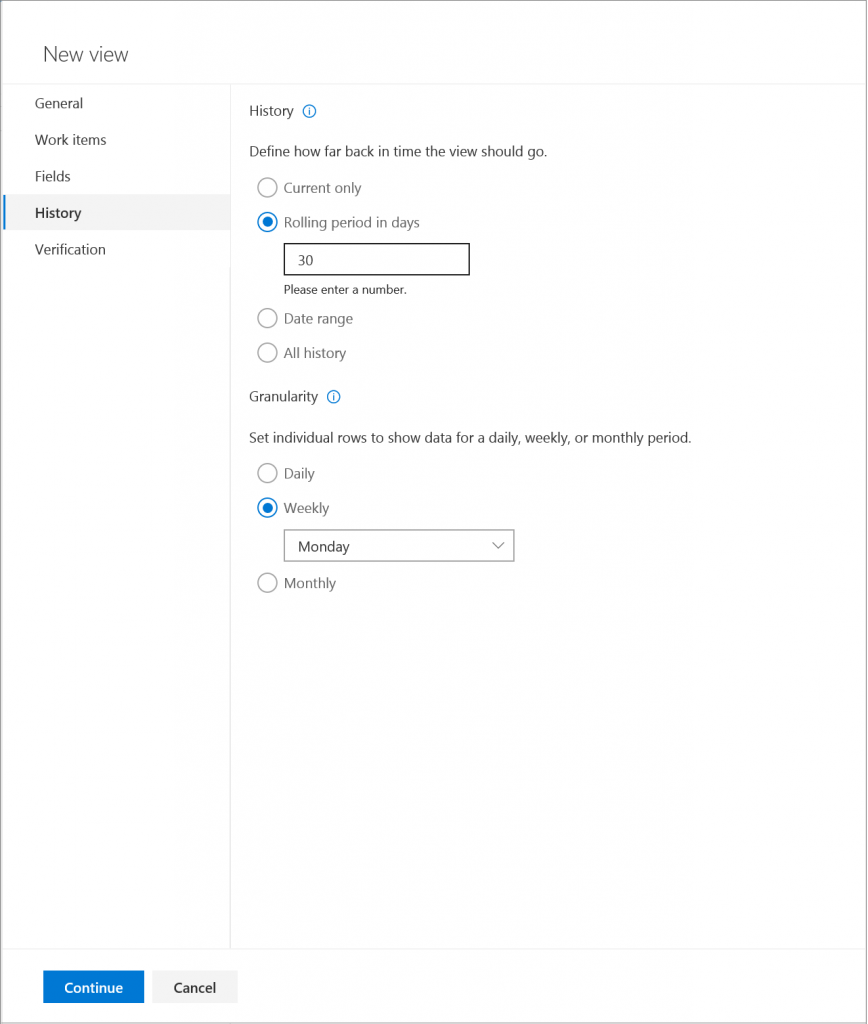
Time period and granularity
Test your view in get performance estimations
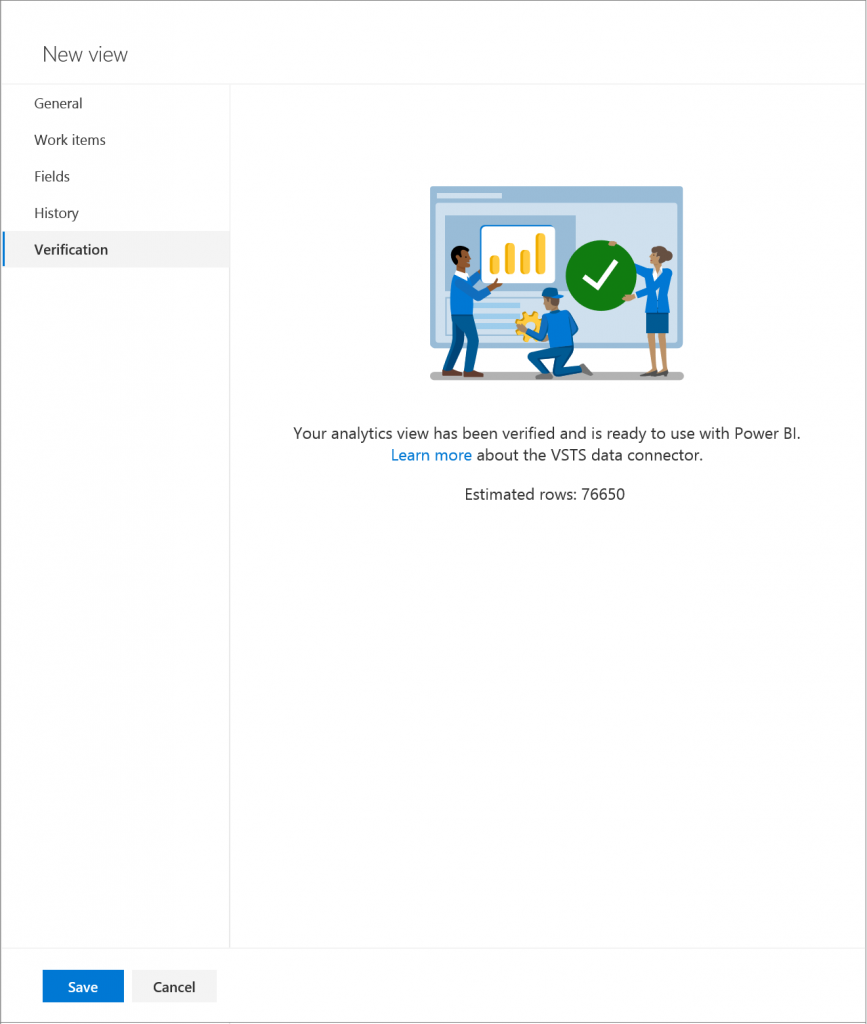
To Learn more about the different configuration options see Create an Analytics view .
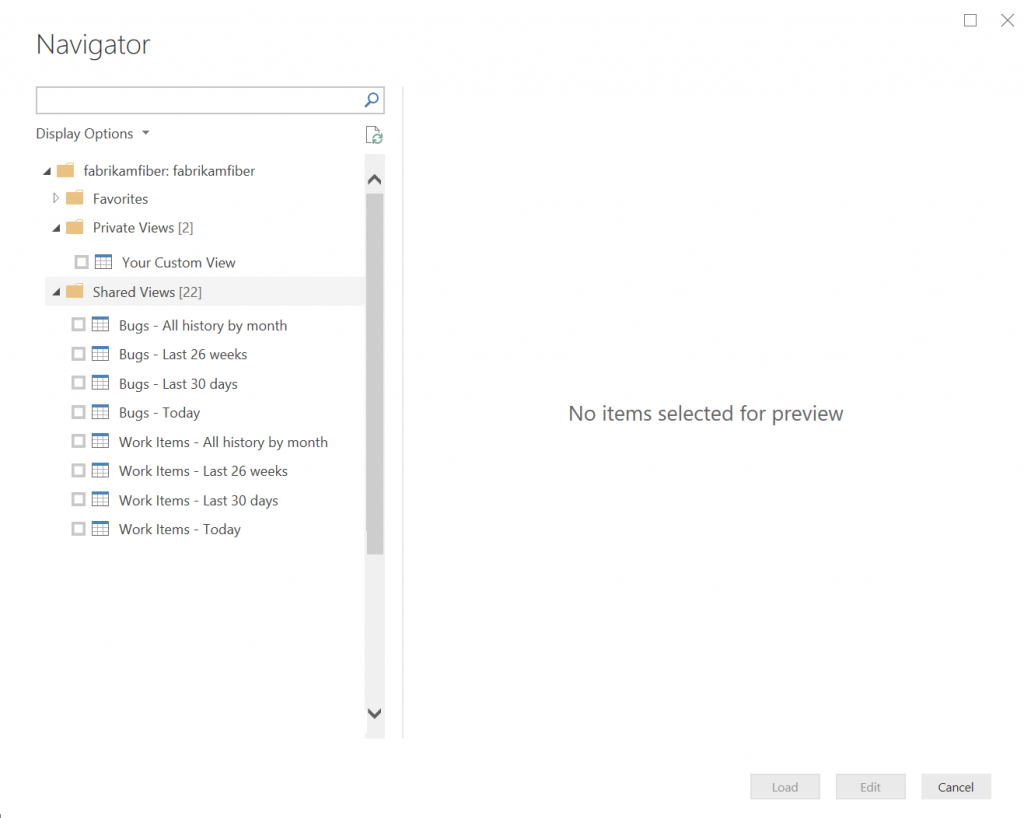
How to use views in Power BI ?
Once views are created, you can open them in Power BI desktop. Use the VSTS Power BI Data Connector to select your view and start creating reports!
Need help getting started? Try creating a daily bugs report based on a new analytics view.
Have questions or feedback?
Feel free to post questions or feedback below and be on the lookout for these changes coming to your VSTS account over the next couple of weeks!
0 comments