By using Azure Monitor, Azure Log Analytics and Application Insights, Azure cloud teams have access to a collection of end-to-end monitoring solutions, directly from the Azure Portal, allowing for Azure Services monitoring, as well as hybrid.
Monitoring involves reading out a combination of: – metrics, for example CPU and Memory load on a Virtual Machine, number of HTTPS connections to an Azure App Service,…) – logs, for example log files from an Apache VM, Linux Syslogs, Cosmos DB logs on a Storage Account,…) – traces, which typically provides insights using a correlation as well as time series on both metrics and logs; for example, show the disk storage increase over the last 6 months; or identify the top 10 visitor countries to your e-commerce web application
While the Azure Portal allows for creating custom dashboards based on a multitude of different graphs, pie charts, line charts and more – even custom Markdown formatted text can be added – customers are often relying on third party solutions for even more compelling diagrams and customized dashboards. One such tool is Grafana.
This article takes you from the initial Grafana installation to how to integrate the aforementioned Azure monitoring services and build out powerful dashboards.
Prerequisites
- An Azure Subscription (go here to create a Free Azure Subscription)
- Some sample deployed resources to monitor (for example Virtual Machine, Storage, App Service, Database Service, Azure Kubernetes Service,…)
Installing Grafana
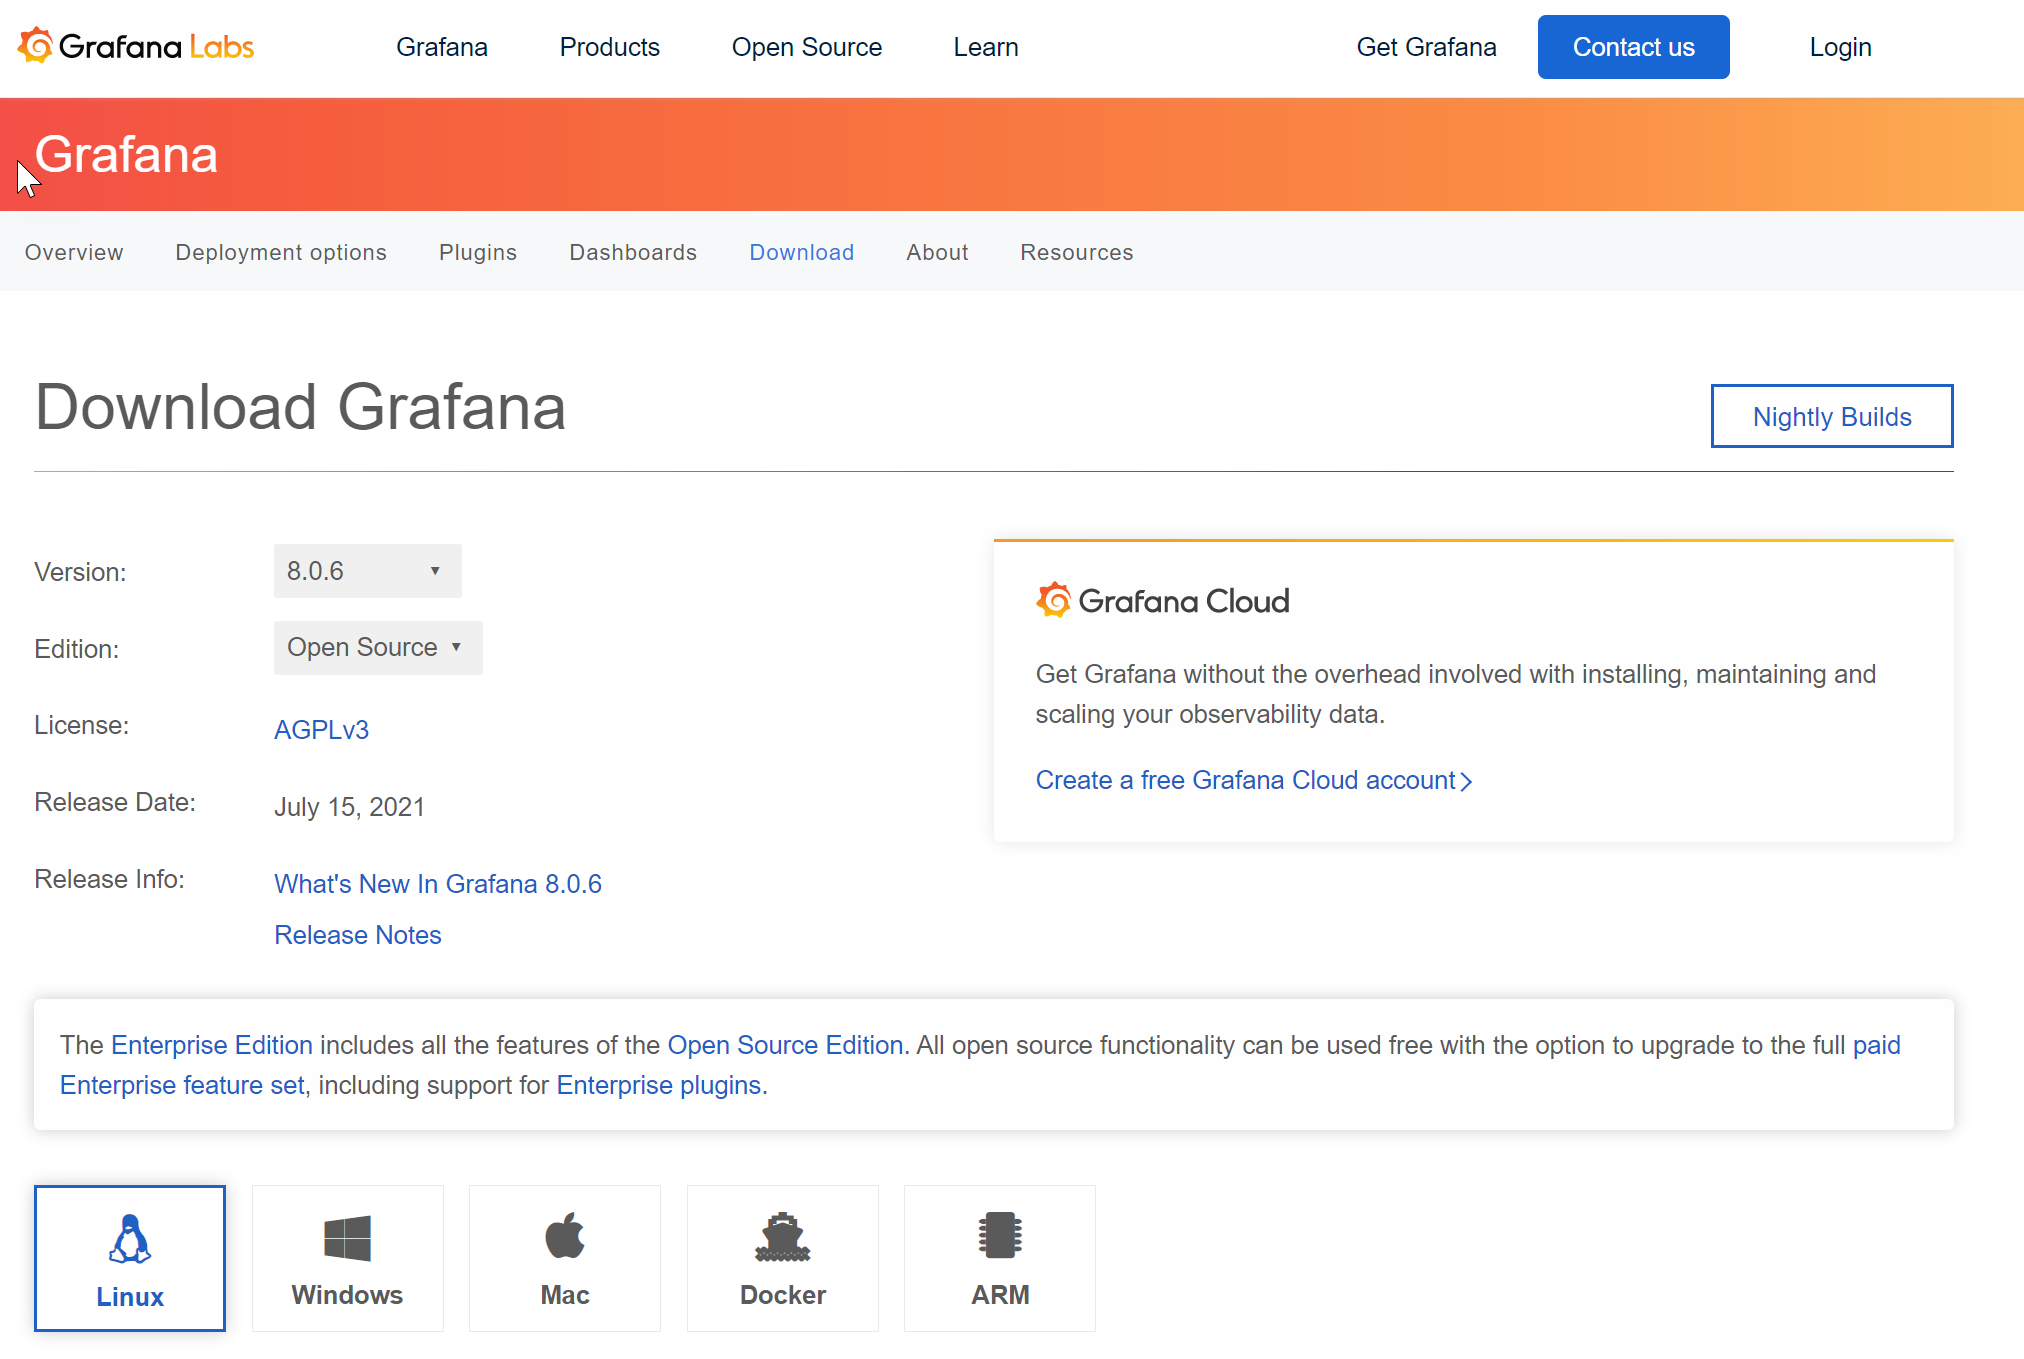
Grafana can be installed in several flavors, as a full application on a Windows Server or Linux Server, an application on MacOS or as a Docker Container. The benefit is you manage all configuration yourself. Click this URL to find out more.
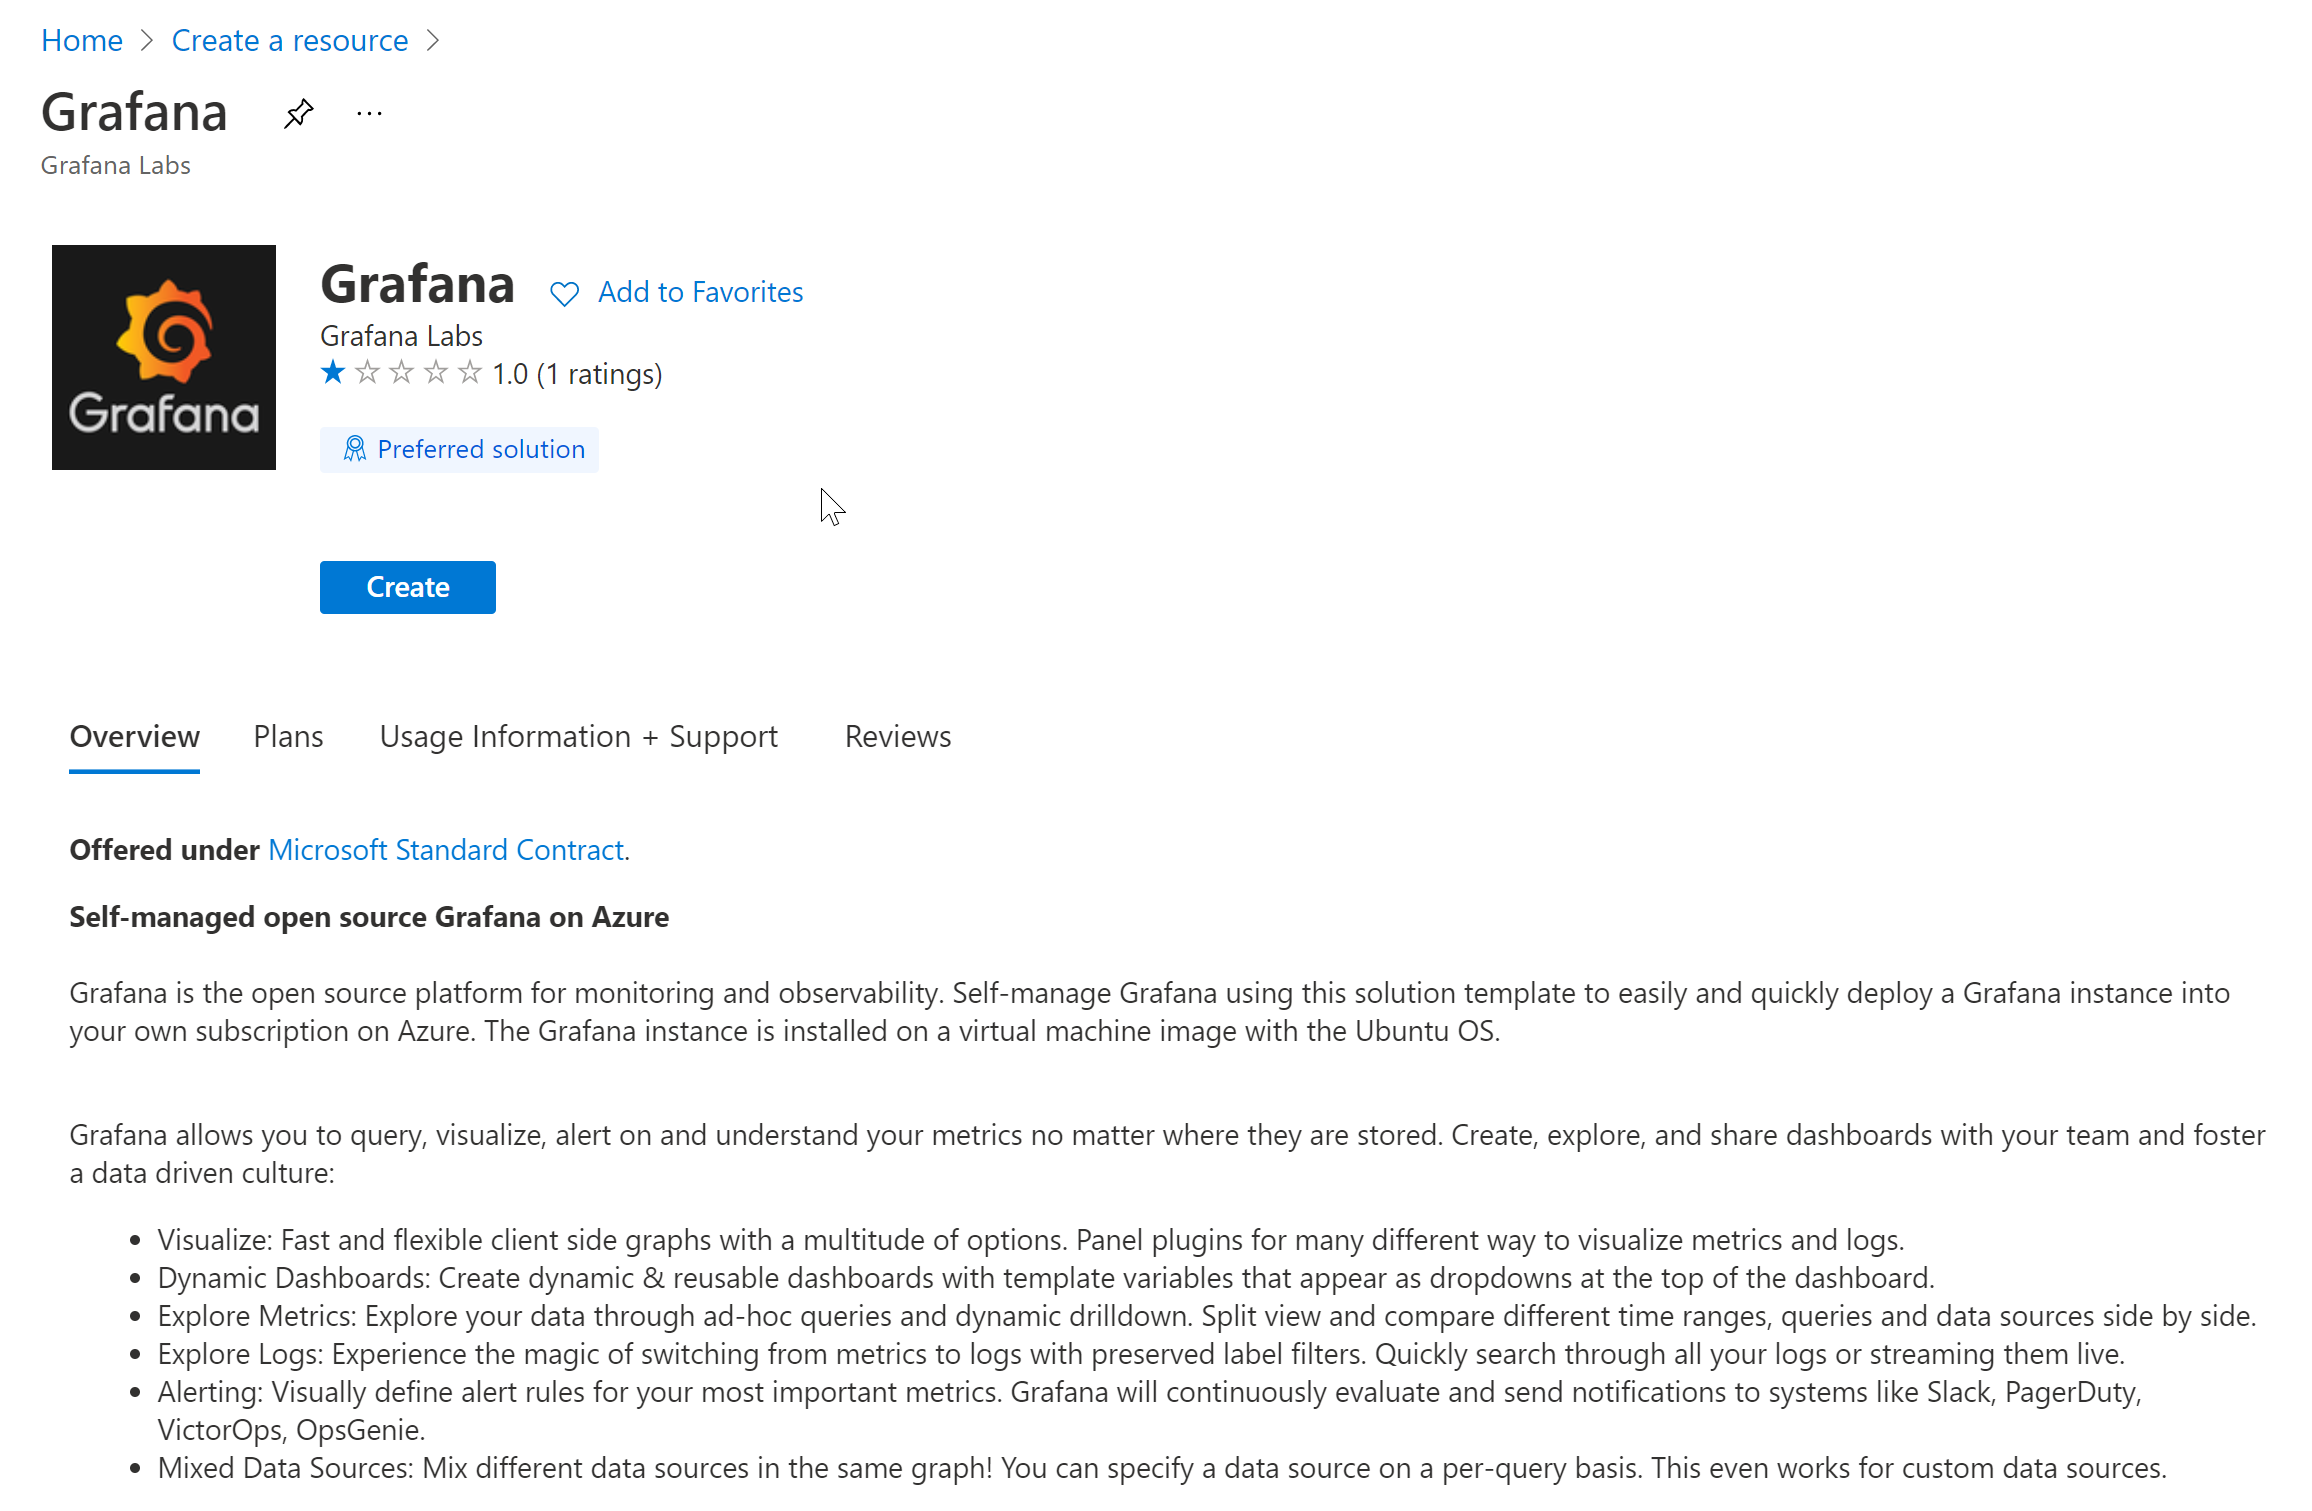
One could also go for an Azure Marketplace VM image, which builds a fully-workable Grafana VM setup in just a few minutes.
A last option is Grafana Cloud ,a cloud-SaaS platform, offering you immediate access to a complete Grafana setup, hosted in the cloud. You just need to provide a Google, GitHub or Microsoft Account (or create a specific Grafana local account) and done. This offers a 14-day free trial.
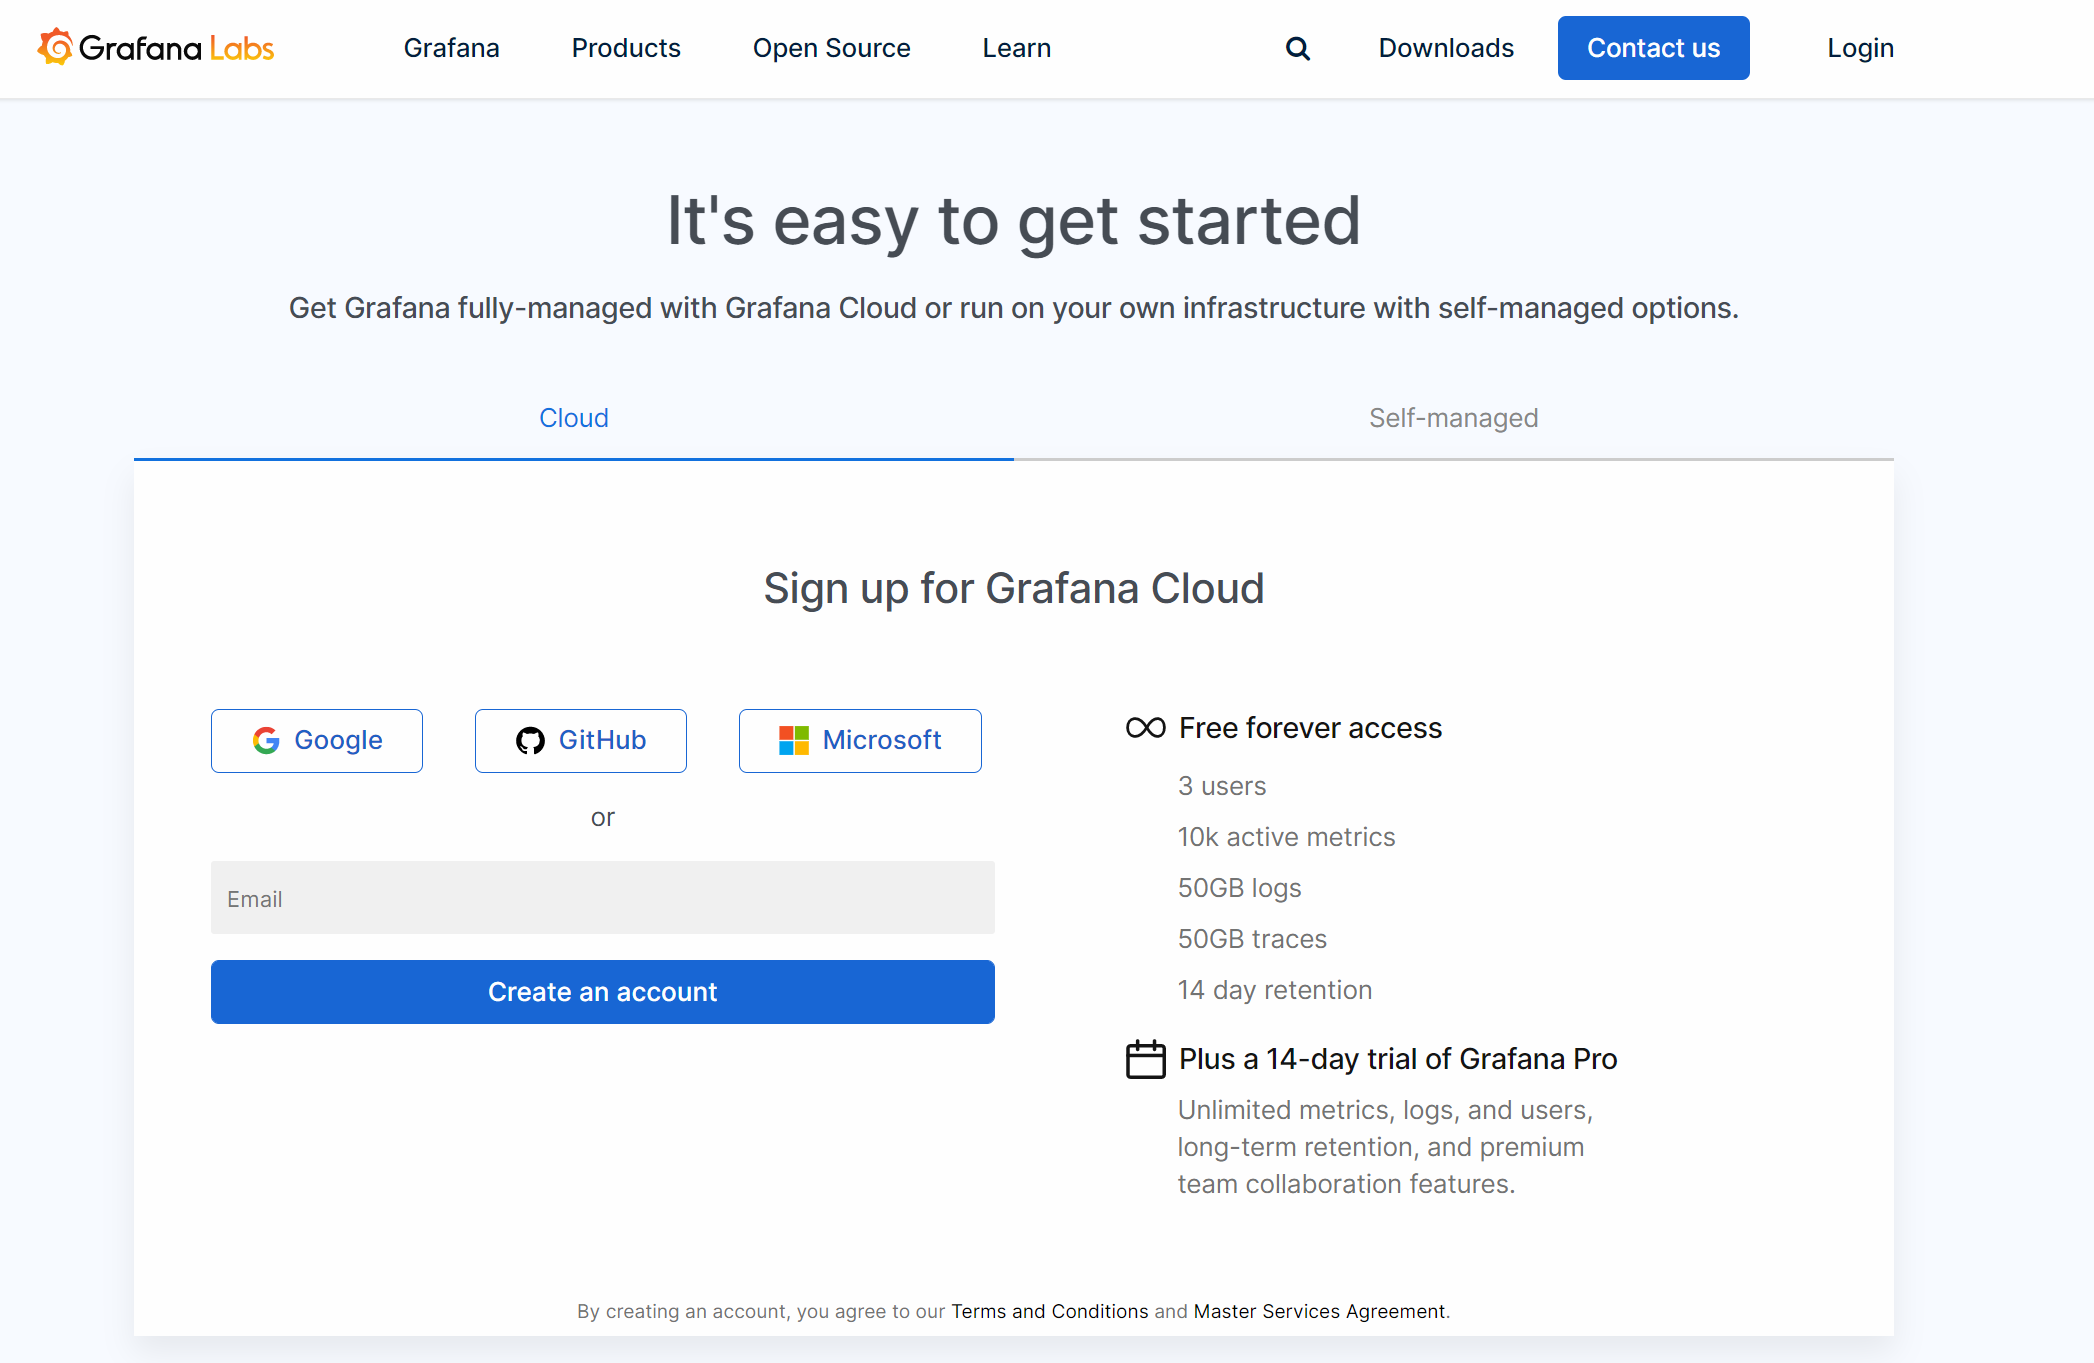
For this article, I used the Grafana Cloud flavor, using a GitHub account.
-
Once authenticated, you need to Name your Stack, which refers to a unique URL for your Grafana environment.
-
Next, your cloud service is getting deployed; which takes about a minute.
-
Last, you are presented with the starting dashboard, from where you can select the different services Grafana integrates with.
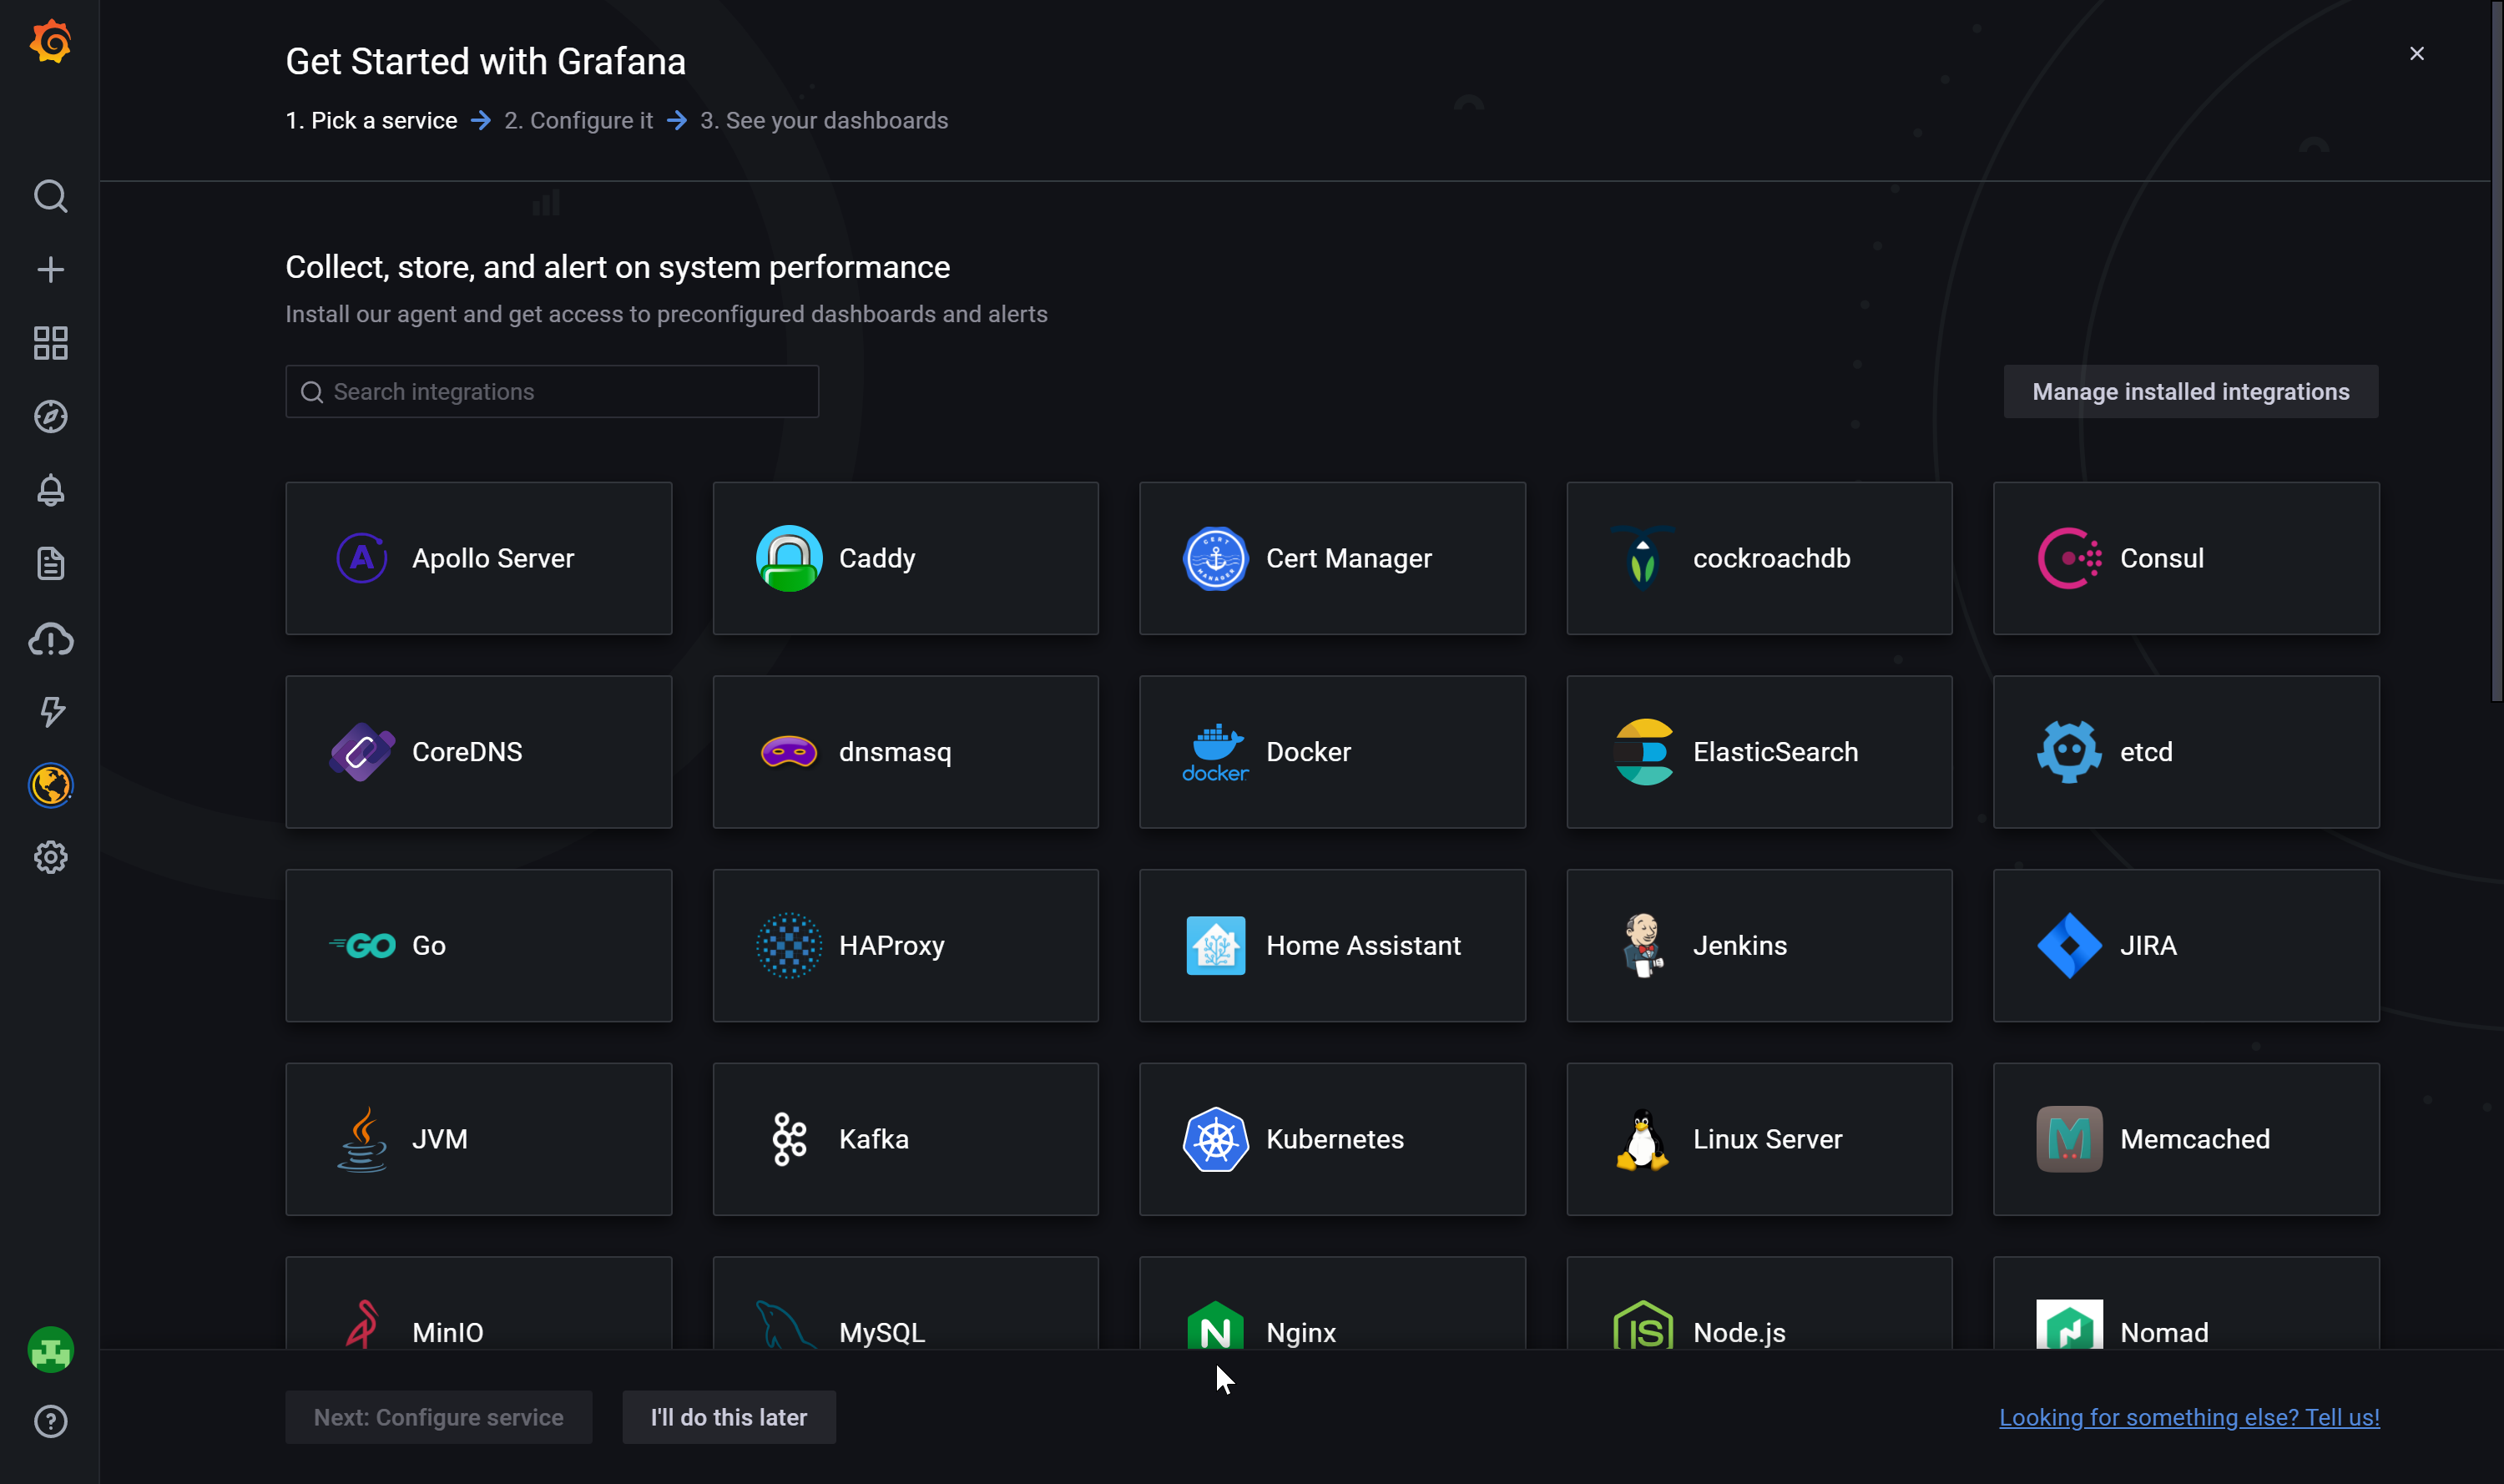
- From this screen, scroll down to the *Visualize existing data” section, and notice Azure Monitor

Connecting Grafana with Azure Monitor
- Select Azure Monitor from the list of available integration services, and click the Next:Configure Service button

-
Next, go to Configuration / Data Sources and Select Azure Monitor
-
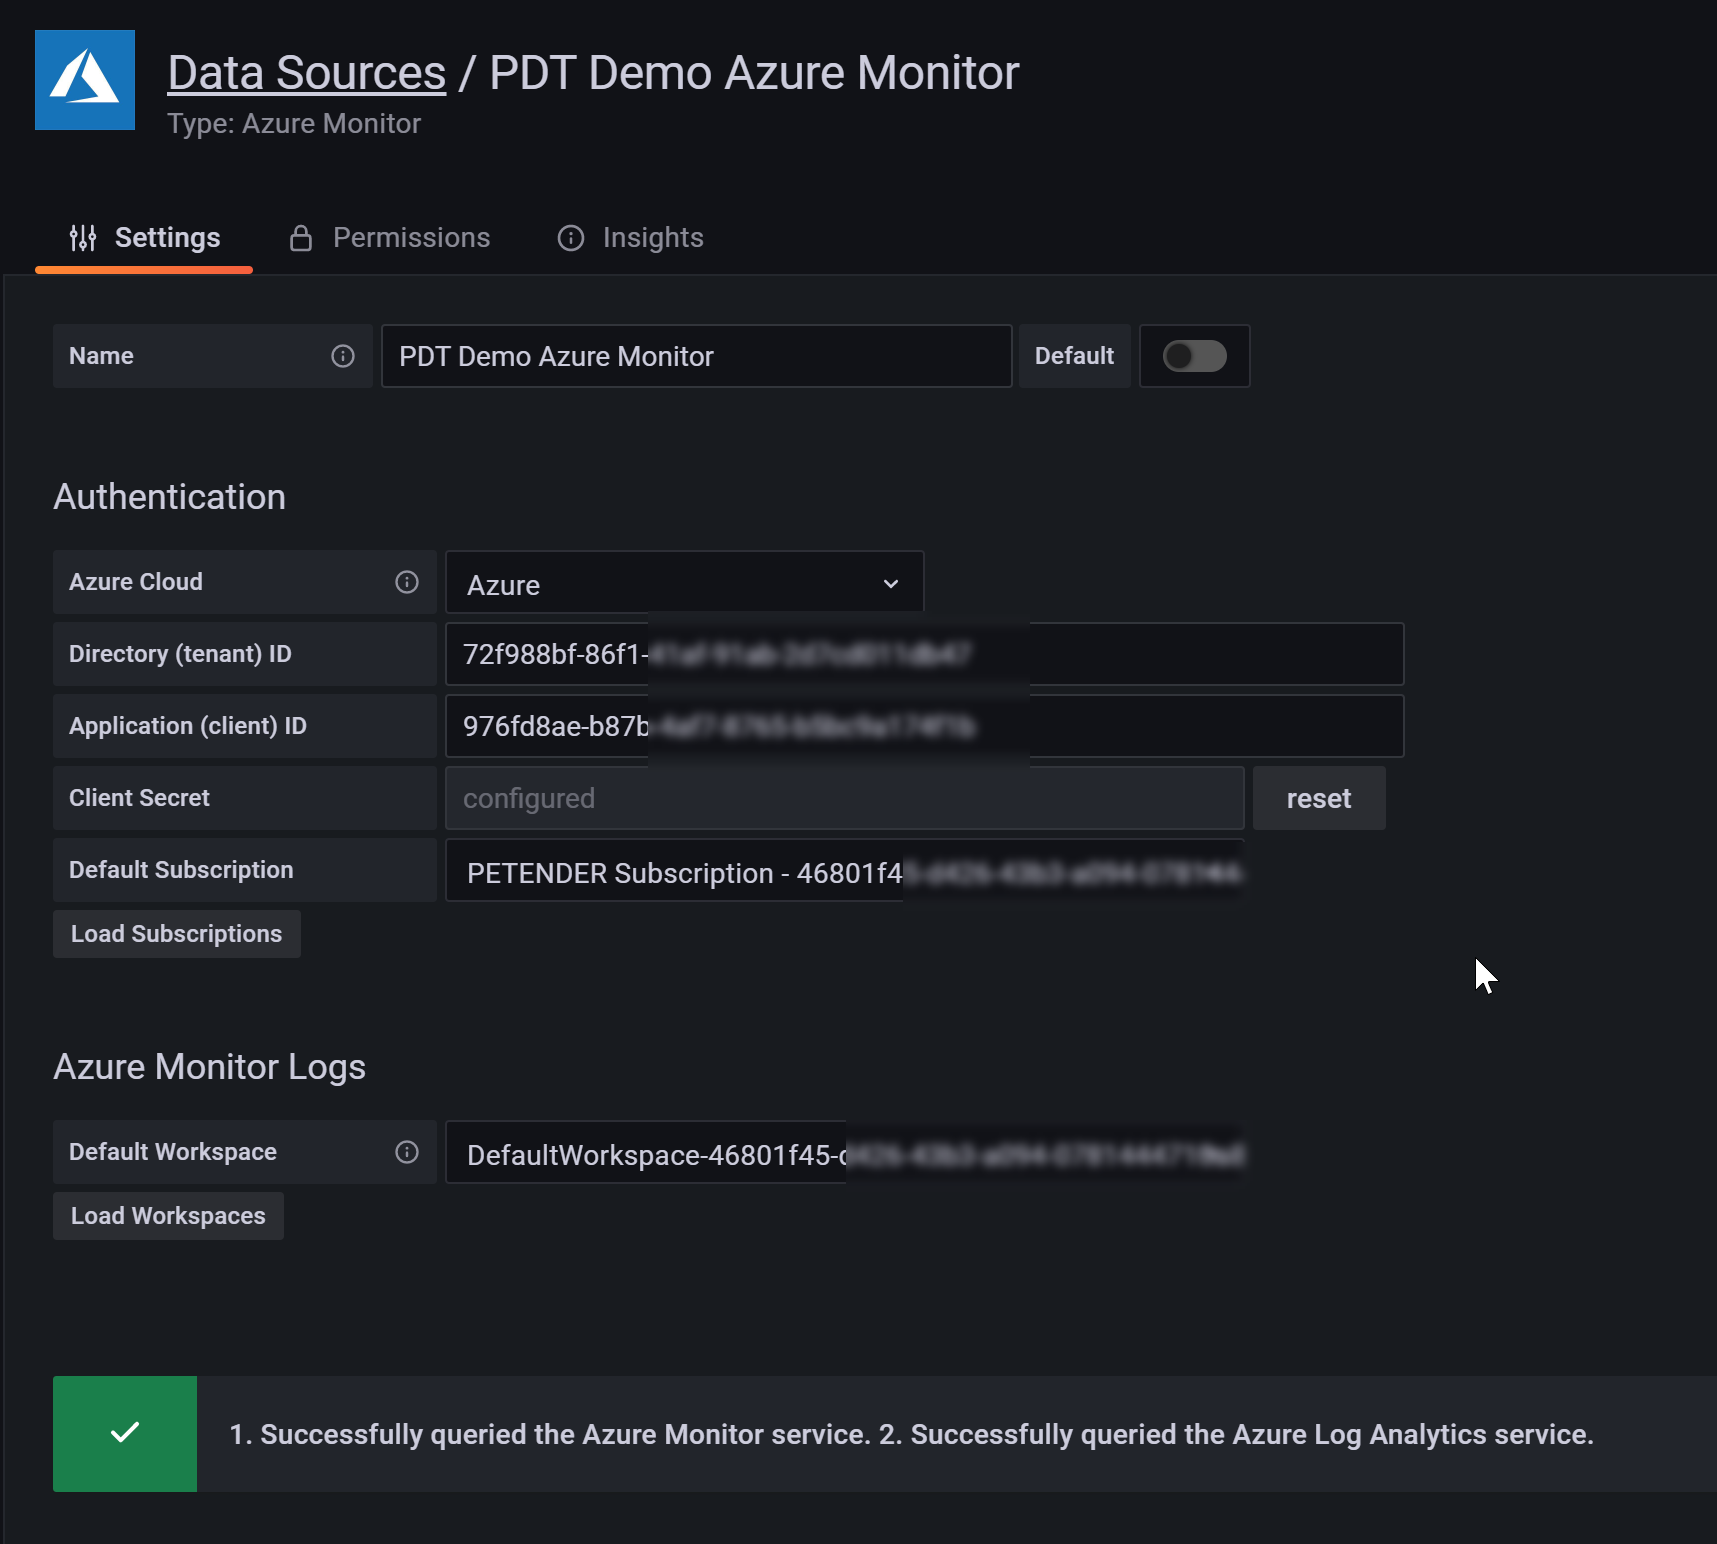
You are prompted for Authentication settings, which requires a Service Principal; READ permissions on Tenant or Subscription level should be enough (For more information on Service Principals, I can recommend these docs:
- I’m a big fan of Azure CLI to execute Azure admin tasks, so using this as an example on how to create the Service Principal in my subscription:
From Azure CLI (Cloud Shell or local runtime), execute the following command:
az ad sp create-for-rbac --name GrafanaDemo --role "Reader"
This produces the necessary output on screen that you need to copy/paste into the settings form on the Grafana side:
Creating 'Reader' role assignment under scope '/subscriptions/46801f45-d426-43b3-a094-0781444710a8'
The output includes credentials that you must protect. Be sure that you do not include these credentials in your code or check the credentials into your source control. For more information, see [Az AD SP CLI](https://aka.ms/azadsp-cli?WT.mc_id=devops-23282-petender)
'name' property in the output is deprecated and will be removed in the future. Use 'appId' instead.
{
  "appId": "976fd8ae-XXXX-XXXX-XXXX-XXXXXXXXXXXX",
  "displayName": "PDTGrafanademo",
  "name": "976fd8ae-XXXX-XXXX-XXXX-XXXXXXXXXXXX"",
  "password": "XXXXXXXXXXXXXXXXXXXXXXXXXXXXXXXXX",
  "tenant": "72f988bf-XXXX-XXXX-XXXX-XXXXXXXXXXXX"
}
peter@Azure:~$
peter@Azure:~$
- use the Load Subscriptions button to pull up your default subscription, as well as Azure Log Analytics Default Workspace.
(if you don’t have a Log Analytics workspace yet, follow the guidelines in this document
Customizing Dashboard views
From here, there is obviously a welth of options available, depending on the Azure Service and Resource Type, the corresponding metrics and the information you want to read out.
I promised you the basic log parameters using metrics, logs and traces, so will guide you through each on how to use them. But feel free to select your own sample resources and go over the different dashboarding options.
Using Metrics
-
From the Granafa Portal, select Dashboards / New Dashboards
-
Select Add an empty panel
-
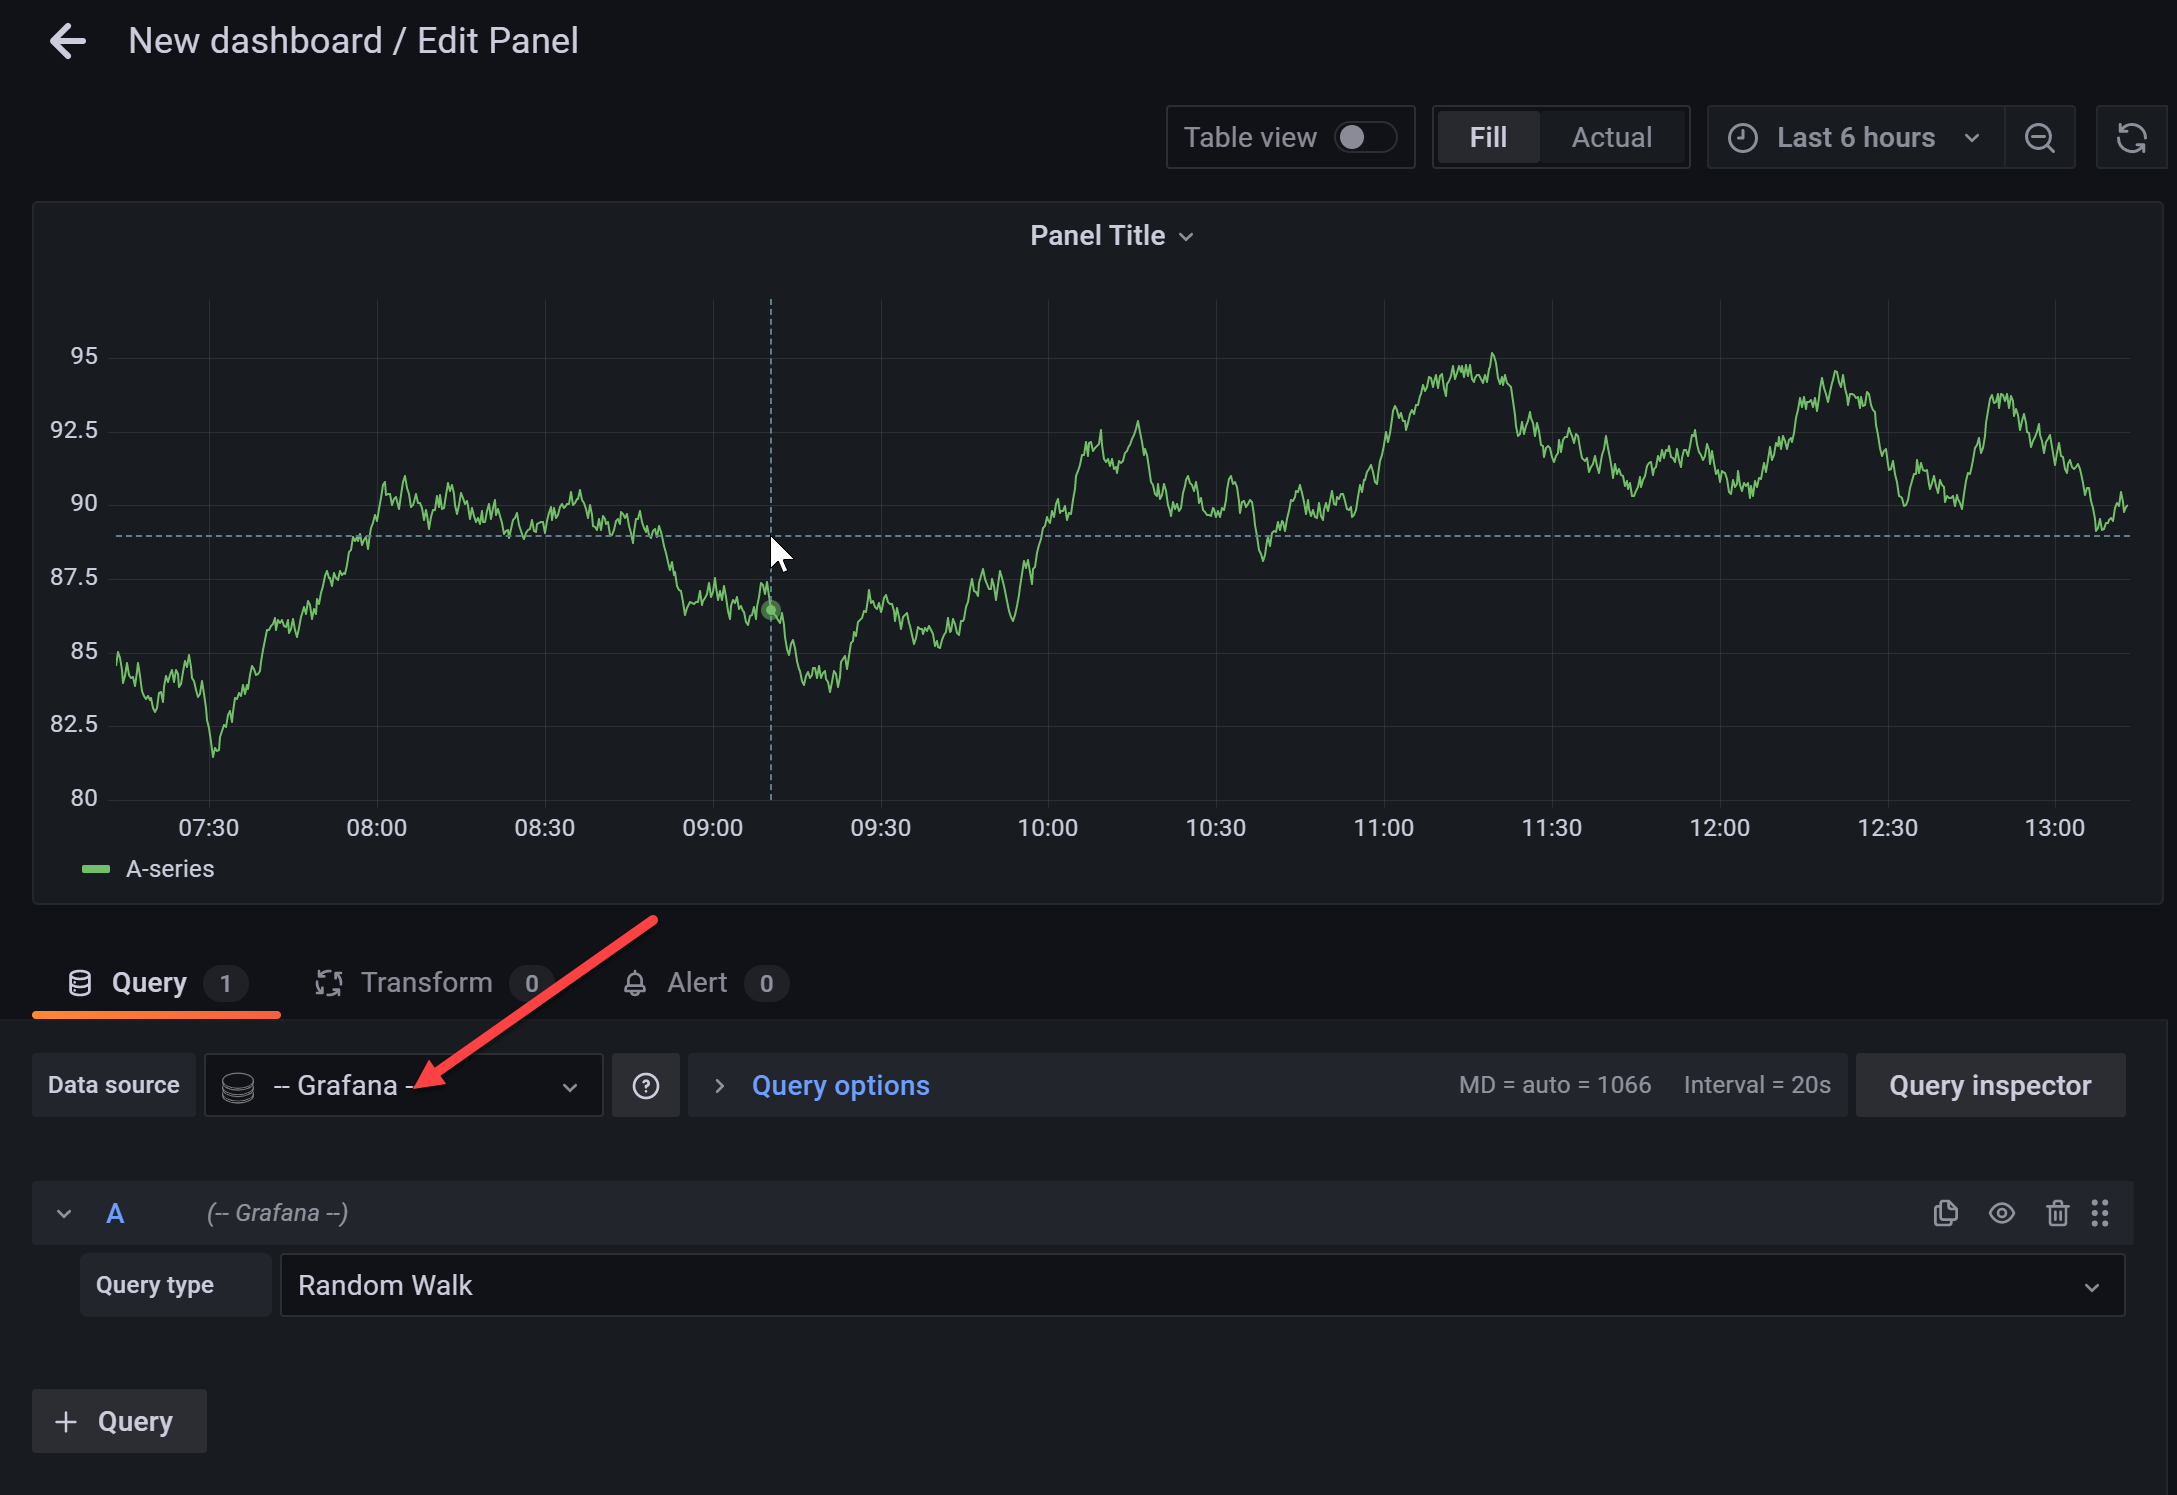
A Sample Dashboard appears.
-
From Data Source below the graph panel, select the Azure Monitor data source you defined earlier.
-
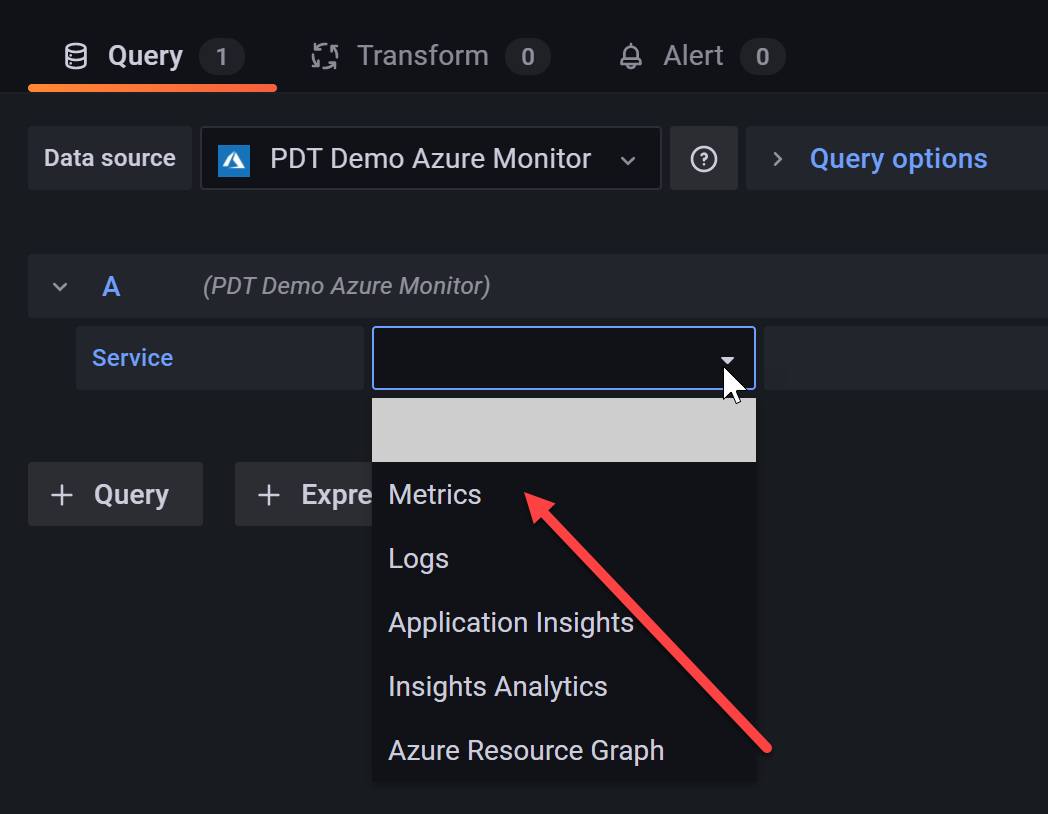
From the Service listbox below, select Metrics
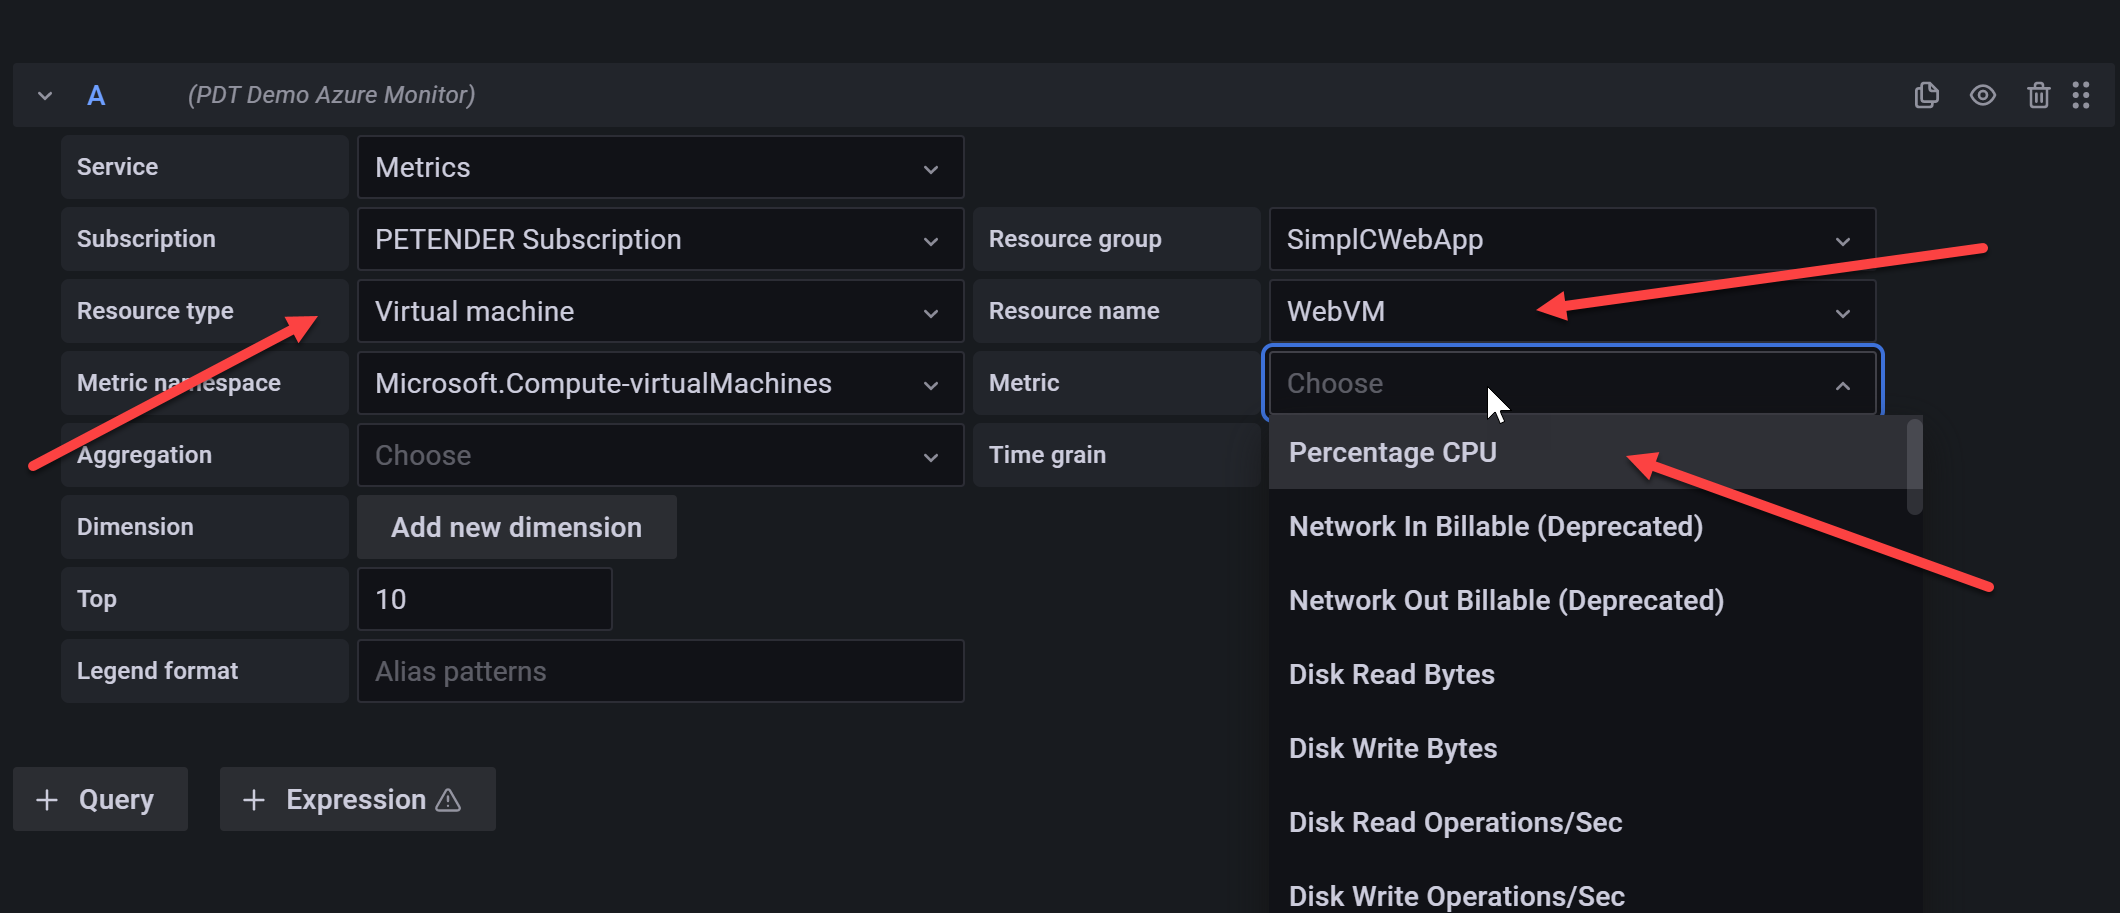
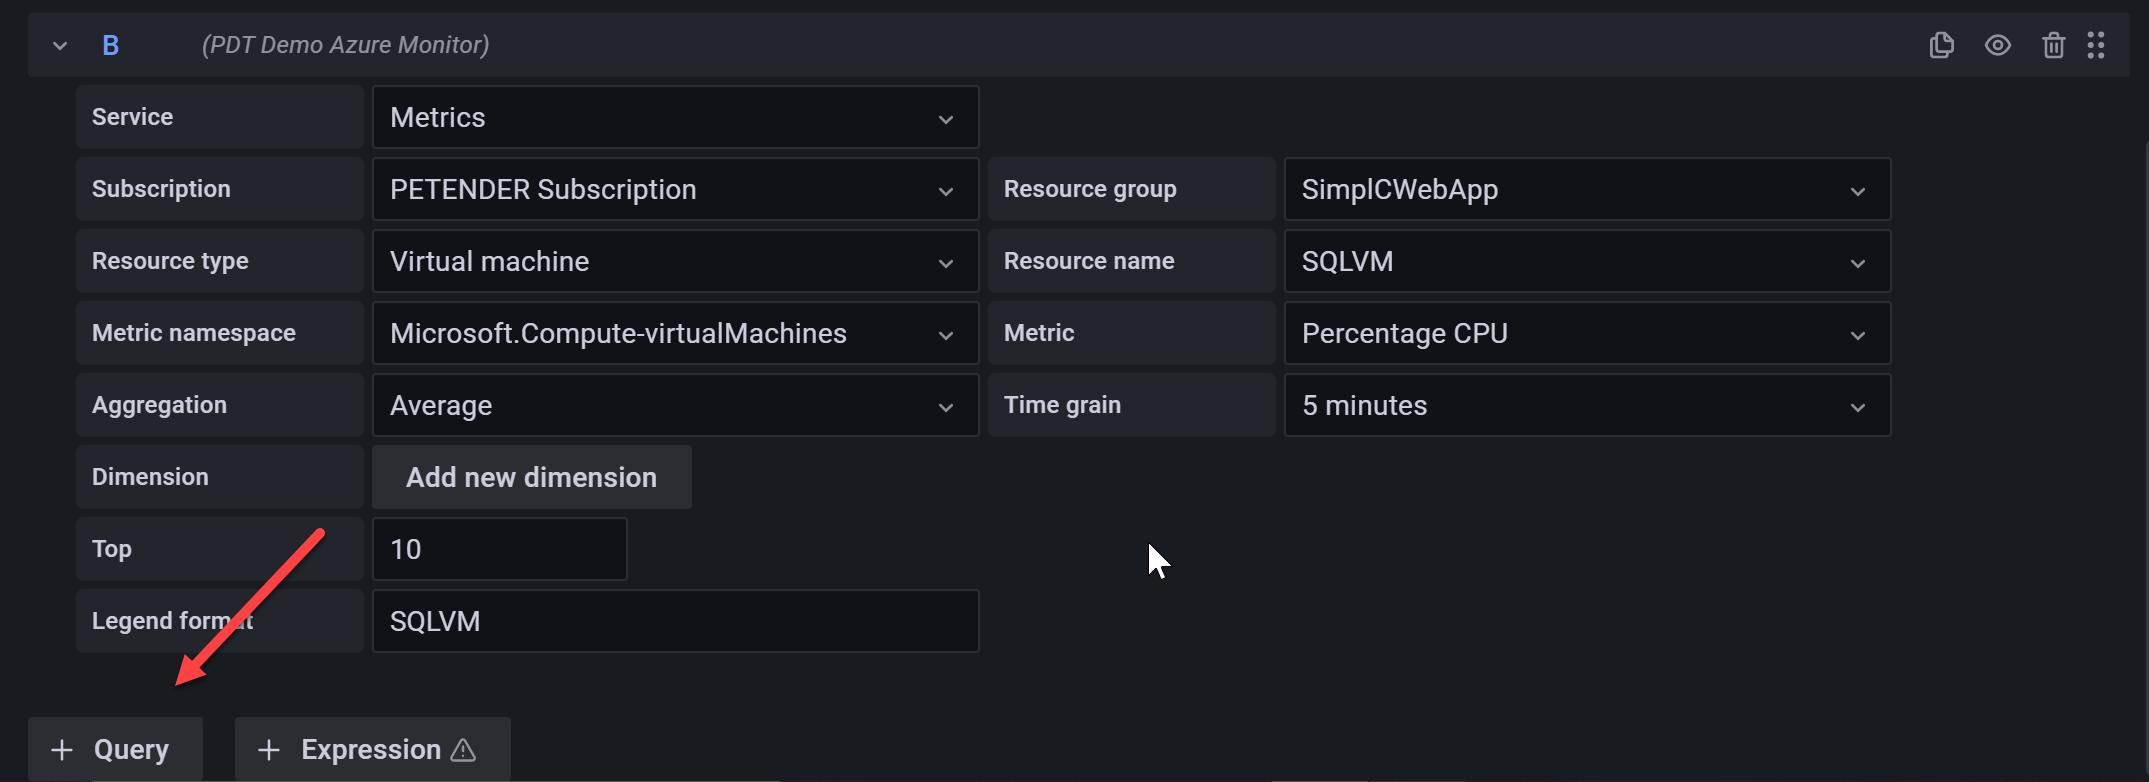
- This allows you to complete the different fields and select the Resource and Metric you want to read out. Below example reads the Percentage CPU for a sample WebVM Virtual Machine in my sample Resource Group SimplCWebApp
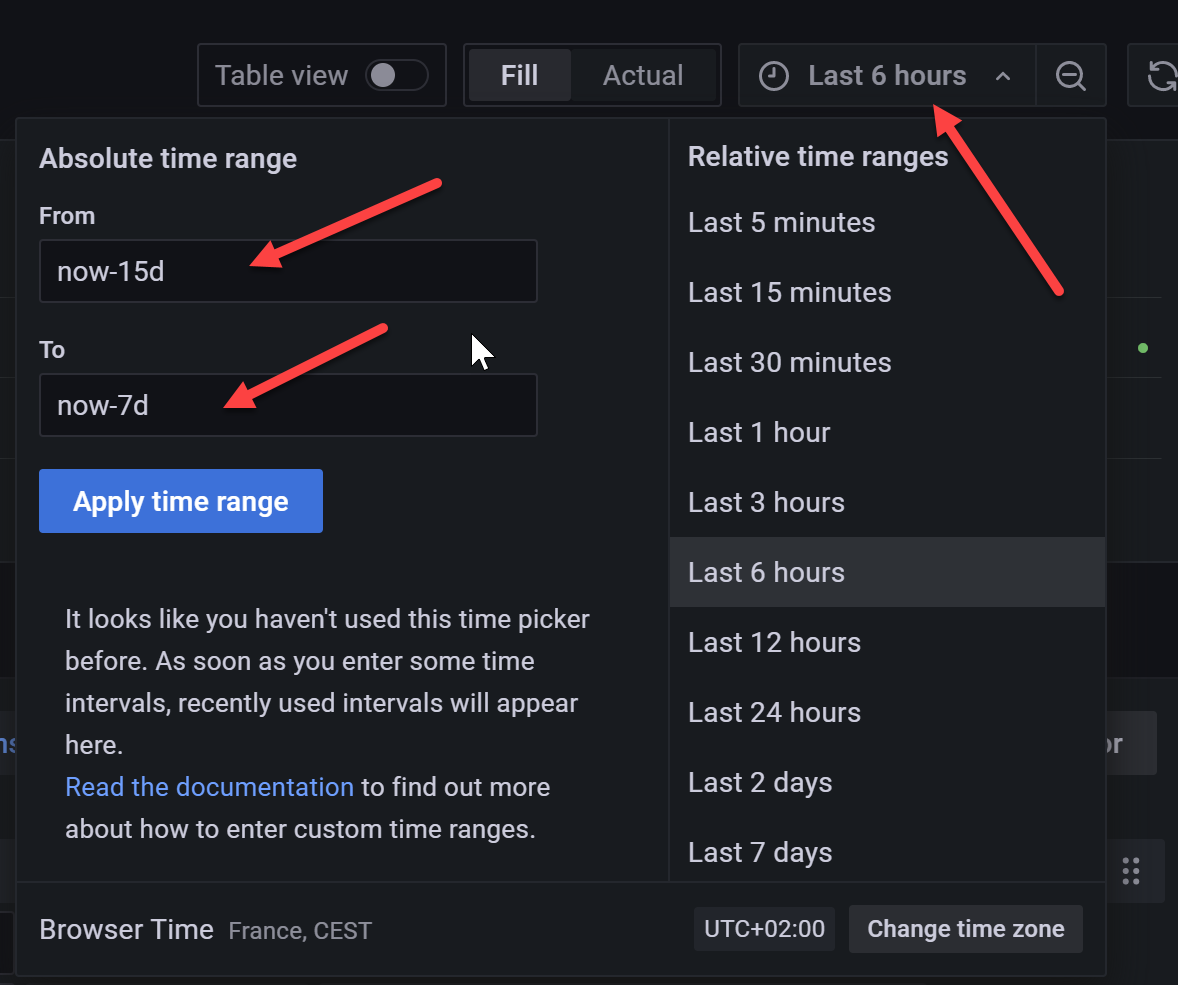
- Depending on the time frame you want to read out, you might want to alter the default last 6 hours parameter. I wanted to read out the information from the last 15 days, but only the first 8 days. This can be done by updating the From to now-15d and To to now-7d and click Apply Time Range
- Resulting in the following chart view:

-
From the right hand side panel you can customize more settings on what the chart should look like. I won’t describe many of the options, as they should be rather clear. But don’t hold back playing with the different options. For example Title and Legend Values are quite useful to add.
-
To add more information on the same chart, click the Add query button, and make some new selections. In my example, I added the SQLVM as 2nd resource
Resulting in the following updated chart:
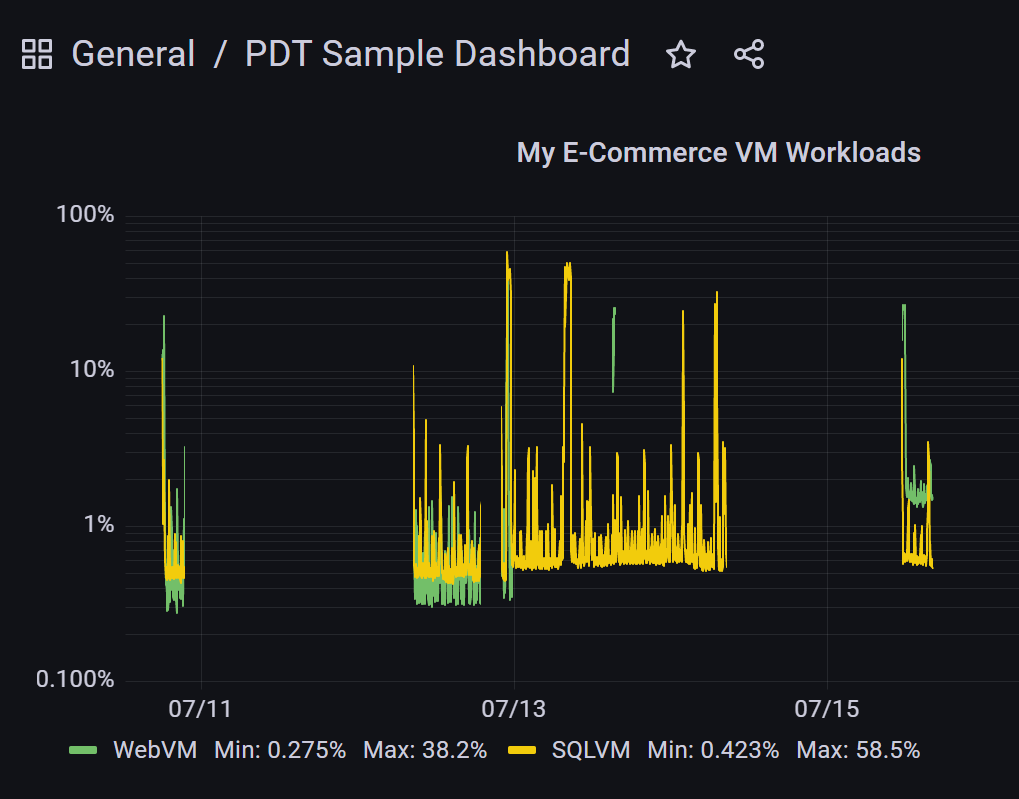
- Click the Save button in the upper right corner to save your changes, and store them as a full dashboard.
Importing pre-configured dashboards
The above example should get you going to build out custom dashboard views for about any Azure Resource type and metrics. However, for more complex workloads (like containers, Azure Kubernetes Service,…) why doing all the work from scratch yourself, when you can import preconfigured dashboards from here?
Since I have some container workloads and an AKS cluster up-and-running, let’s check out how this works:
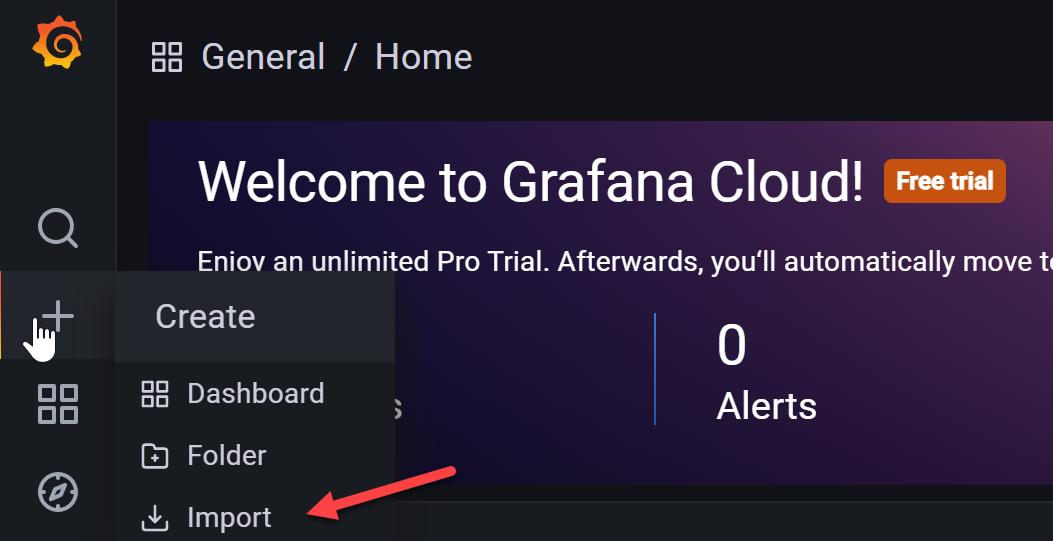
- From the Grafana Portal, select Create / Import
-
Enter the following URL in the “import from Grafana.com” link:
https://grafana.com/grafana/dashboards/12817
which refers at AKS Monitor Containers
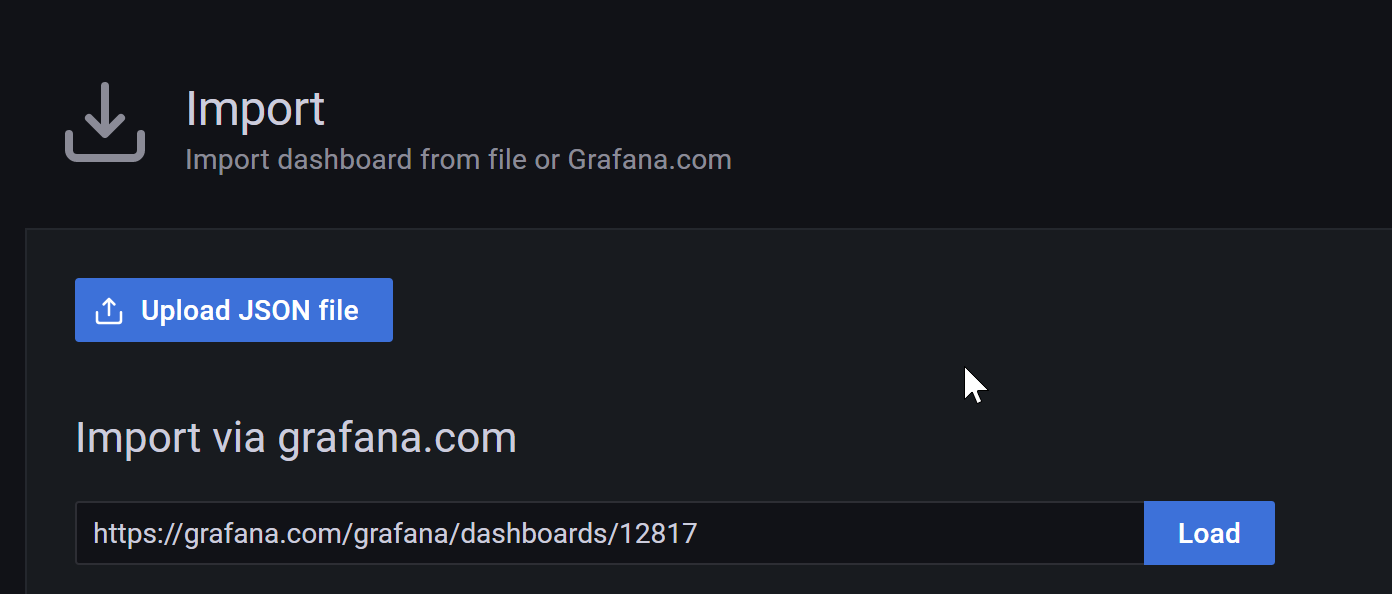
- And confirming with Load
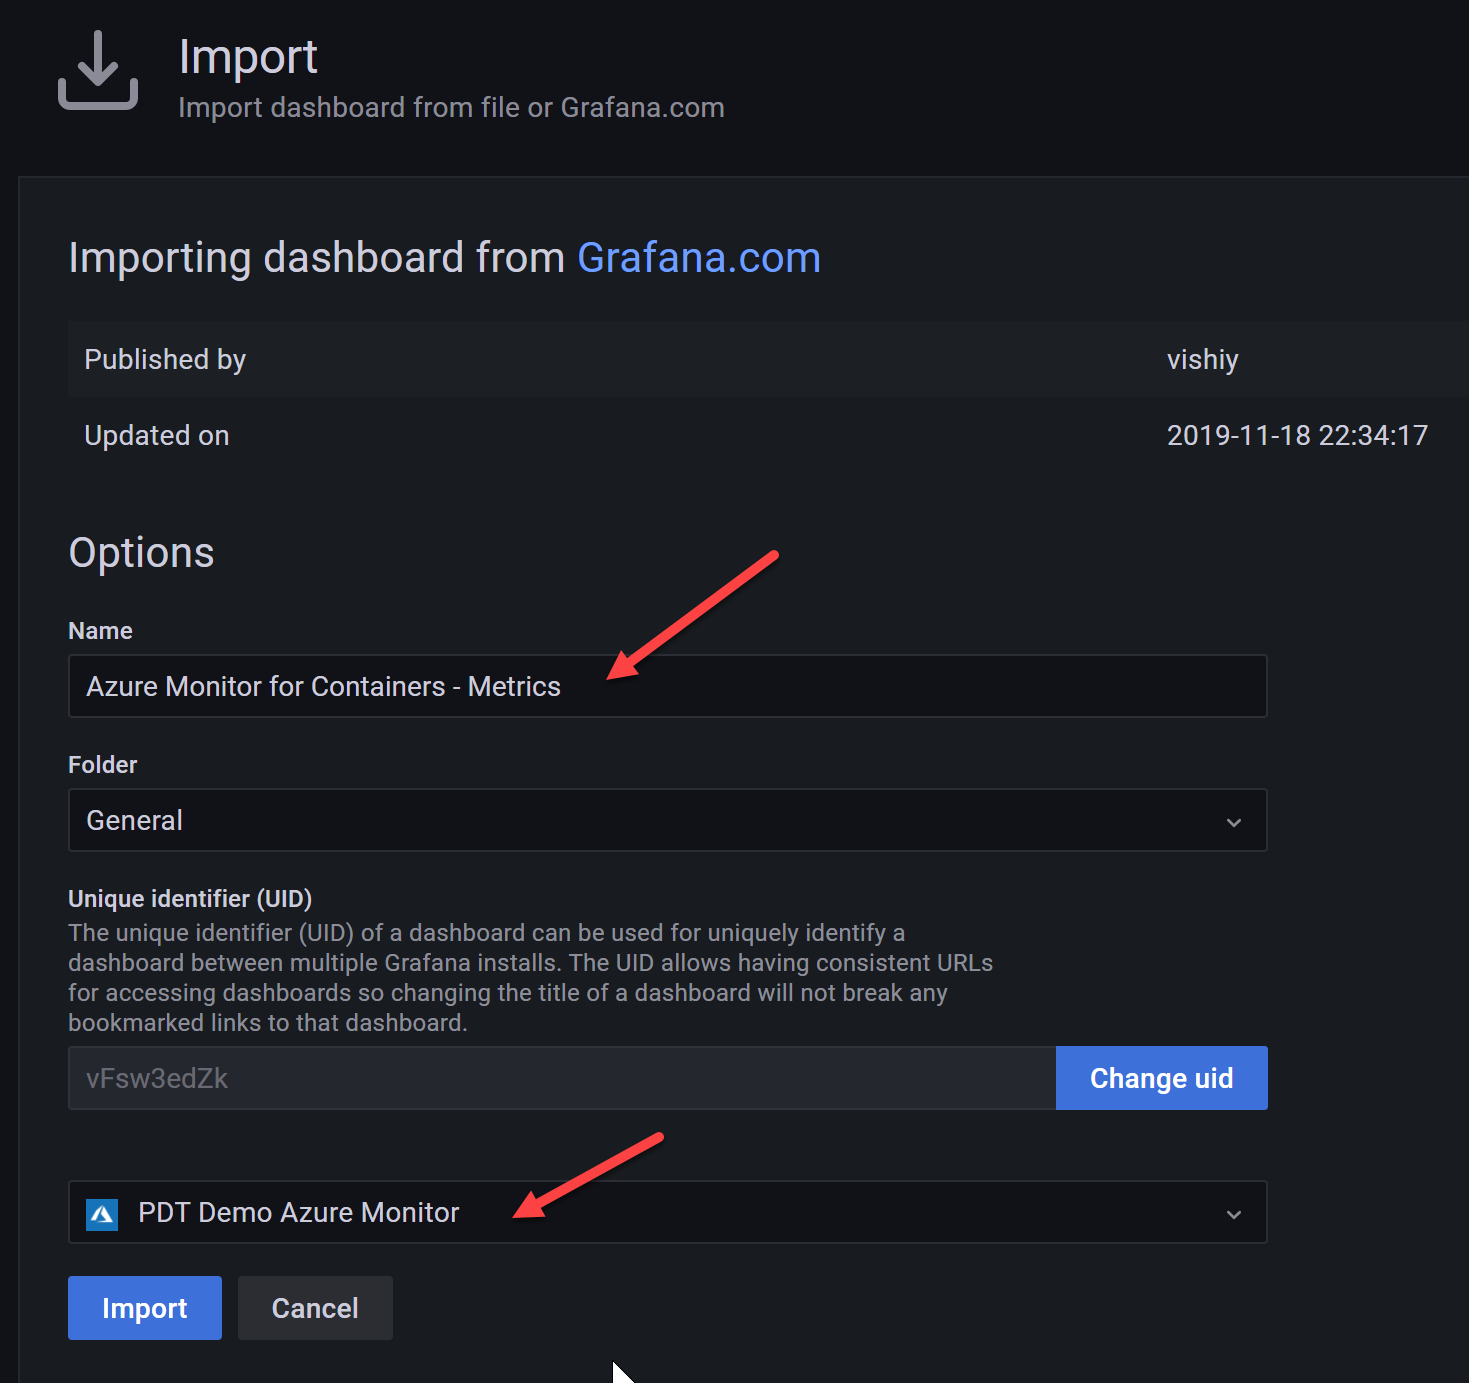
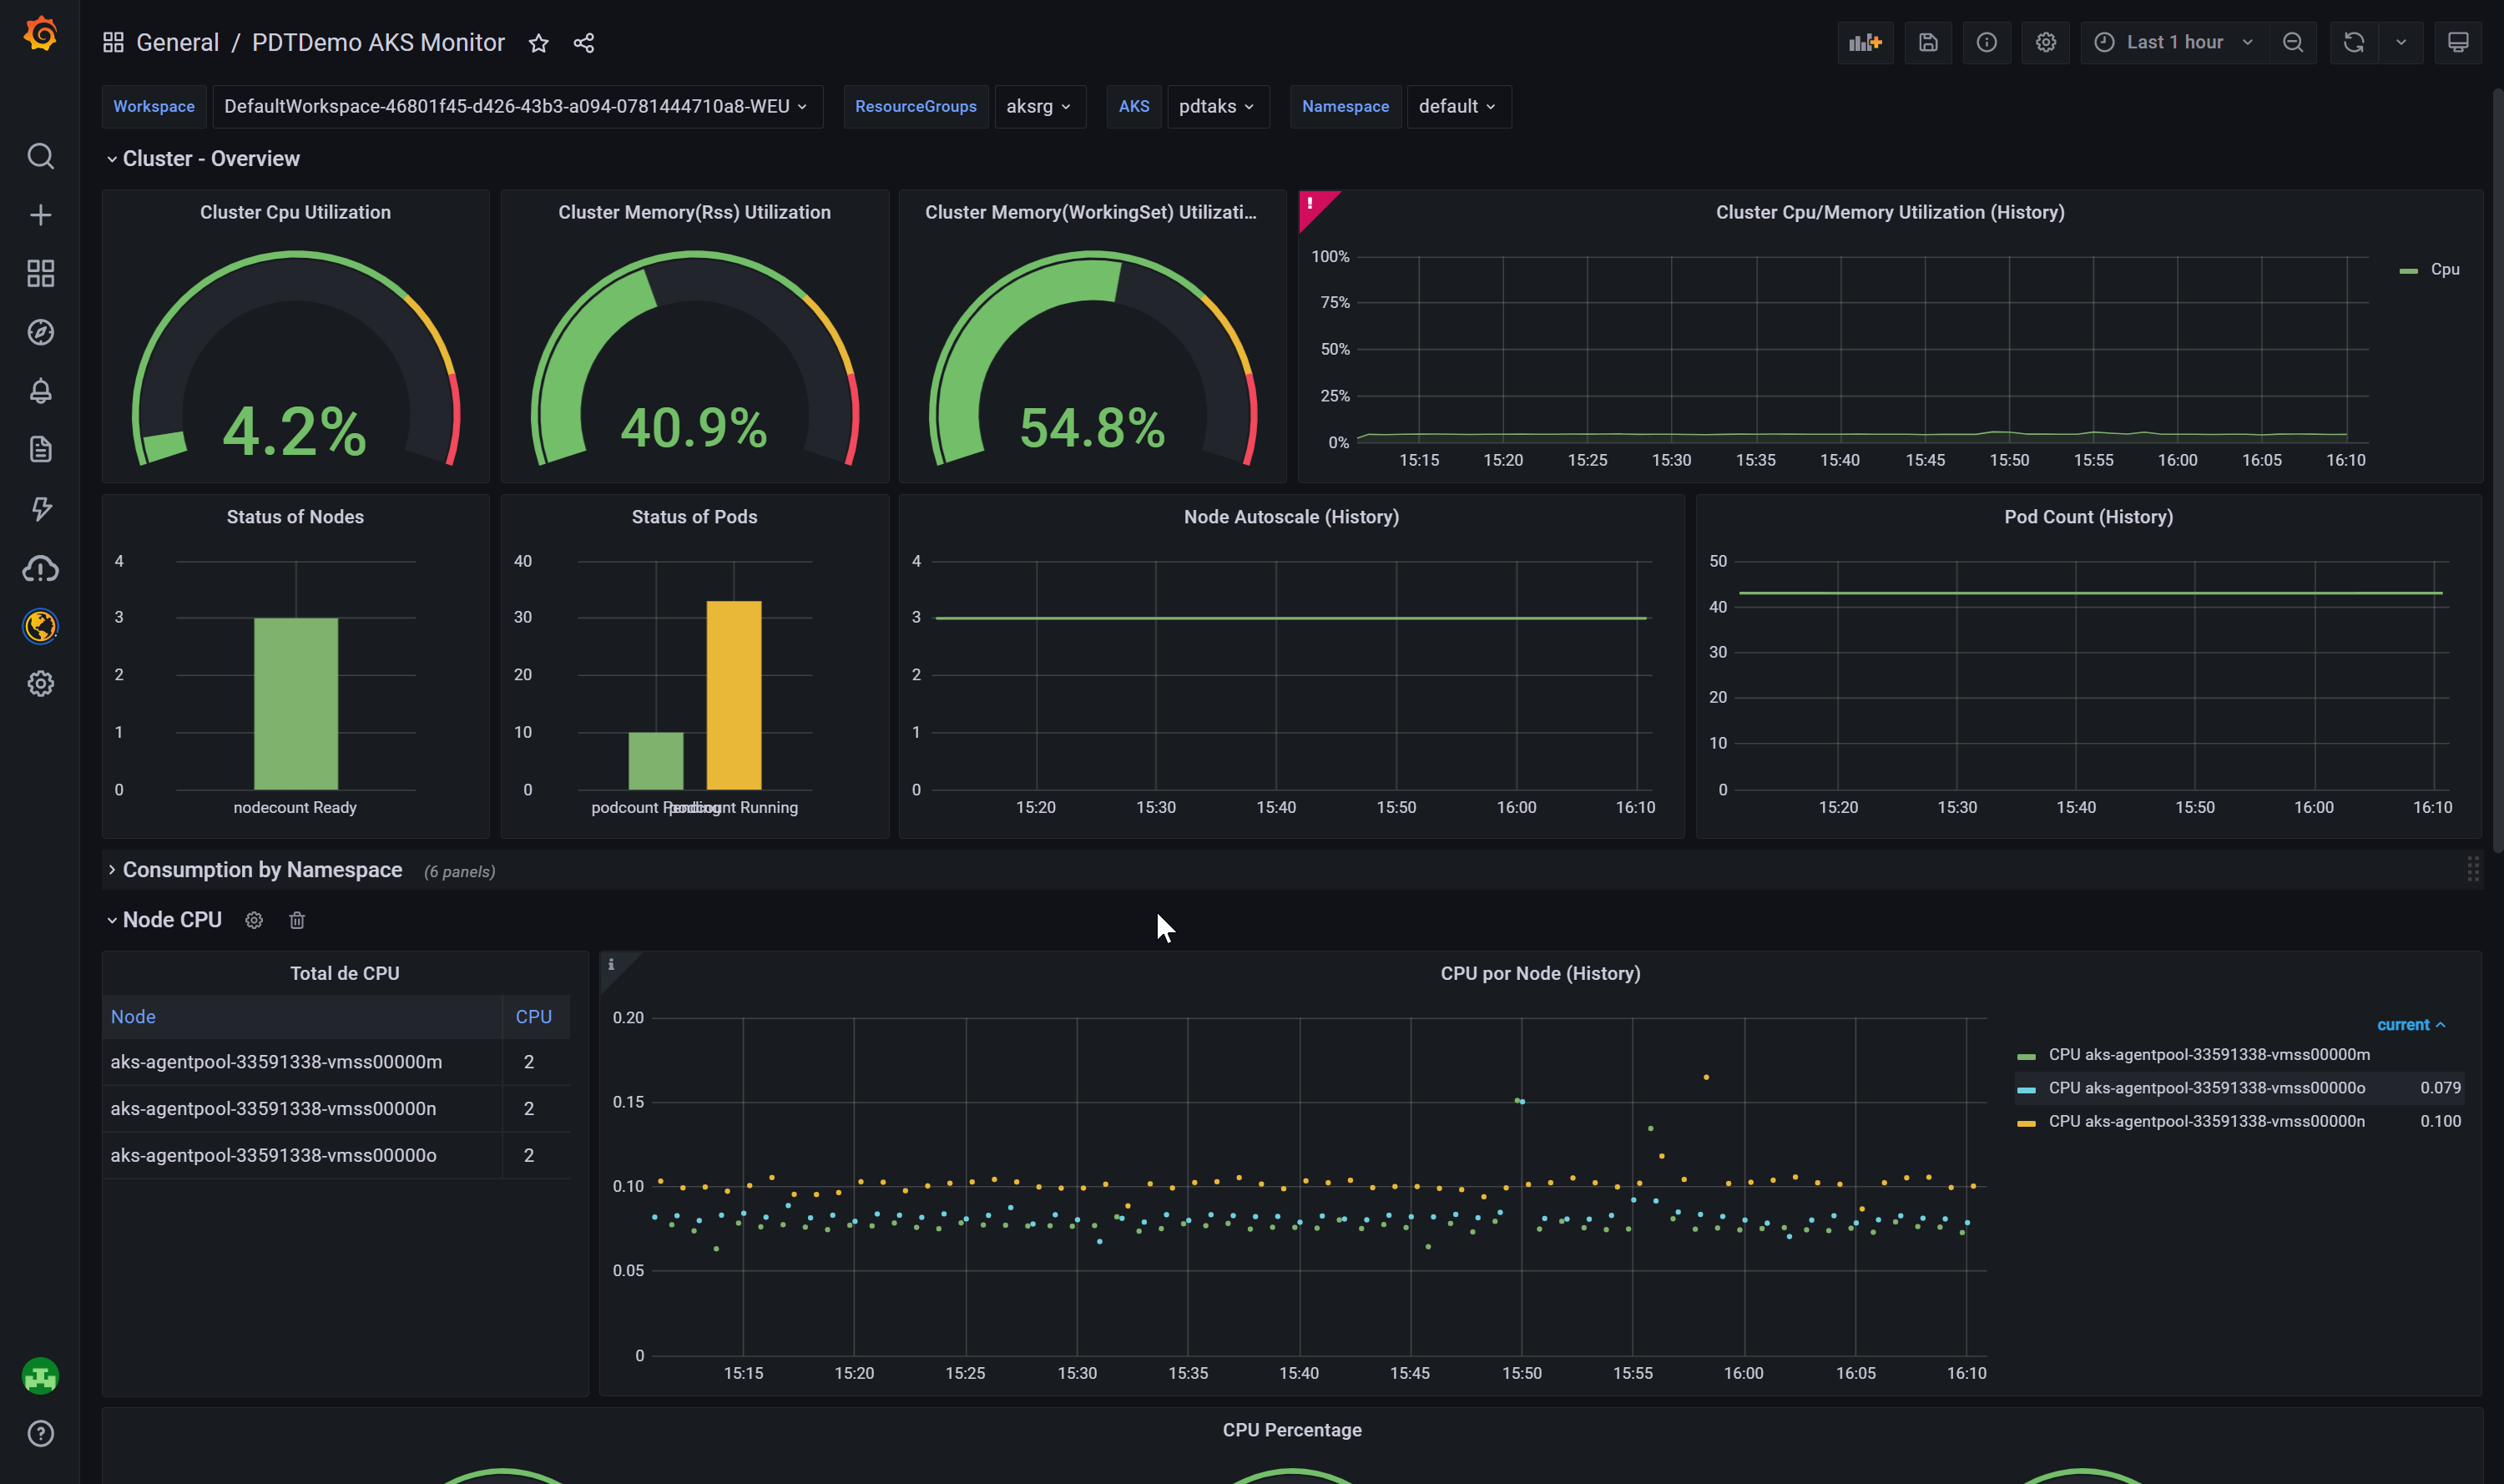
- Confirming with Import; after a few seconds, your full sample dashboard is loaded:
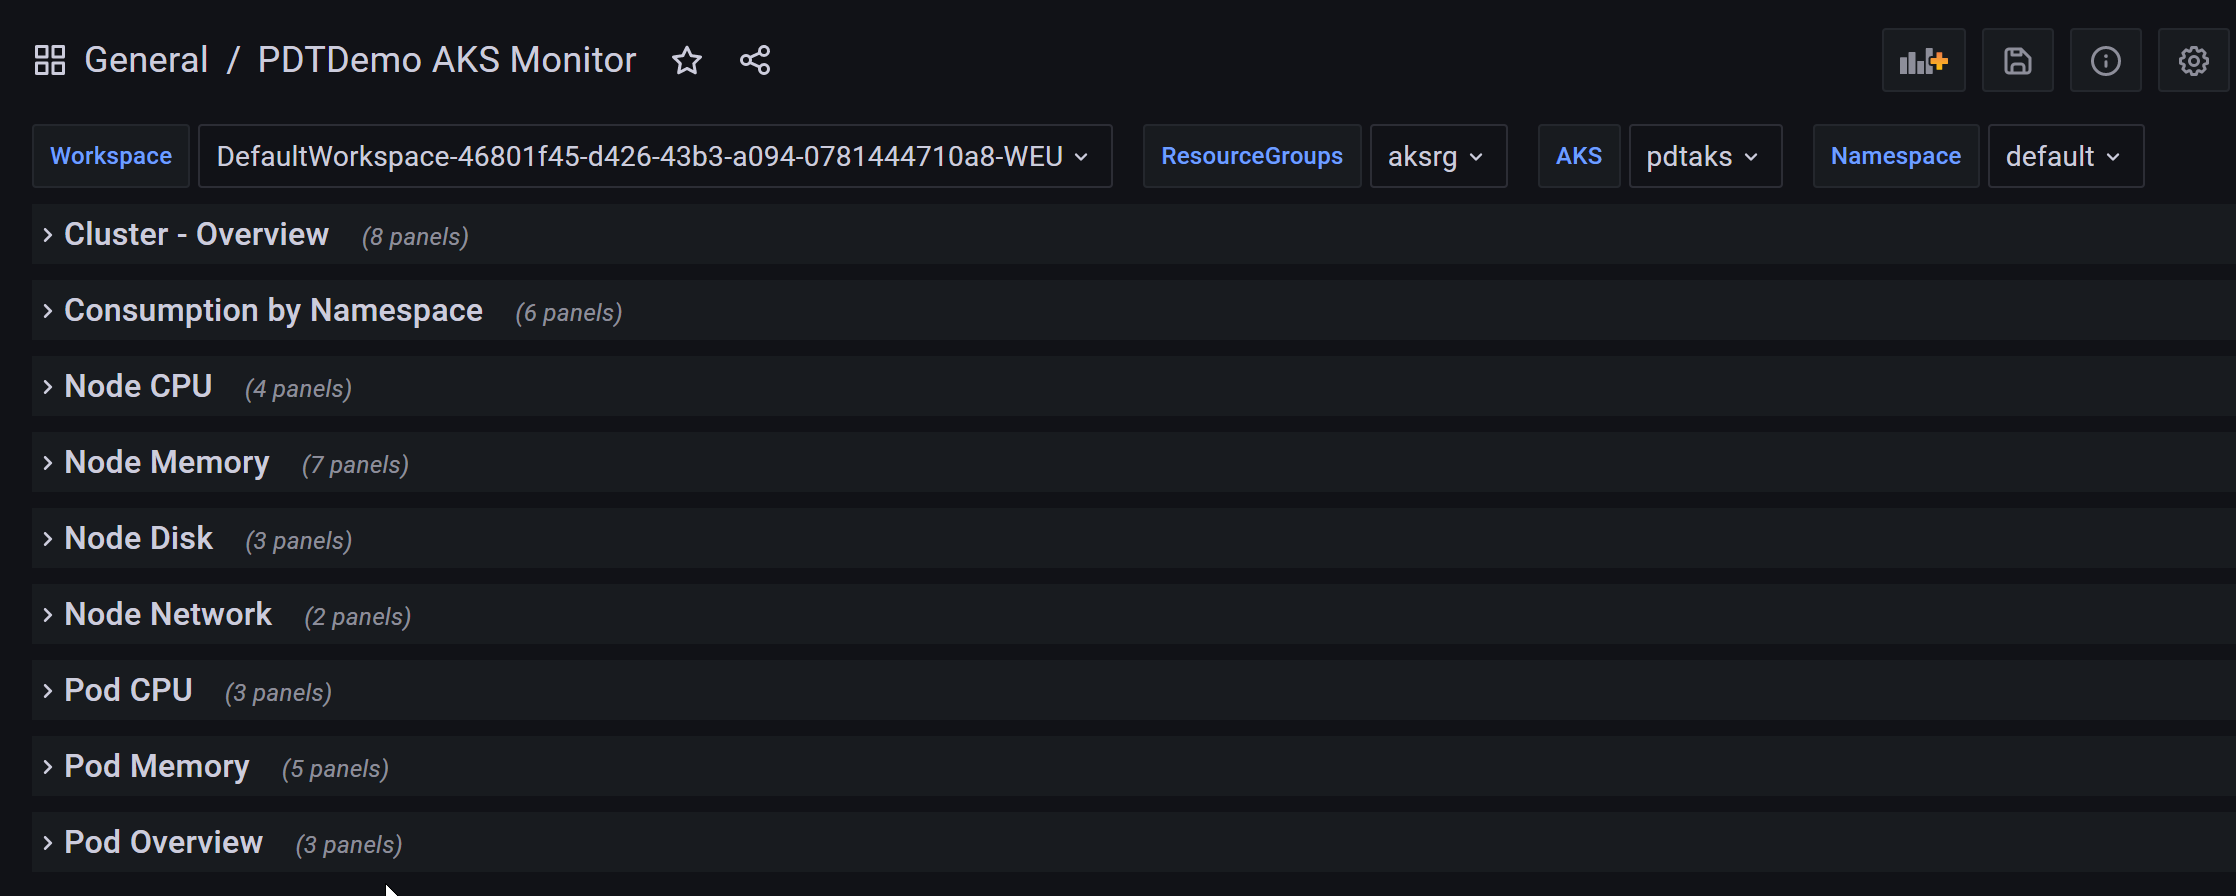
- Where for each section, several pre-configured dashboard panels are showing you multiple statistics of your AKS Cluster
Summary
In this article, I wanted to introduce you to Grafana, an Open Source dashboarding tool, allowing for aggregating different sources like Azure Monitor, Kubernetes, AWS, Docker and several other, and building up powerful dashboards. If you are only using Azure resources, I would personally recommend drilling down on all the capabilities of Azure Monitor and Log Analytics for sure. However, if you have a more hybrid or multi-cloud scenario, Grafana will definitely augment the power of Azure Monitor out of its integration with a huge amount of other data connectors.

0 comments