
In Visual Studio 2013, you can use IntelliTrace to view Microsoft Monitoring Agent data collected from a web application. This includes performance details in IntelliTrace which provides a great way to get back to your code to investigate performance issues that occurred on a production server. But what if the performance issue has something to do with the SQL database rather than the application code? The SQL database can be a common source of performance issues. To make these investigations easier in Visual Studio 2013 Update 2 we’ve added the ability to use the SQL tools built into Visual Studio to help diagnose SQL performance issues. Specifically, for ADO.NET events that execute a SQL command you can jump to the SQL editor inside of Visual Studio to examine the query and investigate the performance issue further. If there are parameters associated with the SQL query we will use the parameter information collected with the event and fill them in to the SQL that is generated.
In this blog post we’ll walk through a simple scenario to show what this new feature is all about.
Opening the IntelliTrace file – Summary page
We have an IntelliTrace file that was collected with Microsoft Monitoring Agent against our Fabrikam Fiber application running in production. The user had reported that sorting the list of support tickets was slow. When we open the IntelliTrace file we see the summary view as per the following screenshot:
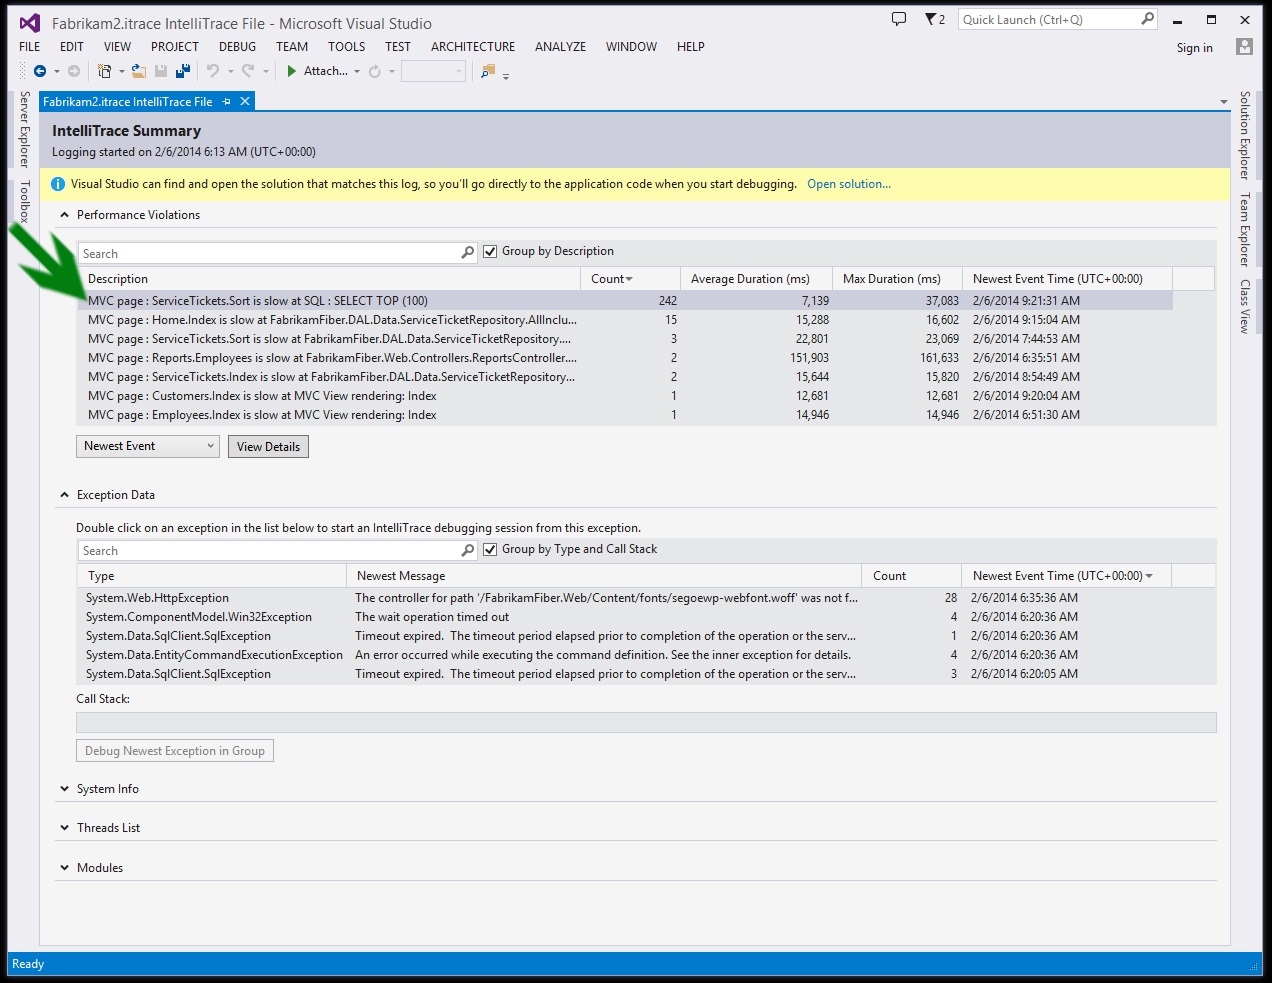
We can see that the performance violation event that pops to the top when sorted by the Count column is for ServiceTickets. Sort at a SQL command (green arrow in the screenshot). This fits with what the user was reporting so let’s take a closer look. We’ll click on the ‘View Details’ button to dig into this specific performance issue.
Digging in – Performance Details Page
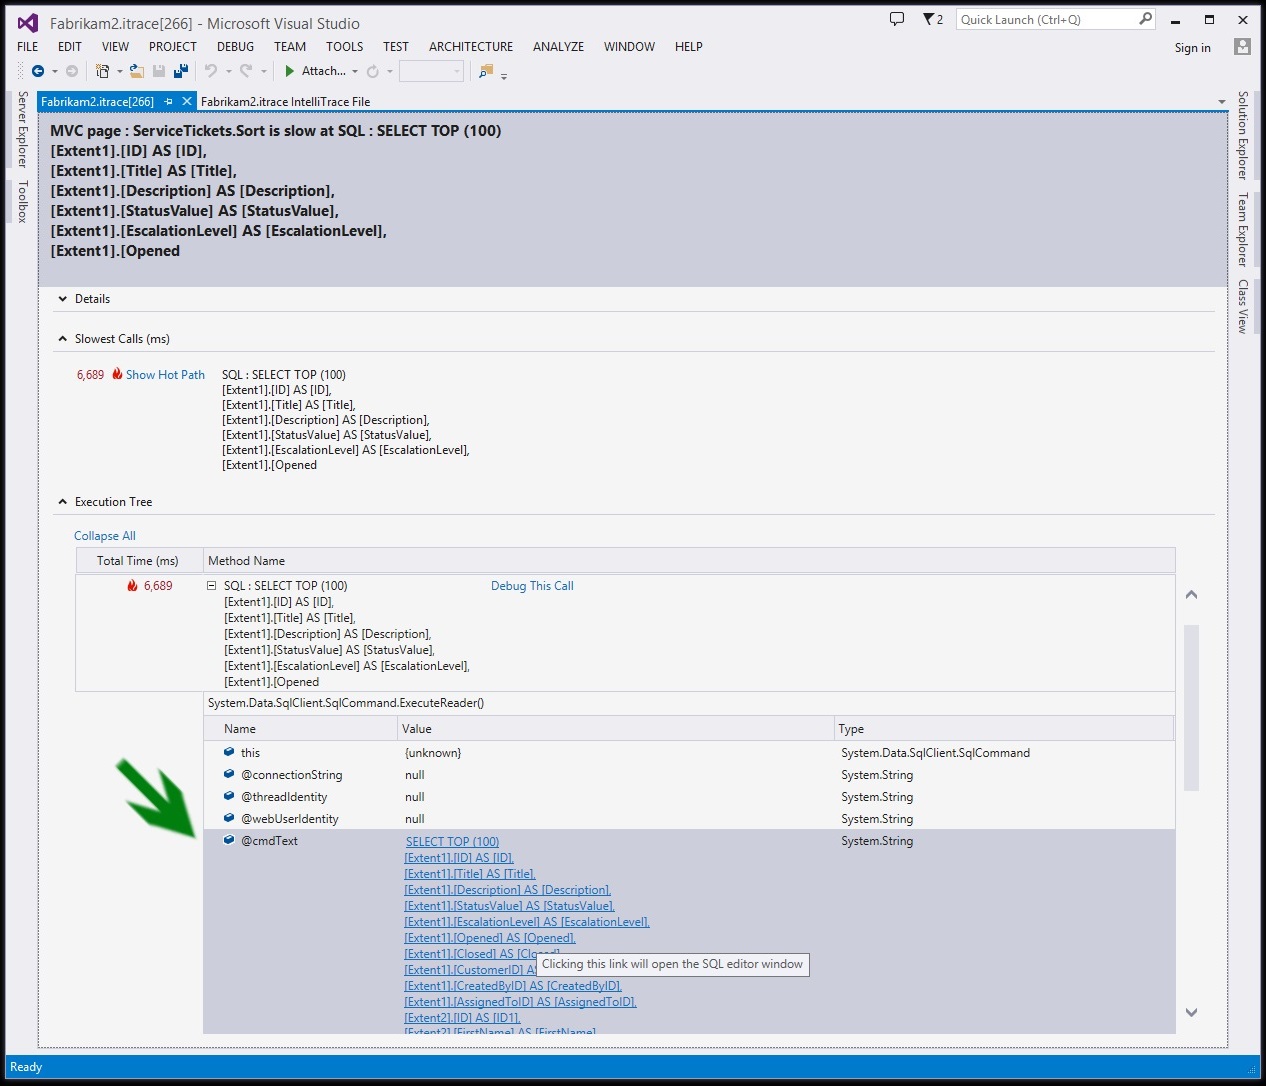
On the performance event details page the event we are interested in is displayed and the execution tree is expanded to the SQL call (which is the slow part of this execution) and its parameters expanded. Here comes the new part with Visual Studio 2013 Update 2: now the value for the @cmdText parameter is a link (green arrow in the screenshot). When we click on this link IntelliTrace will generate a temporary SQL file that represents this SQL query and open it in the built in Visual Studio SQL editor! Let’s look at that next.
Diving into the SQL
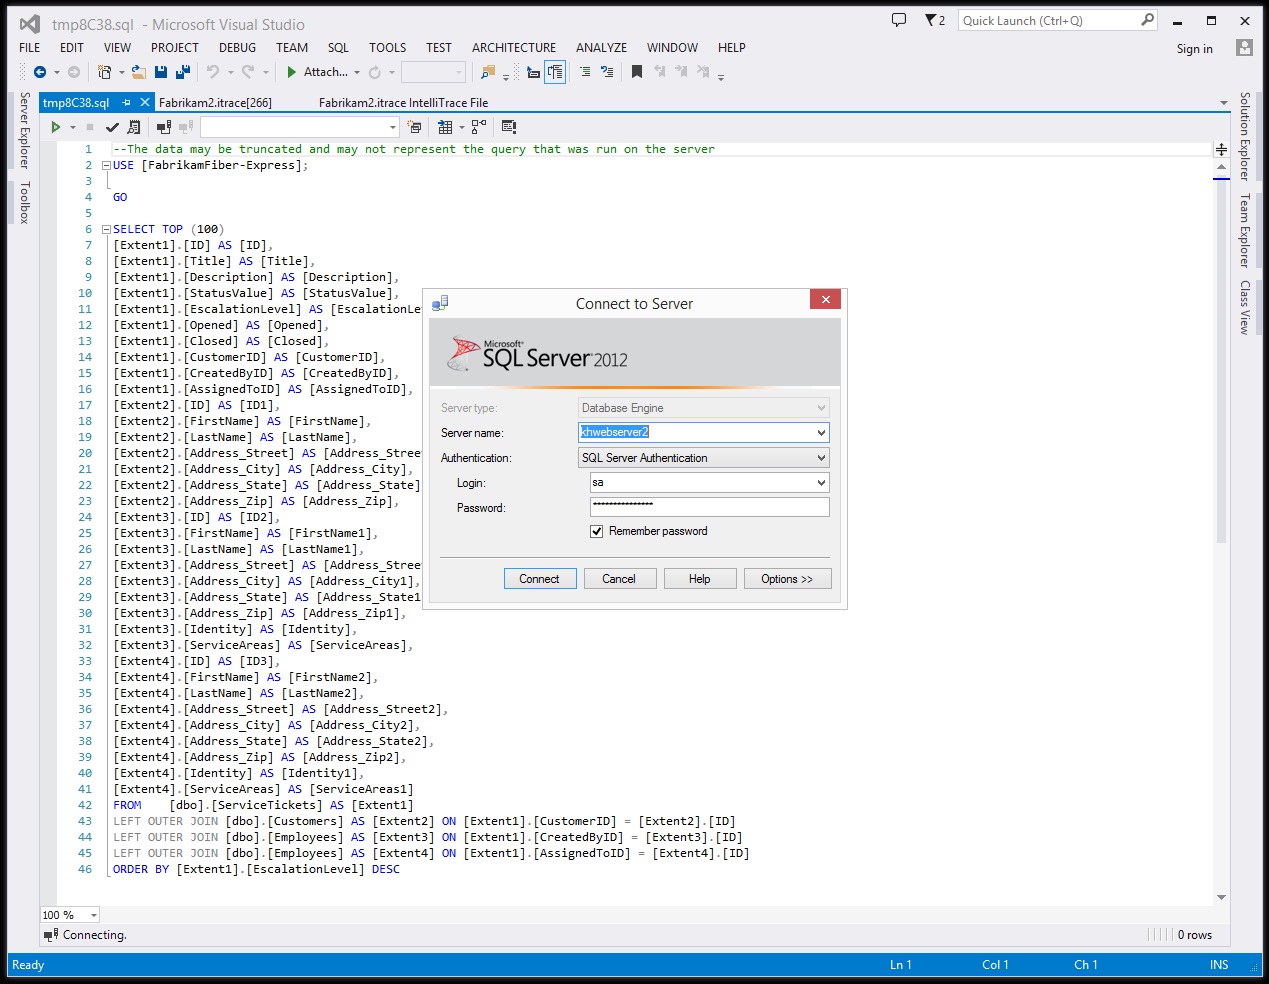
The first thing we need to do in the Visual Studio SQL editor is to select which database instance we want to connect to. This allows us to pick the database to use to continue our investigation in case we don’t have permission to the actual production database or we want to connect to a pre-production or test database to avoid affecting production data.
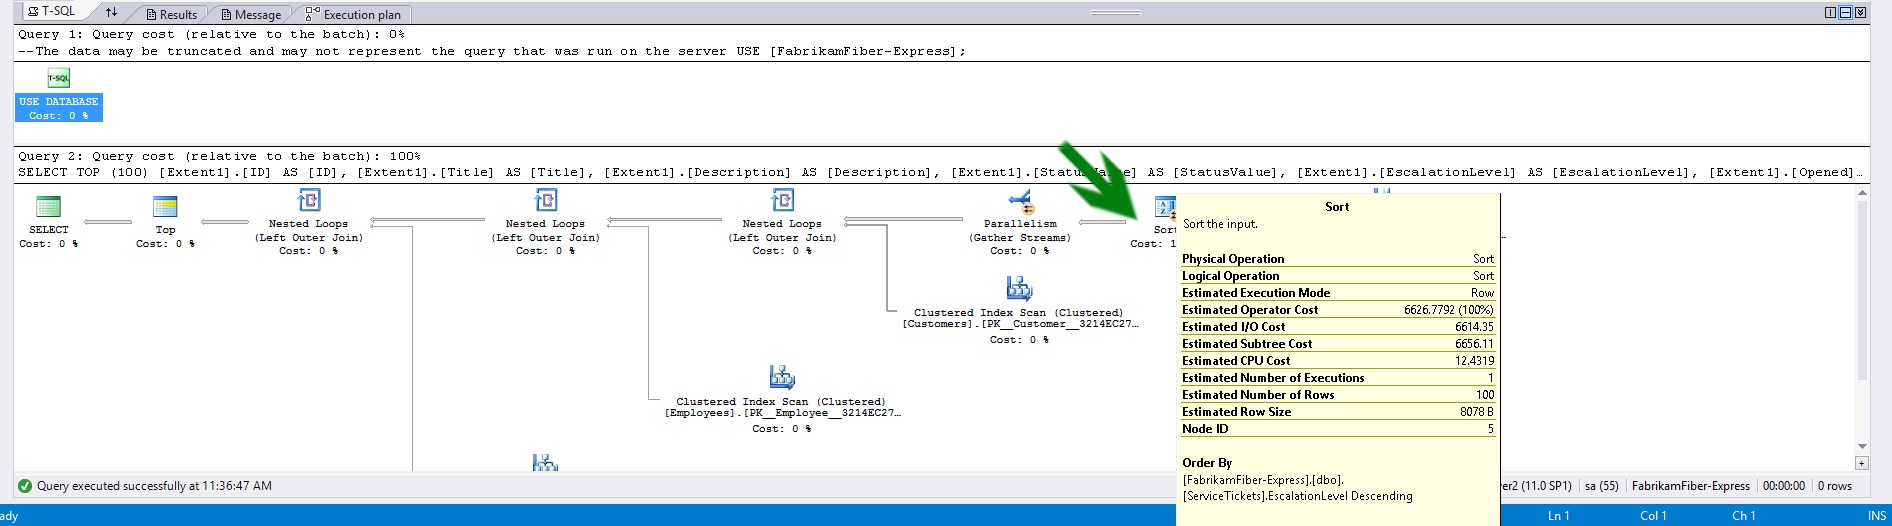
Now that we have the SQL command and are connected to a database we can use all of the SQL tools that Visual Studio has to offer. In this case we can take a look at the execution plan to see where the command is spending time. The sort operation (green arrow in the screenshot) is taking all of the time which after further investigation into the data turns out to be because the table we’re querying is much larger than we expected.
The issue here is that the sort is happening on the EscalationLevel column. The column isn’t indexed so now that this table contains a large number of rows the sort on this column in becoming problematic. Now that we know where the problem is we can look at resolving this issue by adding an index to the EscalationLevel column.
In Closing
With this new feature in Visual Studio 2013 Update 2 we can see how that even for performance issues coming from SQL commands we can quickly and easily get to the SQL command to investigate! No longer do you need to open up another tool and track down the SQL command on your own, Visual Studio will do all the heavy lifting for you! If you have any feedback on this, or any IntelliTrace feature, please let us know at our diagnostics MSDN forum.
0 comments