UI Enhancements for IntelliTrace with Visual Studio 2013 Update 2
As announced previously on this blog, with Visual Studio 2013 RTM, we also released the Microsoft Monitoring Agent (MMA) which can produce .itrace files for issues with applications in production.
This includes exception information, but also performance event violations. In Visual Studio 2013 Update 2, we continue to improve this experience by providing better visualization and analysis for this MMA scenario. This blog post focuses on two of these: performance event grouping (for when the data is sourced from MMA Standalone), and performance details hot path (for MMA data from Standalone, System Center, or AppInsights).
IntelliTrace Performance Event Grouping
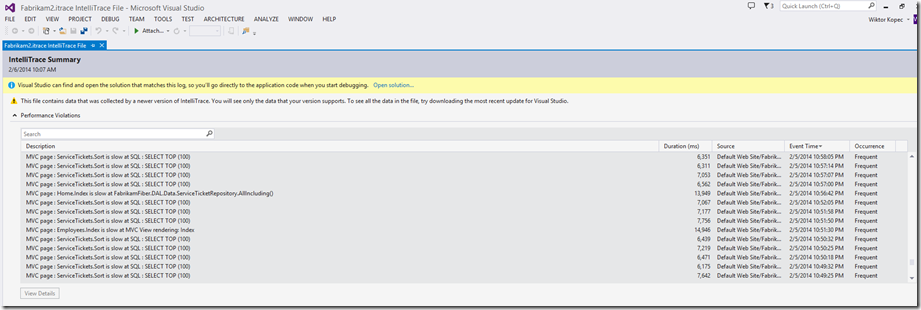
While exception information is already grouped, performance data is not with Visual Studio 2013 RTM, as per the following screenshot.

The quantity of performance events can get extremely large, especially when collecting over a long period of time. However, they can also be very redundant, most likely because they point to the same root cause. In Visual Studio 2013 Update 2, we introduce grouping to address this issue, as per the following screenshot. Notice we don’t even have a scrollbar to scroll through.

Performance events with the same description are now combined together. Additional data, such as average and max durations per event description are also displayed. Getting details for each event will automatically pick the newest event, but can be changed to select the slowest one instead. Grouping makes it easy to find recurring performance violations and reduces the noise when analyzing failures. You can also uncheck the ‘Group by Description’ checkbox to see the complete list of events, and hence revert to the Visual Studio 2013 RTM experience.
IntelliTrace Performance Details Hot Path
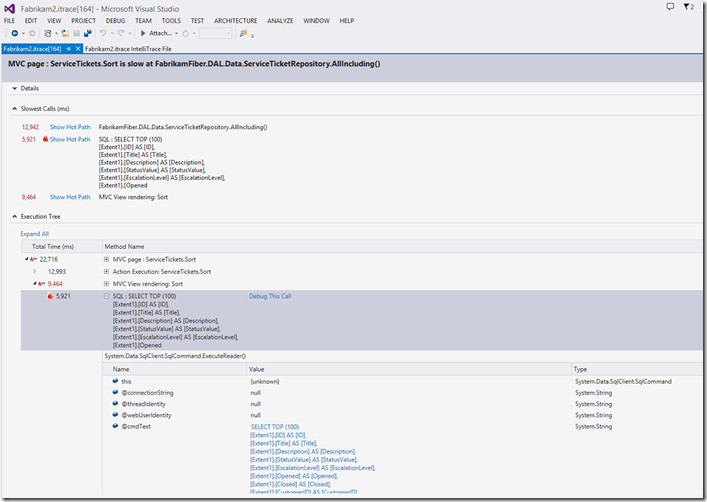
Once you’ve picked the event you are interested in, you can double click it to go to the performance details page. We’ve made several improvements here, one of which is to visualize the hot path for the slowest calls. A slow call is a method which took considerably long to run relative to the total time.

The hot path indicates the methods that led up to a slow call. The methods are indicated by small flames, and the slow call is indicated by the large flame. Visualizing the hot path makes it easier to figure out the flow of the code that led to the performance violation, especially in a complex tree. Switching between different hot paths will automatically expand and collapse the right nodes in the tree. In the example above the slowest call is an Entity Framework generated SQL query. We’ve added some additional analysis over slow SQL calls, and we describe that in our other blog post on Jump to SQL with IntelliTrace.
In Closing
We hope you find these two UI improvements in the Visual Studio IntelliTrace experience for MMA-sourced IntelliTrace files useful. For feedback on this, or any IntelliTrace feature, please ask us at our diagnostics MSDN forum.

 Light
Light Dark
Dark
0 comments