This post has been updated to reflect the state of features in Visual Studio 2015 RTM.
By now you will have heard the exciting news that Visual Studio 2015 supports C++ development on Android (and that includes an Emulator for Android).
Obviously no development experience is complete without debugging support, so this means that Visual Studio 2015 supports debugging C++ code running on Android. With this new debug engine, the debugging experience you’ll get includes (but is not limited to):
F5, attach to process and support for debugging existing .apk’s, Output window, Breakpoints (including conditional breakpoints), Step Into/Over/Out, Run To Cursor, Call Stack, Data and Variable windows (including support for using Natvis files), Modules window, Address level debugging (Disassembly, Memory, Registers windows), Threads window, Parallel Stacks and Parallel Watch windows.
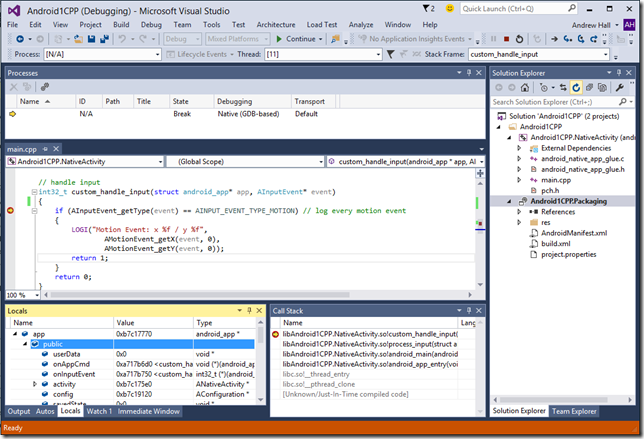
Below is a screenshot showing Visual Studio stopped at a breakpoint in C++ code for an Android app. You can see in the processes window the “Debugging” column shows “Native (GDB-based)” indicating this is Visual Studio’s GDB based debug engine for Android. 
In Visual Studio 2015, it is worth noting the following current limitations for C++ debugging
- Debugging requires Android 4.2 or above (Jelly Bean—API level 17)
- Stop debugging does not kill the app (it remains running)
Additionally the following debugger functionality is not supported:
- Diagnostic Tools window
- 64-bit processes
- Changing exception settings in the Exceptions window
- Hexadecimal display of integers
- Android thread names do not appear in the Threads window
- Autos window
- Return values
- Interop debugging with JIT’d runtimes (e.g. Java or Xamarin)
- Just My Code
- Edit and Continue
- Tasks window (including Tasks view in the Parallel Stacks window)
Please try debugging Visual Studio’s debugging support for C++ on Android and let us know if you find any issues not already listed above.
Lastly, please let us know how the debugging support works for you, and report any issues or overall feedback below, through the Send a Smile feature in Visual Studio, or in our MSDN forum.

0 comments