

29 April, 2015: Updated for the release of Visual Studio 2015 RC
Introduction
In Visual Studio 2013 we introduced the Memory Usage tool as part of the Performance and Diagnostics hub. This tool, like the rest of the profiling tools in the Performance and Diagnostics hub, is designed to work with processes without a debugger attached, leaving you without the fine-grained execution control that a debugger gives you. Full analysis only occurs after your profiling session is complete, a process we often refer to as post-mortem analysis, so you have to wait until the end to see any results and perform your investigations. We also introduced “Debug Managed Memory”, a tool that only works on .NET dump files.
In Visual Studio 2015, we are providing a new way of profiling your app’s memory: a Memory Usage tool you can use while debugging.
How is it Different?
The biggest new thing is that you can use your favorite part of Visual Studio, the debugger, to control how your application executes while investigating performance issues. Setting breakpoints, stepping, Break All, and other debugger actions can help you focus your performance investigations on the code paths that are most relevant. Performing those actions while your app is running, instead of only investigating in a post-mortem fashion, eliminates the noise from the code that doesn’t interest you. This can significantly reduce the amount of time it takes you to diagnose an issue.
Using the Tool
If you’re familiar with the post-mortem Memory Usage tool in the Performance and Diagnostics Hub then you’ll find the new memory tool very familiar. Like the hub version of the tool, the new memory tool…
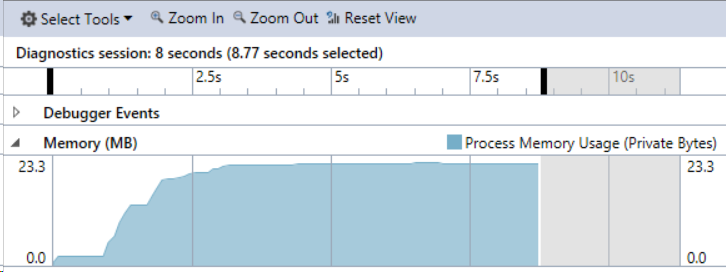
Displays a live graph of your application’s Private Bytes metric. Private Bytes is a measure of the total amount of memory that a process has allocated, not including memory shared with other processes. The metric includes memory allocated on both the managed and native heaps.
Has different modes depending on what area of memory you’re investigating: managed, native, or both
Allows you to take detailed snapshots, and
Has a heap analysis view for deeper investigation of the process memory.
While the interface will feel familiar, there are several enhancements, which I’ll go over in this post. The following sections assume you are familiar with the post-mortem version of the tool. If you’re not, I recommend reading “Diagnosing memory issues with the new Memory Usage Tool in Visual Studio”.
Break-Aware Live Graph
One of the key features of the Diagnostic Tools window is that it records only the time your application is running and filters out the time you spend in break states. So, when you are stopped at a breakpoint, reviewing your code, the graph is not advancing. When you press F5 or F10 to step, the graph updates as your app runs to the next break.
Simplified Mode Selection
In the post-mortem version of the Memory tool, you can configure the tool to profile managed memory, native memory or both. This new tool is closely tied to the debugger, so which heap you profile is based on which debugger you are using:
- With the managed-only debugger, snapshots are only taken of the managed heap*
- With the native-only debugger (including native projects), snapshots are only taken of the native heap*
- With the mixed mode debugger, snapshots are taken of both the managed and native heap*
This setting can be adjusted on the Debug page of your project’s properties.
**When profiling memory in native-only or mixed mode, only the live graph is on by default. In the “Memory Usage” tab, a setting allows you to enable snapshots for your next debug session. This extra opt-in is in place because profiling the native heap while debugging can have a significant impact on the performance of the process being debugged. Snapshots are enabled on per-solution basis, so each new solution requires you to opt-in again.*
Improved Mixed Mode Snapshots
When in mixed mode, the post-mortem tool only shows either the native snapshots or the managed snapshots, requiring you to switch a toggle to see each. In the new debugger-integrated tool, each snapshot shows you summaries of both the managed and native heap, simultaneously, on one row.

A Familiar Heap View
The Heap View allows you to view all active memory on the heap by type. The debugger-integrated Memory Tool’s heap analysis view is based on the Heap View you can access when debugging managed dumps. Three excellent blog posts not only introduce you to this view, but also to managed memory investigations in general:
- Using Visual Studio 2013 to Diagnose .NET Memory Issues in Production
- .NET Memory Analysis Enhancements in Visual Studio 2013
- .NET Memory Analysis: Object Inspection
It’s worth checking them out to get acquainted with how the Heap View works for managed memory.
For native memory, new innovations in the VC++ compiler allow you to examine the native heap by type as well.
Where do I Find it?
The debugger-integrated Memory Usage tool is part of the new Diagnostic Tool window. Check out the blog post for more on the Diagnostic Tools window and what projects and configurations are currently supported.
As long as you’re debugging a supported project type the Diagnostic Tools window will open side-by-side with your code and the Memory Usage tool will be running.

When you end your debugging session, the Diagnostic Tools window will undock from the right side of your code, and appear behind your open documents in the editor. If you close the window during a debugging session, it will not appear again. You can open it using the Debug -> Show Diagnostic Tools command in the Debug menu.

We Want Your Feedback
The debugger-integrated Memory Usage tool will feel familiar to many of you. The ability to control the process using the debugger adds new power and productivity to your investigations. Even though the experience is not finalized, we want to give you a way to try it out even at this early stage, so that we can get your feedback.
What do you think? Is this a tool that will make your job easier? Are there other features that would enhance your experience? We love user feedback, and we want to hear from you. If you have feedback, please leave a comment below or in our MSDN Forums. You can also send general feedback using Send-a-Smile in Visual Studio, or vote on feature requests on UserVoice.
0 comments