Update: this blog post has been updated for Visual Studio 2013 Update 3 – enjoy!
If you attended our Build conference or watched some of the videos, you may have seen some of the new profiling tools and our Performance and Diagnostics hub. This blog post will provide an overview of the hub and the various performance analysis tools that we have built.
Since we released Visual Studio 2012 we have added new profiling tools to Visual Studio while improving the overall user experience with the introduction of the Performance and Diagnostics hub.
Why introduce a Performance and Diagnostics hub
We have been continually building new capabilities into the Visual Studio Profiler, including some great tools in this release that will make it easy for you to build fast and efficient apps. As we added new tools we found that our previous menu items and wizards were not suitable to the variety of languages, application types, and platforms that the profiler now supports.
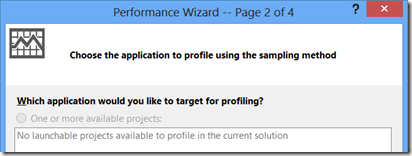
In Visual Studio 2012, you have to use different menu options and wizards depending on the platform and app type you want to profile. In some cases, including launching of the Performance Wizard, you could be guided towards tools that are not applicable for your project type. For example, if you have a JavaScript Store App project open and launch the Performance Wizard, you can select CPU Sampling only to find out in the next screen that it is not applicable to store apps.
The Performance Wizard tells you a performance tool cannot be used after you have already selected it
Instead of choosing CPU sampling, you could have instead chosen Instrumentation profiling and the wizard would have worked fine. If you had launched the performance wizard, you may also not have noticed the new JavaScript Memory and HTML UI Responsiveness tools that were added in Update 1 and Update 2!
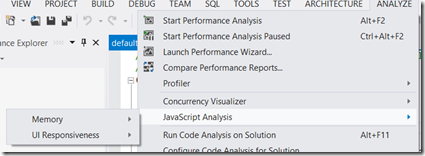
JavaScript Analysis was a separate menu item in Visual Studio 2012 Update 1 and 2
Also note how even though JavaScript Analysis only applies to JavaScript projects, these new menu items are now there regardless of what project type you have, and hence add to visual noise.
As you can see from this cursory overview, figuring out which profiling tools are available and launching those tools was becoming less straight forward in Visual Studio as we continued to add more capabilities into the profiler. So we introduced the Performance and Diagnostics hub to address that – keep on reading!
One launch point for all of your profiling tools
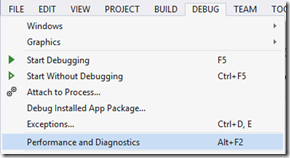
In Visual Studio 2013 we have simplified the experience of finding and launching performance tools by introducing a single starting place for all of your profiling tools. We call this new starting place the Performance and Diagnostics hub, and it is opened by clicking on “Performance and Diagnostics” from the Debug or Analyze menu.
Launching the Performance and Diagnostics hub from the Debug Menu
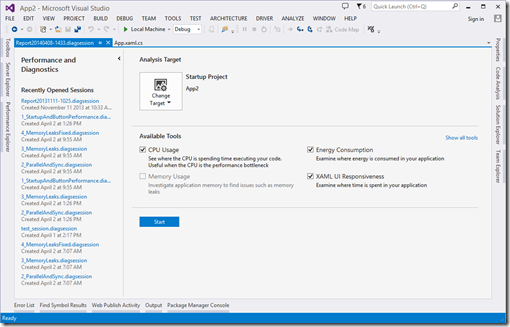
After you click on this you will be brought to the Performance and Diagnostics hub where you can select your profiling target and choose from a set of available tools. A screenshot of the hub when a C#/XAML Windows Store app project is open is shown below.
The Performance and Diagnostics hub when a C#/XAML application is opened
Since we have the target and available tools on the same screen, we are able to show you the tools that apply to your profiling target. Some of the tools can be combined, allowing you to check more than one box at a time. This design takes the guess work out of choosing which profiling tools are applicable. We also show you a list of recently opened profiling sessions on the left side of the hub so that you can easily get back to data that you collected previously. Next let’s see what the possible Analysis Targets are.
Analysis Targets
By default the target application will be your startup project. You can also change the profiling target to an already installed or running app, even when there is no solution loaded in Visual Studio!
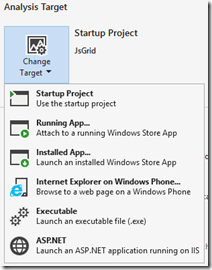
Changing your analysis target in the Performance and Diagnostics hub
The full set of targets currently available in the hub are:
- Startup Project. Use this target if you want to launch and profile the debug startup project for the currently loaded solution in Visual Studio. If you want to profile a project that is different than the current startup project, you can change the startup project in Solution Explorer and then reselect the startup project target in the hub.
- **Running App. **Use this target if you want to profile an already running Windows Store app. An app picker will be displayed to allow you to pick an app from a list of running apps on your local or remote machine.
- **Installed App. **Use this target if you want to launch and profile a Windows Store app that is installed on your system. An app picker will be displayed to allow you to pick an app from a list of installed apps on your local or remote machine.****
- **Internet Explorer on Windows Phone. **Use this target if you want to launch and profile a website in Internet Explorer on a Windows Phone. A dialog will be displayed to allow you to pick a device and provide a URL to navigate to.
- **Executable. **Use this target if you want to launch and profile an executable file (.exe). ****
- **ASP.NET. **This will allow you to launch and profile an ASP.NET application which is running on a local IIS instance.****
As mentioned previously, the list of tools available will automatically update as you change your profiling target. If you want to profile an app on a remote machine, you will need to set up remote debugging on the remote machine and then choose “Remote Machine” from the running or installed app picker.
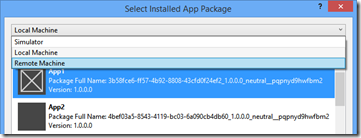
Selecting a Remote Machine from the installed app picker
Next, let’s explore what the available tools are.
New and Improved Profiling Tools
In this release we have not only moved our existing profiling tools into the hub, but also added some new ones along the way! Among the various profiling targets, you will see the following tools available in Visual Studio 2013:
- **JavaScript Memory. **First introduced in Visual Studio 2012 Update 1, this tool helps you understand memory usage and find memory leaks in JavaScript Windows Store apps. For more information, be sure to check out JavaScript memory analysis for Windows Store apps in Visual Studio 2012.
- HTML UI Responsiveness. First introduced in Visual Studio 2012 Update 2, this tool helps you isolate UI responsiveness problems in JavaScript Windows Store apps by providing rich visualizations of work being done on the UI thread. For more information, be sure to check out HTML UI Responsiveness tool in Visual Studio 2013.
- XAML UI Responsiveness. New in Visual Studio 2013, this tool helps you understand UI responsiveness problems in C#/XAML and C++/XAML Windows Store apps by providing rich visualizations of work being done on the UI thread. For more information, be sure to check out XAML UI Responsiveness tool in Visual Studio 2013.
- Energy Consumption. New in Visual Studio 2013, this tool enables you to estimate your app’s energy consumption without the need for any specialized hardware. For more information, be sure to check out Energy Consumption tool in Visual Studio 2013.
- **CPU Usage. **New in Visual Studio 2013 Update 2, this tool lets you see which of your C#, VB, C++, or JavaScript functions are using the CPU the most. For more information check out CPU Usage tool.
- **Memory Usage. **New in Visual Studio 2013 Update 2, this tool allows you to monitor memory usage of your Windows Store app and take snapshots of your C#, VB, and C++ memory so that you can inspect the contents of the heap and find memory leaks. For more information check out Memory Usage tool.
Many of the tools listed above can be combined by checking more than one box before you click Start so that you can cross-correlate data and diagnose performance issues more effectively. Additionally, the following tools which existed in VS 2012 are also available from the hub:
- **JavaScript Function Timing. **This tool uses instrumentation to collect detailed timing information about JavaScript function calls.****
- **Performance Wizard. **We offer the Performance Wizard for profiling of desktop and server apps such as executables and ASP.NET applications. Over time we will integrate the features of the performance wizard more deeply into the hub.
When you are happy with your choice of target and profiling tools, you can simply hit “Start” to start a profiling session.
A peek behind the scenes
As you may have noticed, we have added many new features and new profiling tools! We have been able to add these tools so quickly through collaboration across many teams within Microsoft that reuse a common set of services and UI capabilities that our team builds. This includes the hub launch page with target and tool selection services that allow tools to work with various application types. We also provide underlying services such as persisting diagnostics files, ETW data collection and parsing, symbol resolution, and communication with remote machines.
If you use the F12 developer tools, you will notice that the UI Responsiveness and Memory tools in F12 are the same as the HTML UI Responsiveness and JavaScript Memory tools in the hub. Using the latest version of the F12 developer tools and Visual Studio 2013 Update 3 you can even export data from the tools in F12 and continue your analysis in Visual Studio by opening the generated .diagsession file. The hub components are also being used by Visual Studio Graphics Diagnostics in Visual Studio 2013 Update 3 to provide views similar to the CPU Usage and Memory Usage tools.
These common services will allow us to continuously deliver great new profiling tools and someday we may open this up to external tools developers – let us know if you have a tool you’d like to see in the Performance and Diagnostics hub.
Other Resources and Feedback
Beyond the links I shared above, for a recorded walkthroughs be sure to check out some of the following videos:
- “Performance and Diagnostics Hub” on Channel 9
- Build 2013 session: “Diagnosing Issues in JavaScript Windows Store Apps with Visual Studio 2013”
- Build 2013 session: “Developing High Performance Websites and Modern Apps with JavaScript Performance Tools”
- Build 2013 session: “Visual Studio 2013 Diagnostics Tools for XAML-Based Windows Store Apps”
- Build 2014 session: “Diagnosing Issues in Windows Phone 8.1 XAML Apps Using Visual Studio 2013”
- Build 2014 session: “Diagnosing Issues in Windows Phone 8.1 JavaScript Apps Using Visual Studio”
We are very excited about how these tools will help you build better applications with Visual Studio, and we will continue to deliver new profiling tools while improving existing ones. We encourage you to try out these tools, and send your questions and feedback to us on the Visual Studio Diagnostics forum, on UserVoice, and Send a smile/frown.

0 comments