Background and Problem Definition
In today’s fast-moving world, having access to up-to-date business metrics is key to making data-driven customer-centric decisions. With over 1000 daily flights servicing more than 100 cities and 42 million customers per year, JetBlue has a lot of data to crunch, answering questions such as: What is the utilization of a given route? What is the projected load of a flight? How many flights were on-time? What is the idle time of each plane model at a given airport? To provide decision-makers answers to these and other inquiries in a timely fashion, JetBlue partnered with Microsoft to develop a flexible and extensible reporting solution based on Apache Spark and Azure Databricks.
A key data source for JetBlue is a recurring batch file which lists all customer bookings created or changed during the last batch period. For example, a batch file on January 10 may include a newly created future booking for February 2, an upgrade to a reservation for a flight on March 5, or a listing of customers who flew on all flights on January 10. To keep business metrics fresh, each batch file must result in the re-computation of the metrics for each day listed in the file. This poses an interesting scaling challenge for the Spark job computing the metrics: how do we keep the metrics production code simple and readable while still being able to re-process metrics for hundreds of days in a timely fashion?
The remainder of this article will walk through various scaling techniques for dealing with scenarios that require large numbers of Spark jobs to be run on Azure Databricks and present solutions that were able to reduce processing times by over 60% compared to our initial solution.
Developing a Solution
At the outset of the project, we had two key solution constraints: time and simplicity. First, to aid with maintainability and onboarding, all Spark code should be simple and easily understandable even to novices in the technology. Second, to keep business metrics relevant for JetBlue decision-makers, all re-computations should terminate within a few minutes. These two constraints were immediately at odds: a natural way to scale jobs in Spark is to leverage partitioning and operate on larger batches of data in one go; however, this complicates code understanding and performance tuning since developers must be familiar with partitioning, balancing data across partitions, etc. To keep the code as straightforward as possible, we therefore wanted to implement the business metrics Spark jobs in a direct and easy-to-follow way, and to have a single parameterized Spark job that computes the metrics for a given booking day.
Cluster Size and Spark Job Processing Time
After implementing the business metrics Spark job with JetBlue, we immediately faced a scaling concern. For many Spark jobs, including JetBlue’s, there is a ceiling on the speed-ups that can be gained by simply adding more workers to the Spark cluster: past a certain point, adding more workers won’t significantly decrease processing times. This is due to added communication overheads or simply because there is not enough natural partitioning in the data to enable efficient distributed processing.
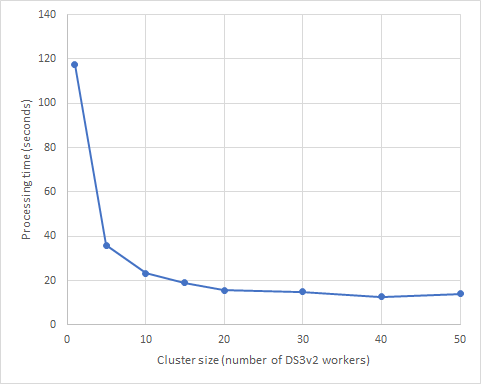
Figure 1 below demonstrates the aforementioned cluster-size related Spark scaling limit with the example of a simple word-count job. The code for the job can be found in the Resources section below. The graph clearly shows that we encounter diminishing returns after adding only 5 machines to the cluster; and past a cluster size of 15 machines, adding more machines to the cluster won’t speed up the job.
After using cluster size to scale JetBlue’s business metrics Spark job, we came to an unfortunate realization. It would take several hours to re-process the daily metrics. This was unacceptable.

Figure 1: Processing time versus cluster size of a simple word-count Spark job. We note that past a specific cluster size, adding more machines to a job doesn’t speed up the runtime anymore.
Parallel Execution of Spark Jobs on Azure Databricks
We noticed that JetBlue’s business metrics Spark job is highly parallelizable: each day can be processed completely independently. However, using separate Databricks clusters to run JetBlue’s business metrics Spark job on days in parallel was not desirable – having to deploy and monitor code in multiple execution environments would result in a large operational and tooling burden. We therefore reformulated the problem as such: was there a way in which we could run JetBlue’s jobs in parallel on the same cluster?
The Driver Notebook Pattern in Azure Databricks
Azure Databricks offers a mechanism to run sub-jobs from within a job via the dbutils.notebook.run API. A simple usage of the API is as follows:
// define some way to generate a sequence of workloads to run
val jobArguments = ???

// define the name of the Azure Databricks notebook to run
val notebookToRun = ???

// start the jobs
jobArguments.foreach(args =>
  dbutils.notebook.run(notebookToRun, timeoutSeconds = 0, args))
Using the dbutils.notebooks.run API, we were able to keep JetBlue’s main business metrics Spark job simple: the job only needs to concern itself with processing the metrics for a single day. We then created a separate “driver” Spark job that manages the complexity of running the metrics job for all the requisite days. In this way we were able to hide the complexity of scheduling for performance from the business logic. This fulfilled our code simplicity goal with JetBlue.
Using Scala Parallel Collections to Run Parallel Spark Jobs
Upon further investigation, we learned that the run method is a blocking call. This essentially means that the implementation is equivalent to running all the jobs in sequence, thus leading back to the previously experienced performance concerns. To achieve parallelism for JetBlue’s workload, we next attempted to leverage Scala’s parallel collections to launch the jobs:
// define some way to generate a sequence of workloads to run
val jobArguments = ???

// define the name of the Azure Databricks notebook to run
val notebookToRun = ???

// look up required context for parallel run calls
val context = dbutils.notebook.getContext()

jobArguments.par.foreach(args => {
  // ensure thread knows about databricks context
  dbutils.notebook.setContext(context)
  // start the job
  dbutils.notebook.run(notebookToRun, timeoutSeconds = 0, args)
})
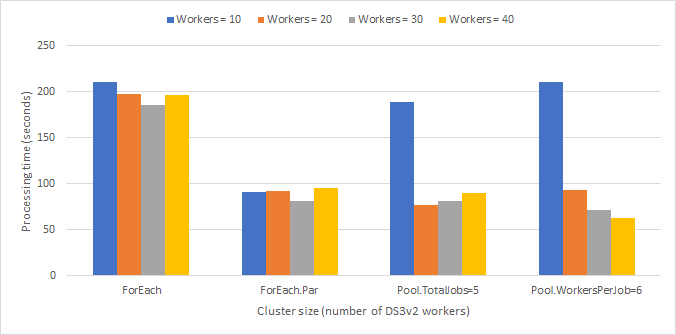
Figure 3 at the end of this section shows that the parallel collections approach does offer some performance benefits over running the workloads in sequence. However, we discovered that there are two factors limiting the parallelism of this implementation.
First, Scala parallel collections will, by default, only use as many threads as there are cores available on the Spark driver machine. This means that if we use a cluster of DS3v2 nodes (each with 4 cores) the snippet above will launch at most 4 jobs in parallel. This is undesirable given that the calls are IO-bound instead of CPU-bound and we could thus be supporting many more parallel run invocations.
Additionally, while the code above does launch Spark jobs in parallel, the Spark scheduler may not actually execute the jobs in parallel. This is because Spark uses a first-in-first-out scheduling strategy by default. The Spark scheduler may attempt to parallelize some tasks if there is spare CPU capacity available in the cluster, but this behavior may not optimally utilize the cluster.
Optimally Using Cluster Resources for Parallel Jobs Via Spark Fair Scheduler Pools
To further improve the runtime of JetBlue’s parallel workloads, we leveraged the fact that at the time of writing with runtime 5.0, Azure Databricks is enabled to make use of Spark fair scheduling pools. Fair scheduling in Spark means that we can define multiple separate resource pools in the cluster which are all available for executing jobs independently. This enabled us to develop the following mechanism to guarantee that Azure Databricks will always execute some configured number of separate notebook-runs in parallel:
// define some way to generate a sequence of workloads to run
val jobArguments = ???

// define the name of the Azure Databricks notebook to run
val notebookToRun = ???

// define maximum number of jobs to run in parallel
val totalJobs = ???

import java.util.concurrent.Executors
import scala.concurrent.{Await, ExecutionContext, Future}
import scala.concurrent.duration.Duration

// look up required context for parallel run calls
val context = dbutils.notebook.getContext()

// create threadpool for parallel runs
implicit val executionContext = ExecutionContext.fromExecutorService(
  Executors.newFixedThreadPool(totalJobs))

try {
  val futures = jobArguments.zipWithIndex.map { case (args, i) =>
    Future({
      // ensure thread knows about databricks context
      dbutils.notebook.setContext(context)

      // define up to maxJobs separate scheduler pools
      sc.setLocalProperty("spark.scheduler.pool", s"pool${i % totalJobs}")

      // start the job in the scheduler pool
      dbutils.notebook.run(notebookToRun, timeoutSeconds = 0, args)
    })}

  // wait for all the jobs to finish processing
  Await.result(Future.sequence(futures), atMost = Duration.Inf)
} finally {
  // ensure to clean up the threadpool
  executionContext.shutdownNow()
}
The code above is somewhat more involved than the parallel collections approach but offers two key benefits. Firstly, the use of a dedicated threadpool guarantees that there are always the configured number of jobs executing in parallel regardless of the number of cores on the Spark driver machine. Additionally, by setting explicit Spark fair scheduling pools for each of the invoked jobs, we were able to guarantee that Spark will truly run the notebooks in parallel on equally sized slices of the cluster.
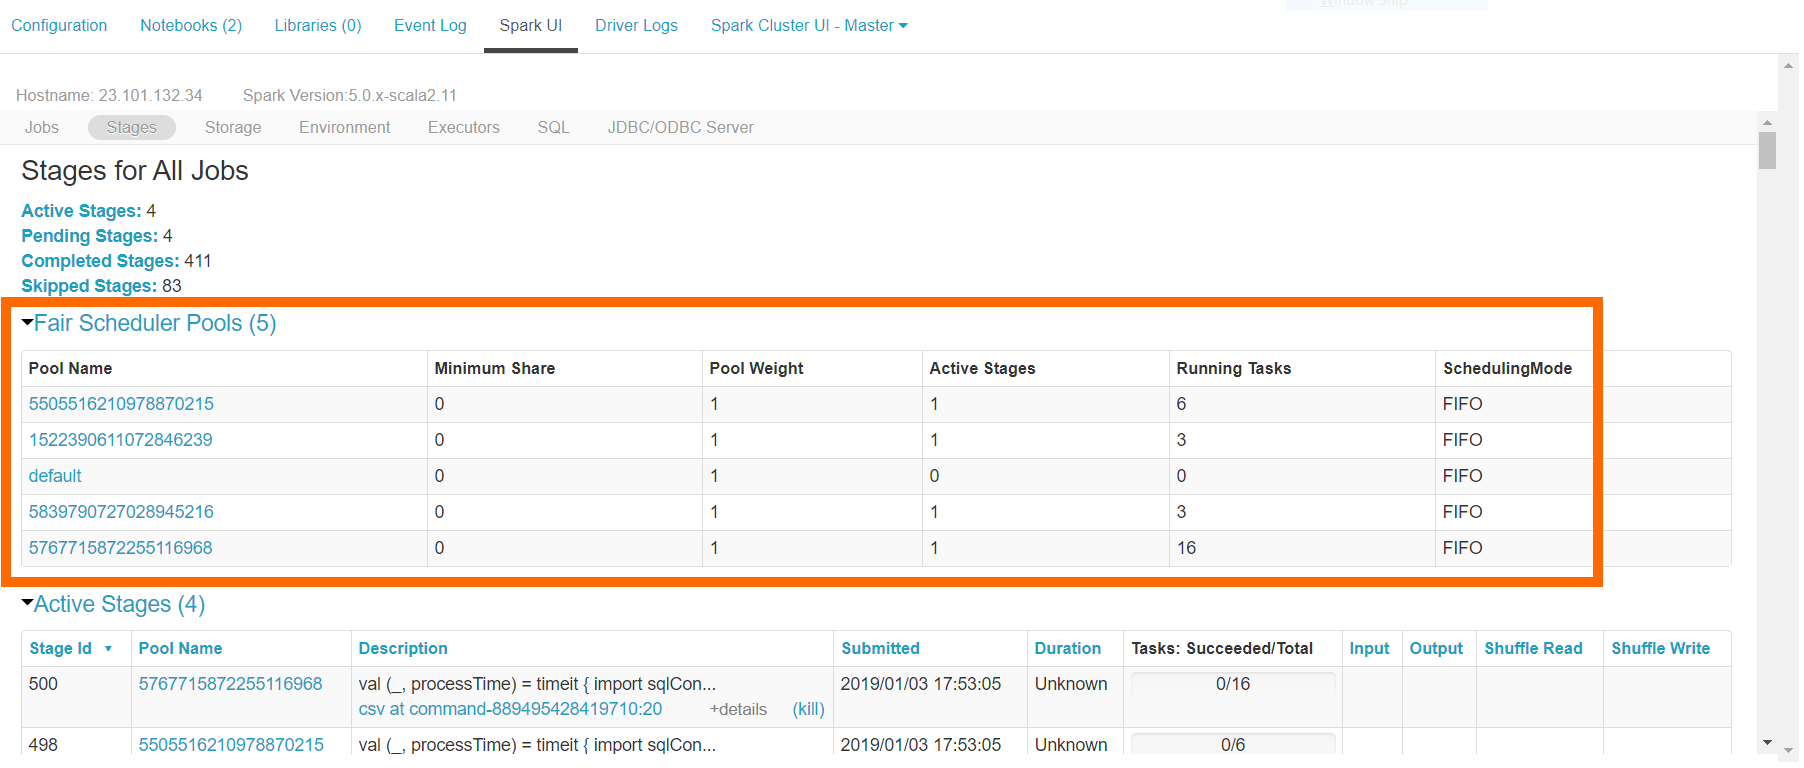
Using the code above, if we were to create a cluster with 40 workers and set the number of parallel jobs to 4, then each individual job will utilize 10 workers in the cluster. If implemented correctly, the stages tab in the cluster’s Spark UI will look similar to Figure 2 below, which shows that there are 4 concurrently executing sets of Spark tasks on separate scheduler pools in the cluster.

As shown in Figure 3 below, the fair scheduler approach provided great performance improvements. However, determining the optimal number of jobs to run for a given workload whenever the cluster size changed would have been a non-trivial time overhead for JetBlue. Instead, we ran a benchmark similar to Figure 1 to determine the inflection point after which adding more workers to our Spark job didn’t improve the processing time anymore. We then were able to use this information to dynamically compute the best number of jobs to run in parallel on our cluster:
// define the number of workers per job
val workersPerJob = ???

// look up the number of workers in the cluster
val workersAvailable = sc.getExecutorMemoryStatus.size

// determine number of jobs we can run each with the desired worker count
val totalJobs = workersAvailable / workersPerJob
This approach worked well for JetBlue since we noticed that all the individual Spark jobs were roughly uniform in processing time and so distributing them evenly among the cluster would lead to optimal performance.
Figure 3 below shows a comparison of the various Spark parallelism approaches described throughout this section. We can see that by using a threadpool, Spark fair scheduler pools, and automatic determination of the number of jobs to run on the cluster, we managed to reduce the runtime to one-third of what it was when running all jobs sequentially on one large cluster.

Figure 3: Comparison of Spark parallelism techniques. Note that using an approach based on fair scheduler pools enables us to more effectively leverage larger clusters for parallel workloads.
Limitations of Parallel Spark Notebook Tasks
Note that all code included in the sections above makes use of the dbutils.notebook.run API in Azure Databricks. At the time of writing with the dbutils API at jar version dbutils-api 0.0.3, the code only works when run in the context of an Azure Databricks notebook and will fail to compile if included in a class library jar attached to the cluster.
The best performing approaches described in the previous section require Spark fair scheduler pools to be enabled on your cluster. You can double check that this is the case by executing the following snippet:
// must return "FAIR"
spark.conf.get("spark.scheduler.mode")
Furthermore, note that while the approaches described in this article do make it easy to accelerate Spark workloads on larger cluster sizes by leveraging parallelism, it remains important to keep in mind that for some applications the gains in processing speed may not be worth the increases in cost resulting from the use of larger cluster sizes. The techniques outlined in this article provide us with a tool to trade-off larger cluster sizes for shorter processing times and it’s up to each specific use-case to determine the optimal balance between urgency and cost. Additionally, we must also realize that the speedups resulting from the techniques are not unbounded. For instance, if a Spark jobs read from an external storage – such as a database or cloud object storage system via HDFS – eventually the number of concurrent machines reading from the storage may exceed the configured throughput on the external system. This will lead to the jobs slowing down in aggregate.
Conclusions and Next Steps
In this article, we presented an approach to run multiple Spark jobs in parallel on an Azure Databricks cluster by leveraging threadpools and Spark fair scheduler pools. This enabled us to reduce the time to compute JetBlue’s business metrics threefold. The approach described in the article can be leveraged to run any notebooks-based workload in parallel on Azure Databricks. We welcome you to give the technique a try and let us know your results in the comments below!
Resources
- Parallel notebook workloads benchmark code and raw results
- Github gist for the parallel Spark jobs recipe described in this article
- Detailed information on Spark fair scheduler pools
- More information about Databricks notebook workflows
- Getting started with Azure Databricks
