The July 2020 update of the Visual Studio Code C++ extension is now available. This latest release offers brand new features, such as the visualization of Doxygen comments and support for Logpoints while debugging (GDB/LLDB), along with a bunch of enhancements and bug fixes. To find out more about all the changes, check out our release notes on GitHub.
Displaying Doxygen Comments
Doxygen is a programming tool that generates documentation for source code. You can annotate your code with comments that contain helpful tips about functions, then Doxygen will generate documentation from these comments.
With the July 2020 update, Visual Studio Code supports the visualization of Doxygen comments when hovering over a function and while typing.
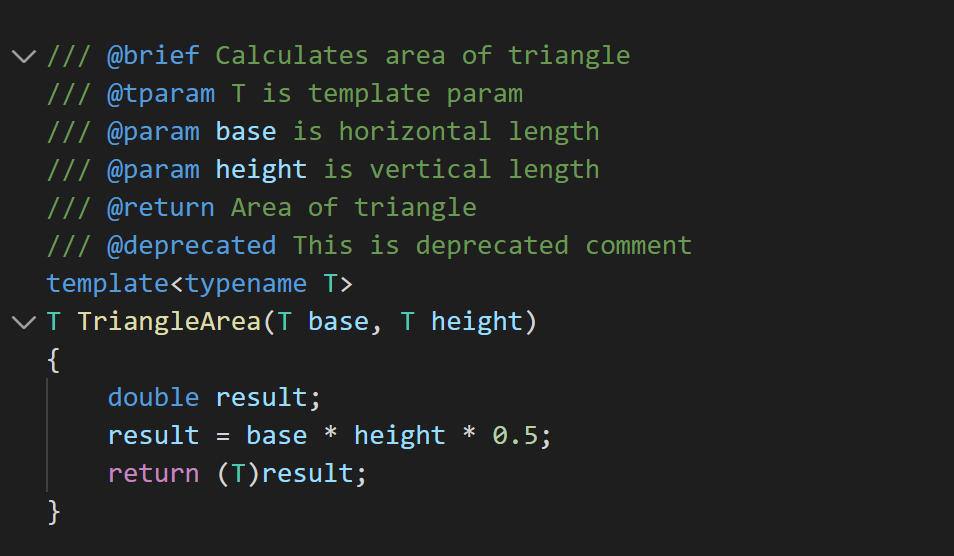
For example, if you have the following Doxygen comment above your TriangleArea function declaration:

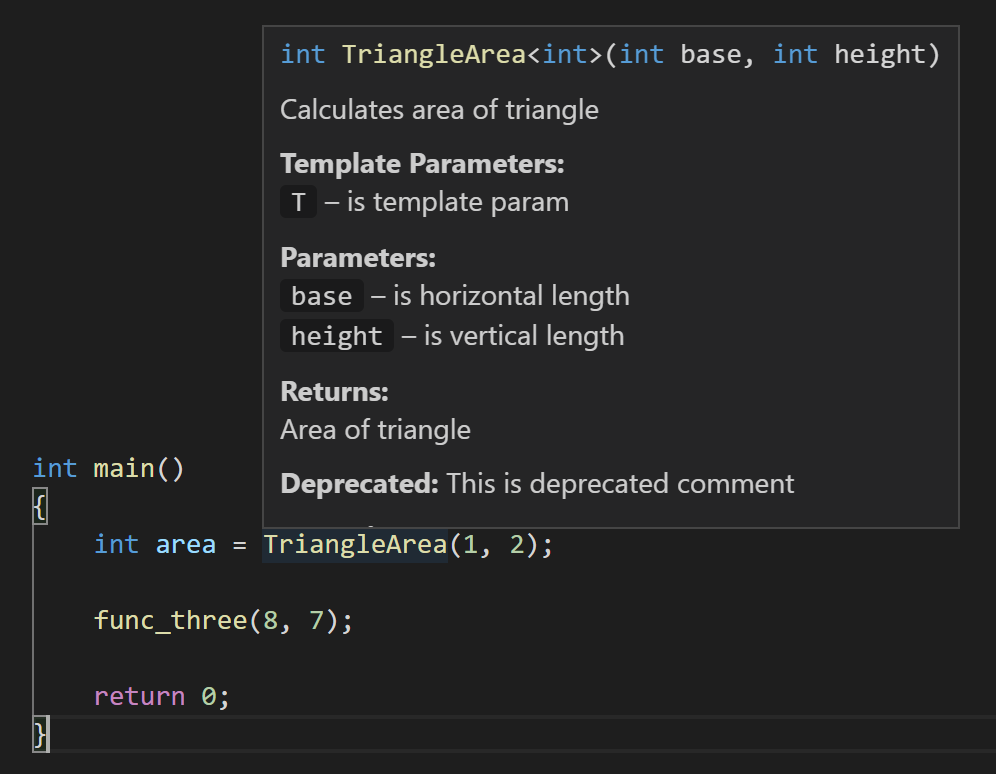
Then when you hover over TriangleArea in your code, you’ll see the corresponding documentation:

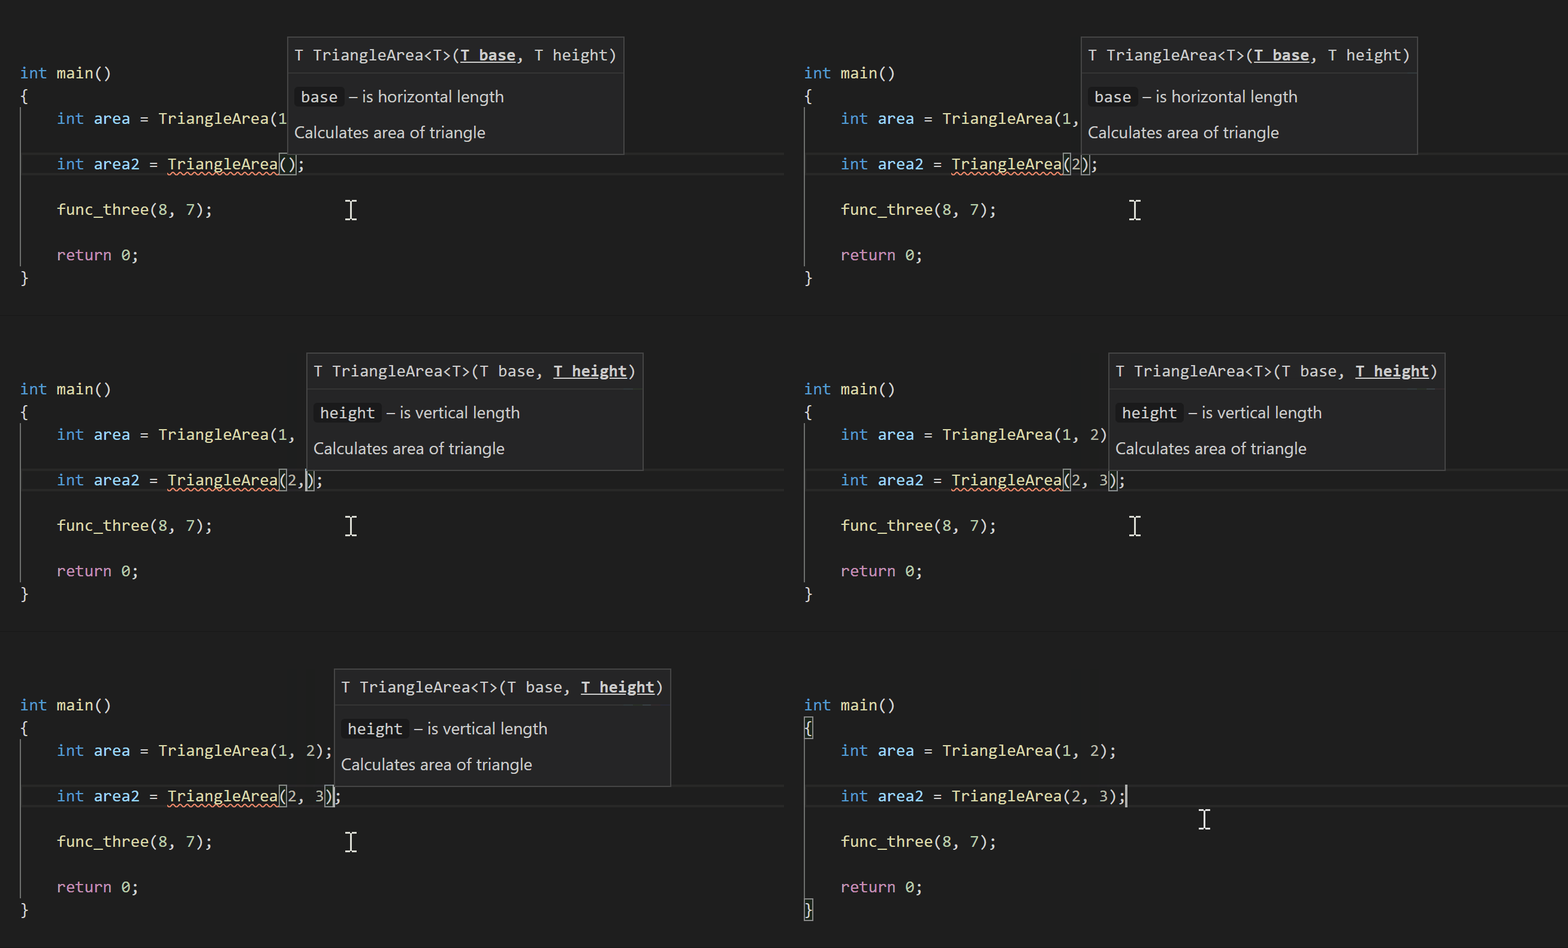
You’ll also see documentation while typing, such as when you’re calling a function. If you call TriangleArea, for example, the following documentation will pop up with information about its parameters:

Logpoints
If you’ve ever used print statements to debug your code, Logpoints will make your life a whole lot easier. Logpoints (also known as Tracepoints in Visual Studio) allow you to add on-demand logging statements into your application. When your program hits a Logpoint, it will print its contents to the debug console and continue running; it doesn’t stop executing as it would for a breakpoint. Logpoints are like breakpoints, though, in the sense that they are not part of the source code. No clean up necessary!
With the July 2020 update, the C++ extension now supports Logpoints for GDB and LLDB. To add a Logpoint, right click in the far-left margin next to a line of code. Then select Add Logpoint and type the message you want to log. Any expression between curly braces (‘{‘ and ‘}’) will be evaluated when the Logpoint hits.
You can also print the following $TOKENS in Logpoint messages:
$ADDRESS Current instruction
$CALLER Calling function name
$CALLSTACK Call stack
$FUNCTION Current function name
$PNAME Process name
$TID Thread ID
$TNAME Thread name
$TICK Tick count (from Windows GetTickCount)
Additional enhancements
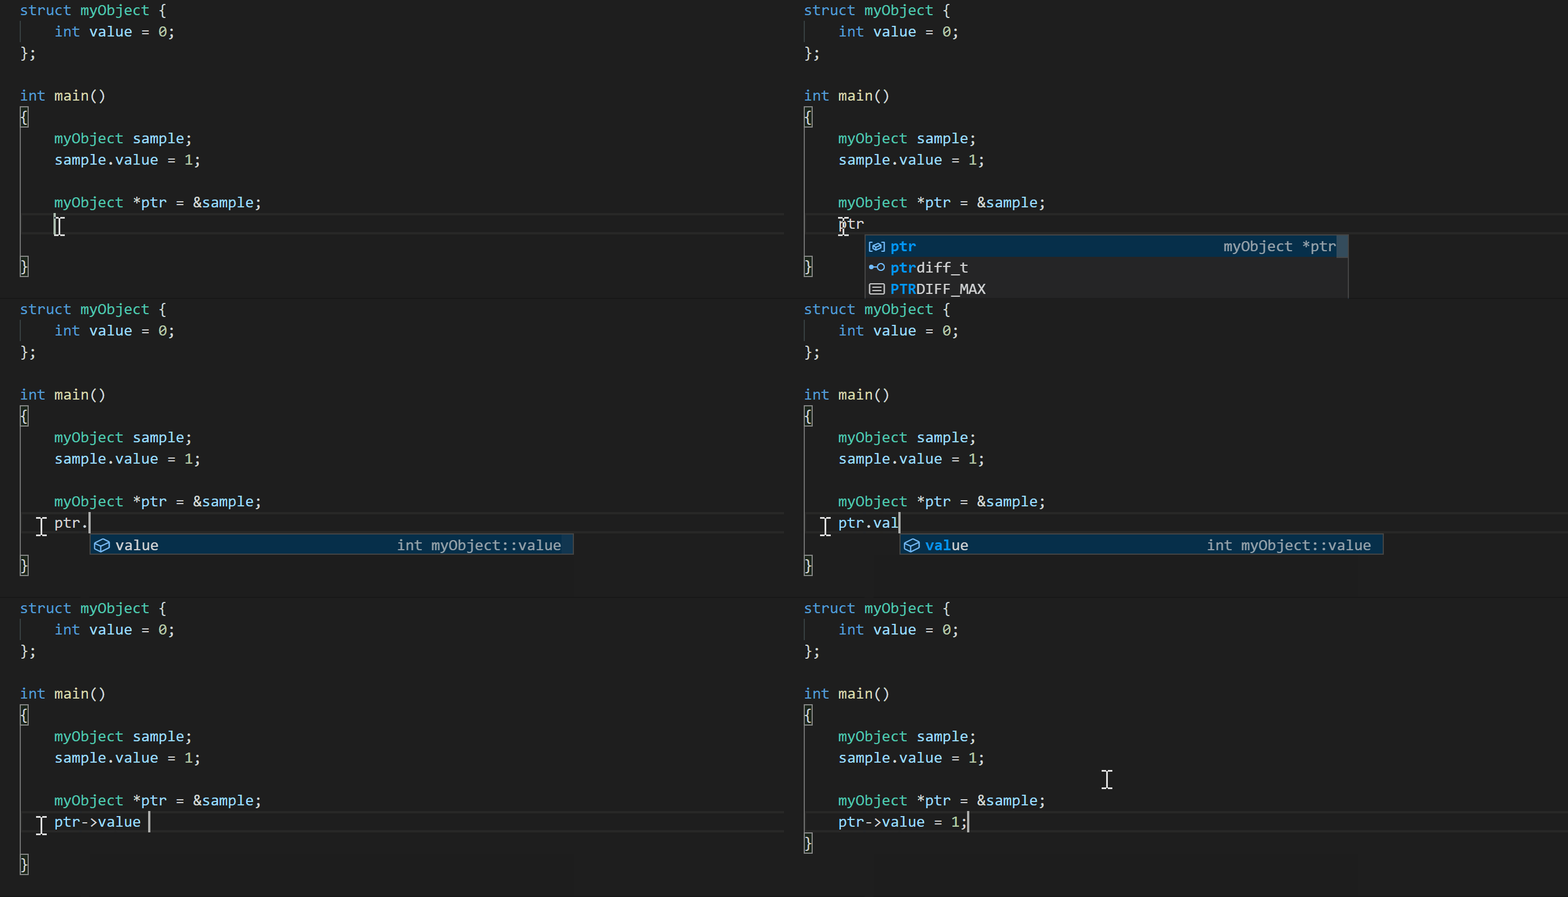
Another enhancement with the July 2020 update is if you use a member selection operator on a pointer type, the C++ extension now shows suggestions for corresponding members and automatically converts ‘.’ to ‘->’ (#862).

What do you think?
Download the C++ extension for Visual Studio Code today, give it a try, and let us know what you think. If you run into any issues, or have any suggestions, please report them in the Issues section of our GitHub repository. You can also join our Insiders program and get access to early builds of our release by going to File > Preferences > Settings and under Extensions > C/C++, change the “C_Cpp: Update Channel” to “Insiders”.
We can be reached via the comments below or in email at visualcpp@microsoft.com. You can also find our team on Twitter at @VisualC.


My launch settings use `cppvsdbg` any idea when Logpoints will be supported there?
{
“name”: “Chromium”,
“type”: “cppvsdbg”,
“request”: “launch”,
“targetArchitecture”: “x64”,
“program”: “${workspaceRoot}/out/debug_x64/chrome”,
“args”: [],
“preLaunchTask”: “build_chrome_debug”,
“stopAtEntry”: false,
“cwd”: “${workspaceRoot}/out/debug_x64/”,
“environment”: [],
“externalConsole”: true
},
What I would prefer is for VSCode to have a macro that would automatically populate the function comment header with the doxygen markup based on what is known from the function signature. That way the programmer just needs to augment the comment with further explanation rather than waste time with boilerplate. This would likely encourage more useful doxygen content.
Hi Rennie! Thanks for the feedback. We have an open issue on our GitHub repo tracking this ask, please give it an up-vote to help us prioritize it: Feature request – Doxygen stub generation #5683
Doxygen Documentation Generator may be what you’re looking for.