For this blog post, we welcome Alex Baude of Marmalade (https://www.madewithmarmalade.com) as a guest author on our blog. His team’s most recent release of Marmalade Platform now supports Visual Studio 2015 and we invited him to tell us more about their work on this.
Visual Studio 2015 provides new cross-platform native development technology for building and debugging cross-platform C++ code on the Android platform. Out-of-the-box, Visual Studio 2015 offers templates based on the Android Native-Activity to quickly create high-performance applications.
The Marmalade Platform includes a cross-platform C++ SDK, Marmalade Core, a key feature of which is a platform abstraction API, hiding much of the complexity of the native platforms and allowing the developer to write code once and deploy to many targets. C++ based Marmalade Core apps can be deployed to iOS, Android, NaCL, Windows Phone, and Windows 10, to name a few.
And now, with our latest SDK release, by leveraging the new cross-platform features of Visual Studio 2015, native debugging of Marmalade Core apps running on either the Visual Studio Emulator for Android (x86) or an attached Android device (ARM) is possible.
Building a Marmalade Core app using Visual Studio 2015
By default, Marmalade Core projects produce a Visual Studio solution capable of generating an app binary that can be deployed to several target platforms without recompilation. This so-called “single-binary” uses proprietary Marmalade technology and can be used to target iOS from a Windows machine, as well as Android. This type of Visual Studio solution is ideal for generating a binary for distribution or for debugging on the Marmalade Desktop Simulator.
For on-device native debugging, Marmalade Core projects can also generate a special Visual Studio solution that allows for debugging on Windows Phone, Windows 10 and now Android.
Visual Studio 2015 can be launched in Android Native Debug mode either from the command-line or from the Marmalade Hub.
From the command-line, run the following command:
mkb MyProject.mkb –buildenv=VC14 –buildenv-toolset=ANDROIDNATIVE
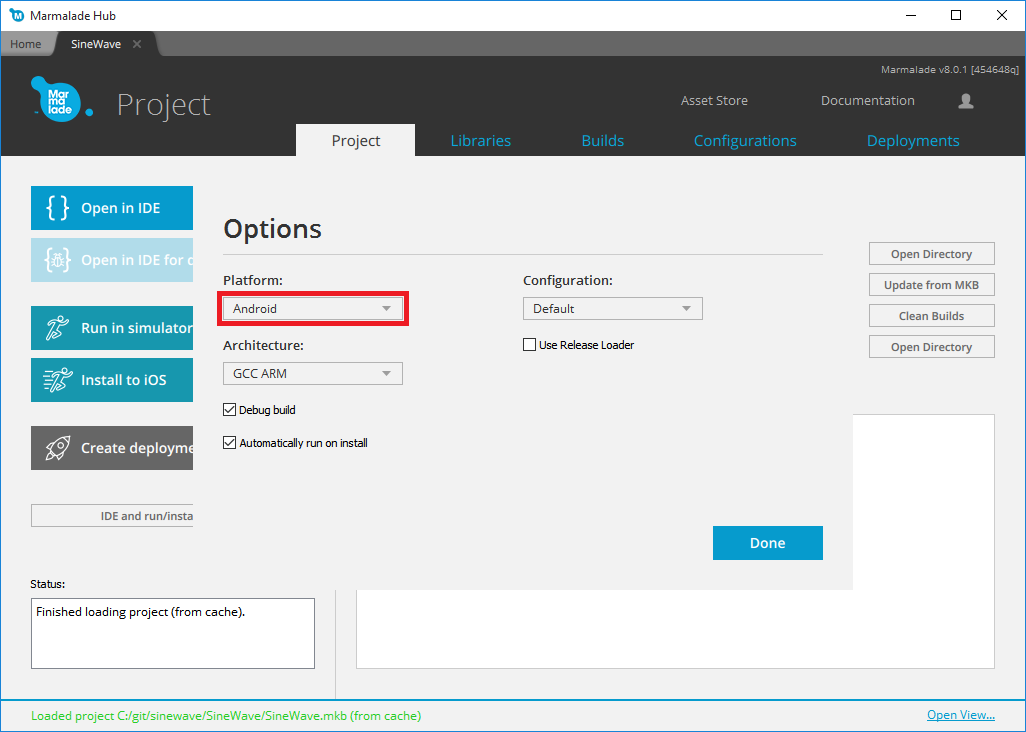
From the Marmalade Hub, select Android as the target platform in the project screen and click the Open in IDE for debugging button as shown below.
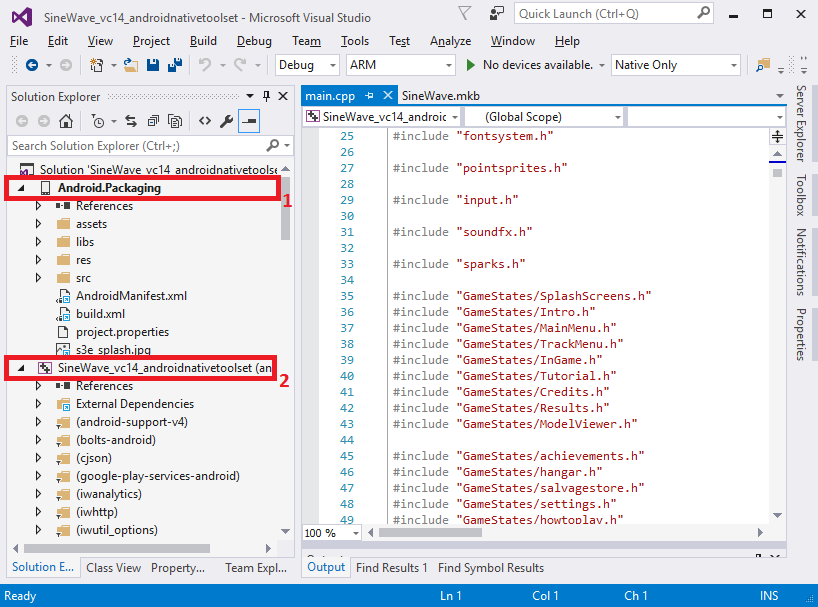
In the Visual Studio IDE you’ll notice that the generated solution consists of two projects as shown below.
Android.Packaging
This project contains the Visual Studio configuration required to package and deploy your app to an Android target.
<app_name>_vc14_androidnativetoolset
This project contains your app’s sources and produces a dynamic library that will be included in the APK created by the Android.Packaging project.
Marmalade’s makefile builder system will automatically populate the project’s C++ and linker settings with the appropriate flags appropriate for a Marmalade Core app. By default, GCC 4.9 is selected to build for ARMv7-a and vfpv3-d16 fpu variant and softfp float ABI.
Once generated, the developer can edit, build and run the app from the IDE, as per usual, with the new Visual Studio 2015 Android specific features such as IntelliSense for code-completion and code-highlighting available.
Debugging a Marmalade Core app using Visual Studio 2015
Debugging a Marmalade Core app is straightforward: simply use the existing Visual Studio debugging capabilities as normal.
For example, hit F5 and the app will be built, packaged then deployed to the connected Android device or the Visual Studio Emulator for Android. The app will then launch automatically with the debugger attached.
To further demonstrate the debugging capabilities of Visual Studio 2015, we will walk through a debug session using a real game, SineWave, made with Marmalade by Mad Fellows Games Studio, available for iOS, Android and Windows. The game is a futuristic on-rails shooter where the music sets the beat for you to time your moves to.
Setting a breakpoint and inspecting local variables
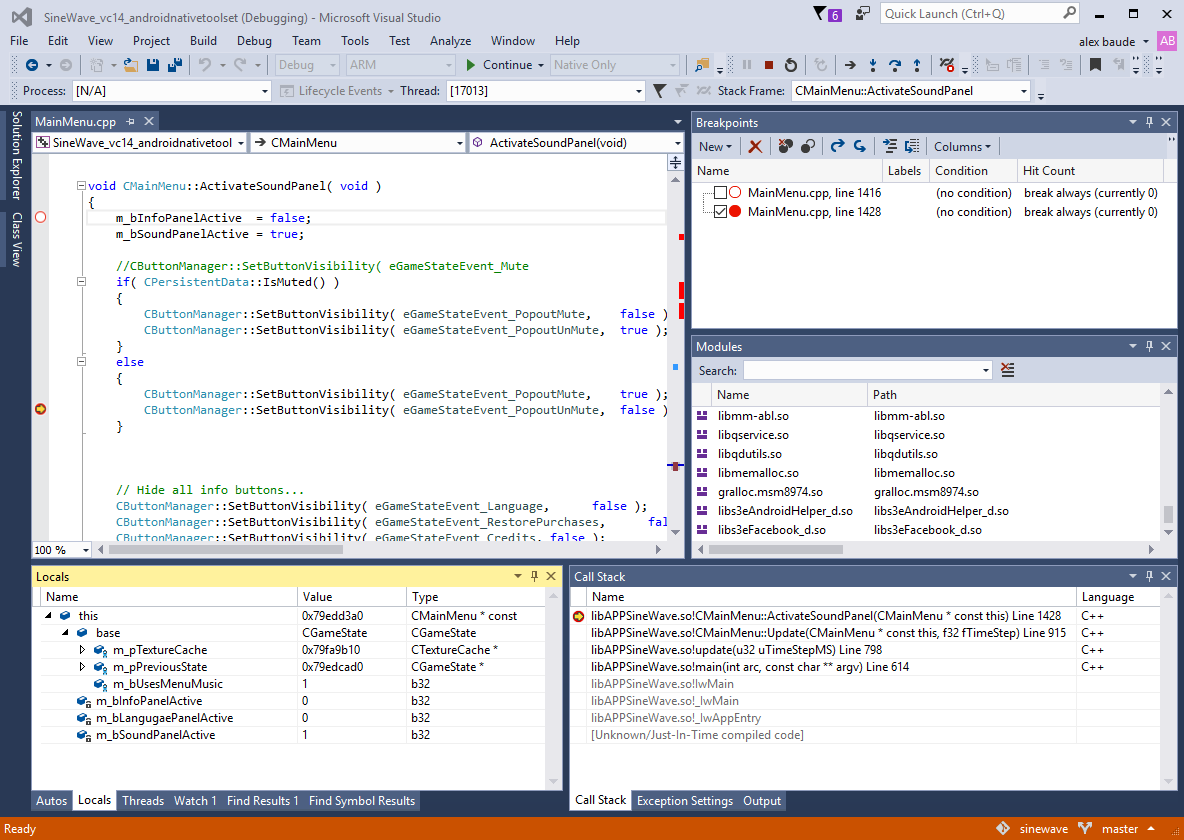
A breakpoint has been set in the callback for the Sound button in the main menu to demonstrate hitting a breakpoint when some user interaction occurs.
In the MainMenu.cpp source window, the yellow arrow shows the current point of execution. When the game is paused you can drag this yellow arrow to another point to skip to that point of execution to bypass a particular code path. The breakpoints can be disabled and enabled in the source window as well as the Breakpoints window.
One of the most useful features is the Call Stack window which provides source file and line numbers for the functions along a code path. Also, in the Locals window, Visual Studio offers quick access to the local variables within the current scope providing the memory address and value of variables. In this example the CMainMenu instance and its member variables.
Stepping through disassembly
It is often necessary to view the disassembly of a particular function particularly if the code has inline assembly. Visual Studio offers this capability for both x86 and ARM as shown below at the same breakpoint:
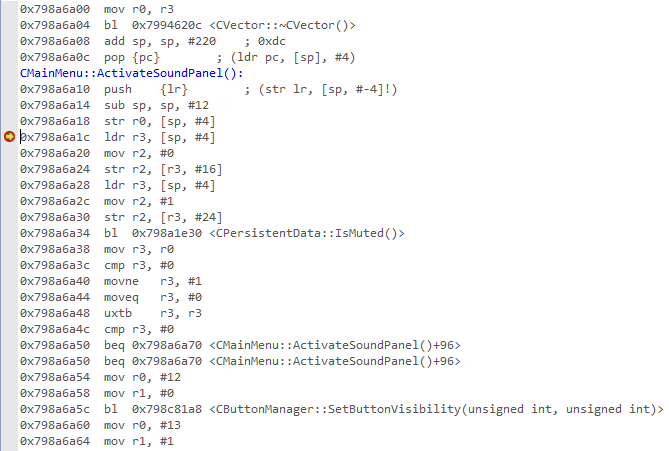 |
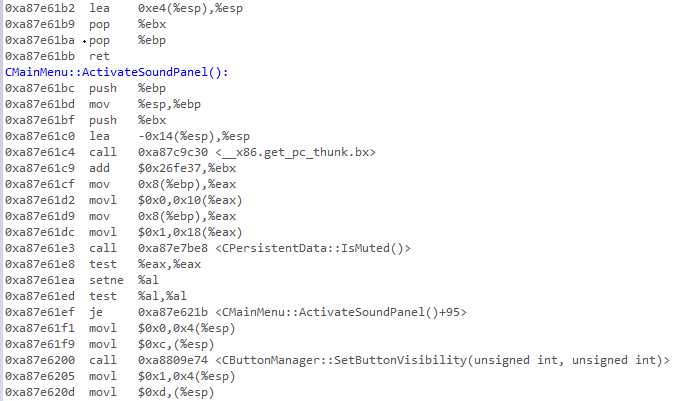 |
Using the Immediate Window
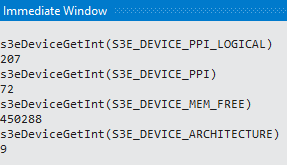
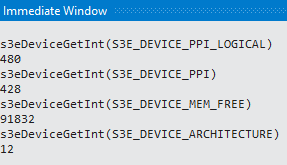
For more control the developer also has access to the Immediate Window from which you can evaluate functions at runtime (on the same thread as the one that hit the breakpoint). This is useful to evaluate things that are dynamic or that vary per device.
Below is an example of Marmalade Core function, s3eDeviceGetInt, being called to retrieve properties such as the PPI, Logical PPI, amount of free memory and the architecture for both ARM device and x86 emulator:
|
x86 Emulator |
ARM device |
Conclusion
Visual Studio 2015’s new capabilities to build and debug native C++ Android apps are fully leveraged by the Marmalade Platform. This allows us to provide our users with a powerful addition to their development toolbox.
The Visual Studio Emulator for Android offers a fast x86 emulator for debugging on a variety of form factors and Android versions with different technical specifications. The ability to also debug on an attached device offers the developer an easy way to deploy and benchmark their games with minimal effort, all from within the Visual Studio IDE.




0 comments