
If you’ve ever profiled an optimized build of a C++ application there is a good chance that you looked at the profiling report and saw some functions missing that you expected to be present so you had to assume that they had been inlined but couldn’t be certain. Likewise, if you’ve ever tried to improve your application’s performance using the Profile Guided Optimization (PGO) feature in Visual Studio, you were likely blind to whether your training data actually had the desired effect.
To help with this, in Visual Studio 2013 we’ve done work to help you understand when the compiler inlines functions and how your PGO training data has translated to the optimized binary. In this post I’ll walk you through how to use the Visual Studio CPU Sampling profiler to understand these two optimizations in your application.
The sample
For the purposes of this post, I’ll be evaluating a very basic application that asks the user for a maximum value, and calculates all prime numbers less than the number provided by the user (sample available here). However, to better represent a large complex application the sample is written as an executable console application that calls a dll containing the logic for calculating the prime numbers.
The main function of the console application appears as
int _tmain(int argc, _TCHAR* argv [])
{
int max;
cout << “Pick a maximum value to compute to: “;
cin >> max;vector<int> primes;
primes = get_primes(max);
cout << primes.size();
return 0;
}
The prime number calculation is written in the following way
vector<int> get_primes(int max)
{
vector<int> primes;
for (int n = 0; n < max; n++)
{
if (is_prime(n)) {
add_prime(n, primes);
}
}
return primes;
}bool is_prime(int n)
{
if (is_base(n))
return false;
if (has_factors(n))
return false;
return true;
}bool is_base(int n)
{
if (n < 2)
return true;
return false;
}bool has_factors(int n)
{
for (int i = 2; i < n; ++i)
{
if (is_factor(n, i))
return true;
}
return false;
}bool is_factor(int n, int i){
if ((n % i) == 0)
return true;
return false;
}void add_prime(int n, vector<int> &primes)
{
primes.push_back(n);
}
Using the profiler
The first thing I am going to do is profile the application to evaluate the performance (for accurate performance results, you should always profile Release builds since Debug builds disable optimizations so things may appear to be a problem in a Debug build that will not be an issue in an optimized build). To do this, I’ll open the new “Performance and Diagnostics” launch page from the Debug menu (Debug -> Performance and Diagnostics). The launch page will direct me to the Performance Wizard.

When the Performance Wizard opens, I just need to press “Finish” to launch my project since I’ll be taking all the default settings.

After the application launches, I’ll input 100K as the number to calculate primes to and let it go. When the report opens, I can see that get_primes is the last frame in my call stack and shows that 100% of the samples are occurring in this function.

So I’m left to speculate that the other functions (e.g. is_prime) were inlined, but I don’t know for certain this is what happened. It is possible that when compiled Release these functions executed fast enough that no samples happened to occur while they were executing.
Understanding compiler inlining
This is where the first functionality improvement for C++ CPU profiling comes in Visual Studio 2013. The C++ compiler has the ability to add the inlining information into the .pdb files during compilation (it is however not on by default since it increases the size of the .pdb). To enable this, navigate to the “Project Properties -> Configuration Properties -> C/C++ -> Command Line” and add “/d2Zi+” to the “Additional Options” field (do this for every project in the solution you want inline information for).
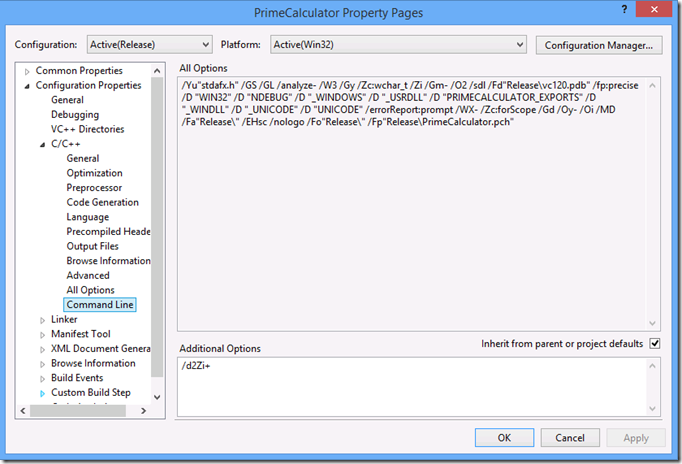
NOTE: /d2Zi+ is not an officially documented flag in the C++ compiler, which means its future support is not guaranteed.
Now, rebuild the application with the Release configuration and profile again. This time when the report opens, navigate to the “Call Tree” view

When this opens, right click in any of the column headers and choose “Add/Remove Columns” near the bottom of the context menu. When the “Add/Remove Columns” dialogue opens, choose the five new columns that begin with “Inlined”

- Inlined Functions: Shows functions that have been inlined into this function
- Inlined Inclusive Samples: Shows the number of samples that occurred when inlined code was executing in the current function or a descendent function
- Inlined Exclusive Samples: Shows the number of samples that occurred when code inlined into this function was executing
- Inlined Inclusive Samples %: Shows the total inlined inclusive samples for this method relative to the total number of inlined samples.
- Inlined Exclusive Samples %: Shows the total samples collected in code inlined into this function relative to the total number of inlined samples.
Now when I expand the hot path, I have a column that shows me functions that have been inlined into get_primes and the sample count information for samples occurring in code that was originally in a separate function.

[For the purposes of the screenshot above I’ve hidden all of the default columns]
Now if I resize the “Inlined Functions” column to make it wider so I can read all of the functions inlined into get_primes, I will see that is_prime, has_factors, and is_factor have all been inlined into get_primes, so I now know this is why they are not appearing anywhere in my report.
Evaluating profile guided optimization
The next new feature I am going to highlight is how to use the CPU sampling profiler to understand how effective your Profiling Guided Optimization (PGO) training is.
When you use PGO, you train the application by running scenarios you believe will be representative of the way that customers will use the application. During training, PGO records what code is executing and how frequently, then during compilation this information is used to help the compiler make more informed decisions about how to optimize the application.
It is important to emphasize here how important the training phase is. If you make a mistake with the training data (e.g. train for a scenario that users rarely do) then you can actually hurt performance for your customers because PGO optimizes functions that the most time is spent executing for speed, and optimizes functions that are executed infrequently or that little time is spent in for size to help make the binary smaller. So if you never exercise an expensive code path during training, PGO is likely to optimize that code for size. If that code turns out to be in a hot path for the user the performance will actually be worse than had you never tried to PGO it.
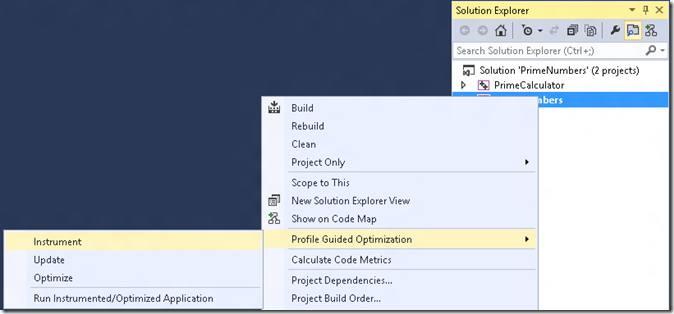
With this in mind, the problem is once you collect training data and optimize the application, how can you know that the training data was collected correctly and is representative of the actual use of the application? To demonstrate how the profiler can help with this, I’m going to instrument the sample application for PGO training by right clicking on the “PrimeNumbers” project, and then choosing “Profile Guided Optimization -> Instrument”
After I instrument, I choose the “Profile Guided Optimization -> Run Instrumented/Optimized Application” to start collecting my training data. Because the instrumented application will run slower than normal, I’m going to input 10K as the limit. Once the application finishes the training run, I go back to the “Profile Guided Optimization” menu and choose “Optimize” to build the optimized binary based on the training data.
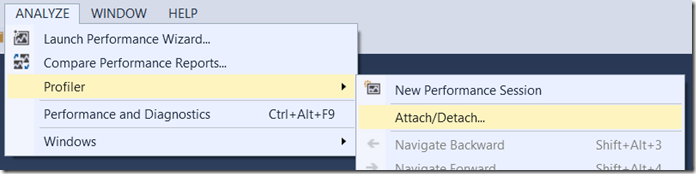
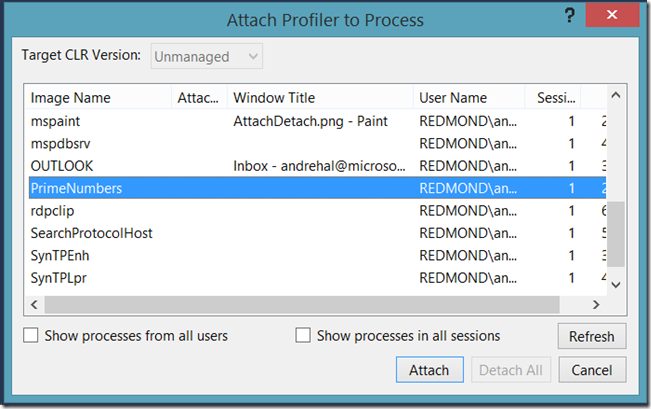
Now that we’ve collected training data and optimized our binary based on it, let’s evaluate how effective the training was at optimizing the application for the hot path. To do this, I’m going to launch the optimized application by right clicking on the PrimeNumbers project, and choosing “Profile Guided Optimization -> Run Instrumented/Optimized Application”. After this launches, I will attach the profiler to it by selecting “Analyze -> Profiler -> Attach/Detach” and selecting PrimeNumbers.exe
[You can alternately launch the project using the profiler, but because PGO is a different type of build than a standard release you will be warned about rebuilding. You need to select “Do not continue with build” or you will lose the optimized build, then choose “Yes” when the profiler displays a message saying the “Build failed, would you like to launch your performance session anyway?”]
I’ll enter 100K again as the number to calculate and when the profiling session ends, I navigate to the Call Tree view, and right click on a column header and choose “Add/Remove Columns…”. This time I select the “Is PGO” and “PGO Type” columns and move them up to be immediately below the module name in the column order.
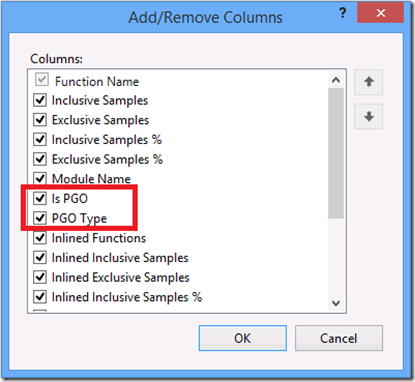
- Is PGO: Specifies whether the function was PGO’d or not
- PGO Type: Specifies whether the function was PGO’d for Speed or Size
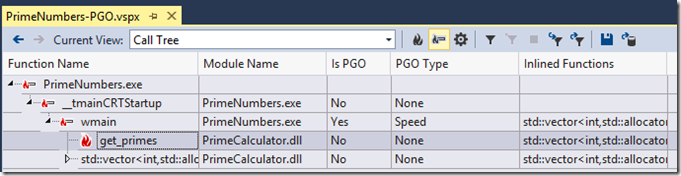
When I expand the hot path, I see that wmain in PrimeNumbers.exe was PGO’d, but neither of the functions in PrimeCalculator were PGO’d. So I can quickly see I failed train PrimeCalculator.dll because I missed instrumenting the .dll before I did the training run. While this is a simple mistake, it illustrates how the profiler can quickly show if your training data was collected correctly.
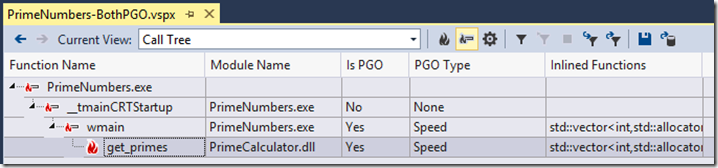
So let’s try again. Using the “Profile Guided Optimization” context menu, I will instrument the PrimeCalculator project, then the PrimeNumbers project, and choose “Run Instrumented/Optimized Build” to collect a new training run. I input 10K again as the limit, and when it finished use the “Profile Guided Optimization” menu to optimize both the PrimeCalculator and the PrimeNumbers projects. Now, I’ll launch the profiler again, and this time when the report comes up, navigate to the Call Tree view. When the hot path is expanded you can see that get_primes is now showing having been PGO’d, and all of the functions I control in my hot path are showing as having been PGO’d.
Leveraging the PGO Type column
The example above is a simple example to illustrate how the profile can show you the state of your training data. The more common example where the profiler will come into play is when a customer reports a performance problem. You then either reproduce the problem and profile the scenario, or ask them to collect a performance trace for you. You can then open the report and see whether the hot path in the report is showing your code as primarily PGO type of size, speed, or even PGO’d at all. If the hot path is not showing any functions as profiled for speed that would let you know that you need to update your training to exercise this code path more. If the code path is showing functions profiled for speed then you need to look to make improvements to the implementation rather than relying on PGO to provide desired performance improvements.
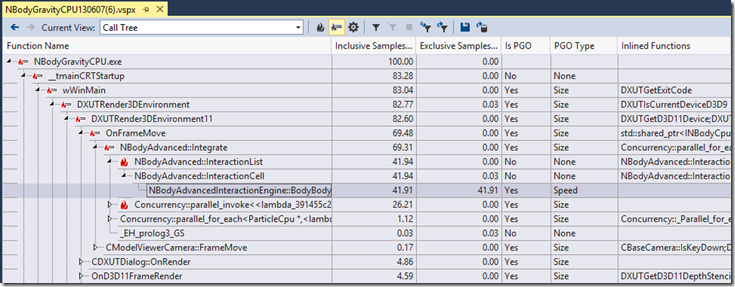
At this point it is worth nothing that for very small applications such as the PrimeNumbers sample app, PGO will always optimize all of the functions for speed. An application needs to contain about 6000 instructions before PGO will begin to make size versus speed decisions. To illustrate this below, I’ve PGO’d and then profiled the NBody sample application attached to the “Build faster and high performing native applications using PGO” blog post.
Start profiling today
The above was a very basic example of how to use the profiler to understand compiler optimizations, and PGO training. Feel free to download the sample project used in this blog post, and hopefully you can see how you can apply this to your applications by trying the CPU profiler in Visual Studio 2013. Note that the new PGO support in the profiler requires that you profile on Windows 8 or higher, and that the report be viewed in Visual Studio 2013 Premium or higher.
For more on profiling, see the blog of the Visual Studio Diagnostics team, and ask questions in the Visual Studio Diagnostics forum.
0 comments