Imagine this: You’re deep into a complex C++ project, and everything seems to be running smoothly. But then, out of nowhere, a critical bug surfaces— one that requires a bit more foresight. We’ve all been there, right? This is where code analysis steps in as your silent guardian.
Code analysis is a great tool for catching those elusive bugs and ensuring your code adheres to the best programming practices. It identifies defects that are difficult to discover through testing by searching for specific code patterns known to cause problems.
The analysis results are displayed in the Visual Studio Error List window and as squiggles in the editor. This feature checks for problematic code patterns, such as buffer overruns caused by converting an element count into a byte count and null pointer dereferences, even if the code looks correct. In this blog, we will focus on MSVC Code Analysis, which is one of the different types of code analysis available in Visual Studio for C++.
Where MSVC Code Analysis Shines
In 2014, the tech world was shaken by the discovery of the Heartbleed bug in OpenSSL. This critical vulnerability, caused by a missing bounds check, allowed attackers to exploit the TLS heartbeat extension and read sensitive data from server memory, including private keys, usernames, and passwords. The fallout was massive, affecting millions of users and causing widespread panic.
Now, picture yourself as a C++ developer working on a high-stakes project. You know that even a small mistake can lead to significant security vulnerabilities, just like Heartbleed. This is where MSVC Code Analysis becomes your best ally.
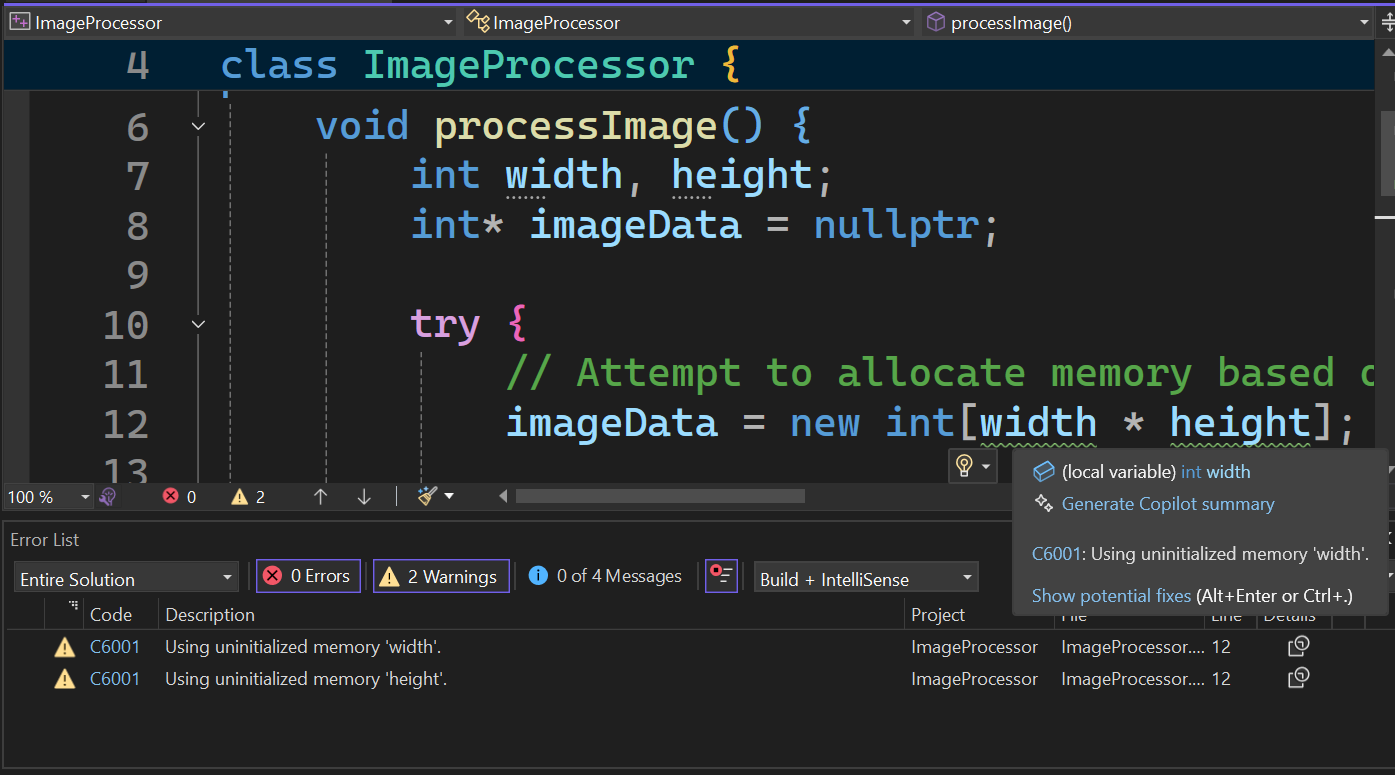
MSVC Code Analysis is a static analysis tool that checks your code for errors, potential improvements, and adherence to coding best practices when using the Microsoft Visual C++ (MSVC) compiler. For example, failing to initialize a pointer (e.g., int* uninitializedPtr;) in your project can result in unpredictable behavior, crashes, and security vulnerabilities. Consider the following scenario: You declare a pointer and initialize it to nullptr (int* imageData = nullptr;). Later, you attempt to allocate memory for the pointer based on uninitialized width and height variables (imageData = new int[width * height];). This can lead to undefined behavior because width and height are not initialized before use. If the pointer is used before being properly assigned, it can lead to accessing uninitialized memory, which Rule C6001 identifies, helping you catch these issues before they become critical problems. The following sample generates ‘Using uninitialized memory’ warning:
#include <iostream>

#include <stdexcept>

 class ImageProcessor {

public:

    void processImage() {

        int width, height;

        int* imageData = nullptr;

        try {

            // Attempt to allocate memory based on width and height

            imageData = new int[width * height]; // Uninitialized width and height

            // Process the image data (this will cause undefined behavior)

            for (int i = 0; i < width * height; ++i) {

                imageData[i] = i; // Potentially accessing uninitialized memory

            }

            // Simulate further processing

            std::cout << "Image processed successfully." << std::endl;

        }

        catch (const std::bad_alloc& e) {

            std::cerr << "Memory allocation failed: " << e.what() << std::endl;

        }

        // Clean up allocated memory

        delete[] imageData;

    }

};
Now, let’s use this example to understand the different ways to invoke code analysis in Visual Studio.
Background Code Analysis
This integral feature of Visual Studio functions as a real-time code analysis tool. This tool is particularly beneficial for you because it:
- Provides immediate feedback on potential issues, aiding in early problem resolution.
- Focuses on the files that are currently open in the editor, streamlining analysis during active development.
Background code analysis will automatically run after you open or save the file. The warning for uninitialized memory will be enabled by default, displaying a green squiggle in the editor and appearing in the error list, as demonstrated in the example below.
This feature is enabled by default; however, you can double check the setting by navigating to Tools > Options > Text Editor > C/C++ > Advanced > Code Analysis > Disable Background Code Analysis: False.
Manually Running Code Analysis
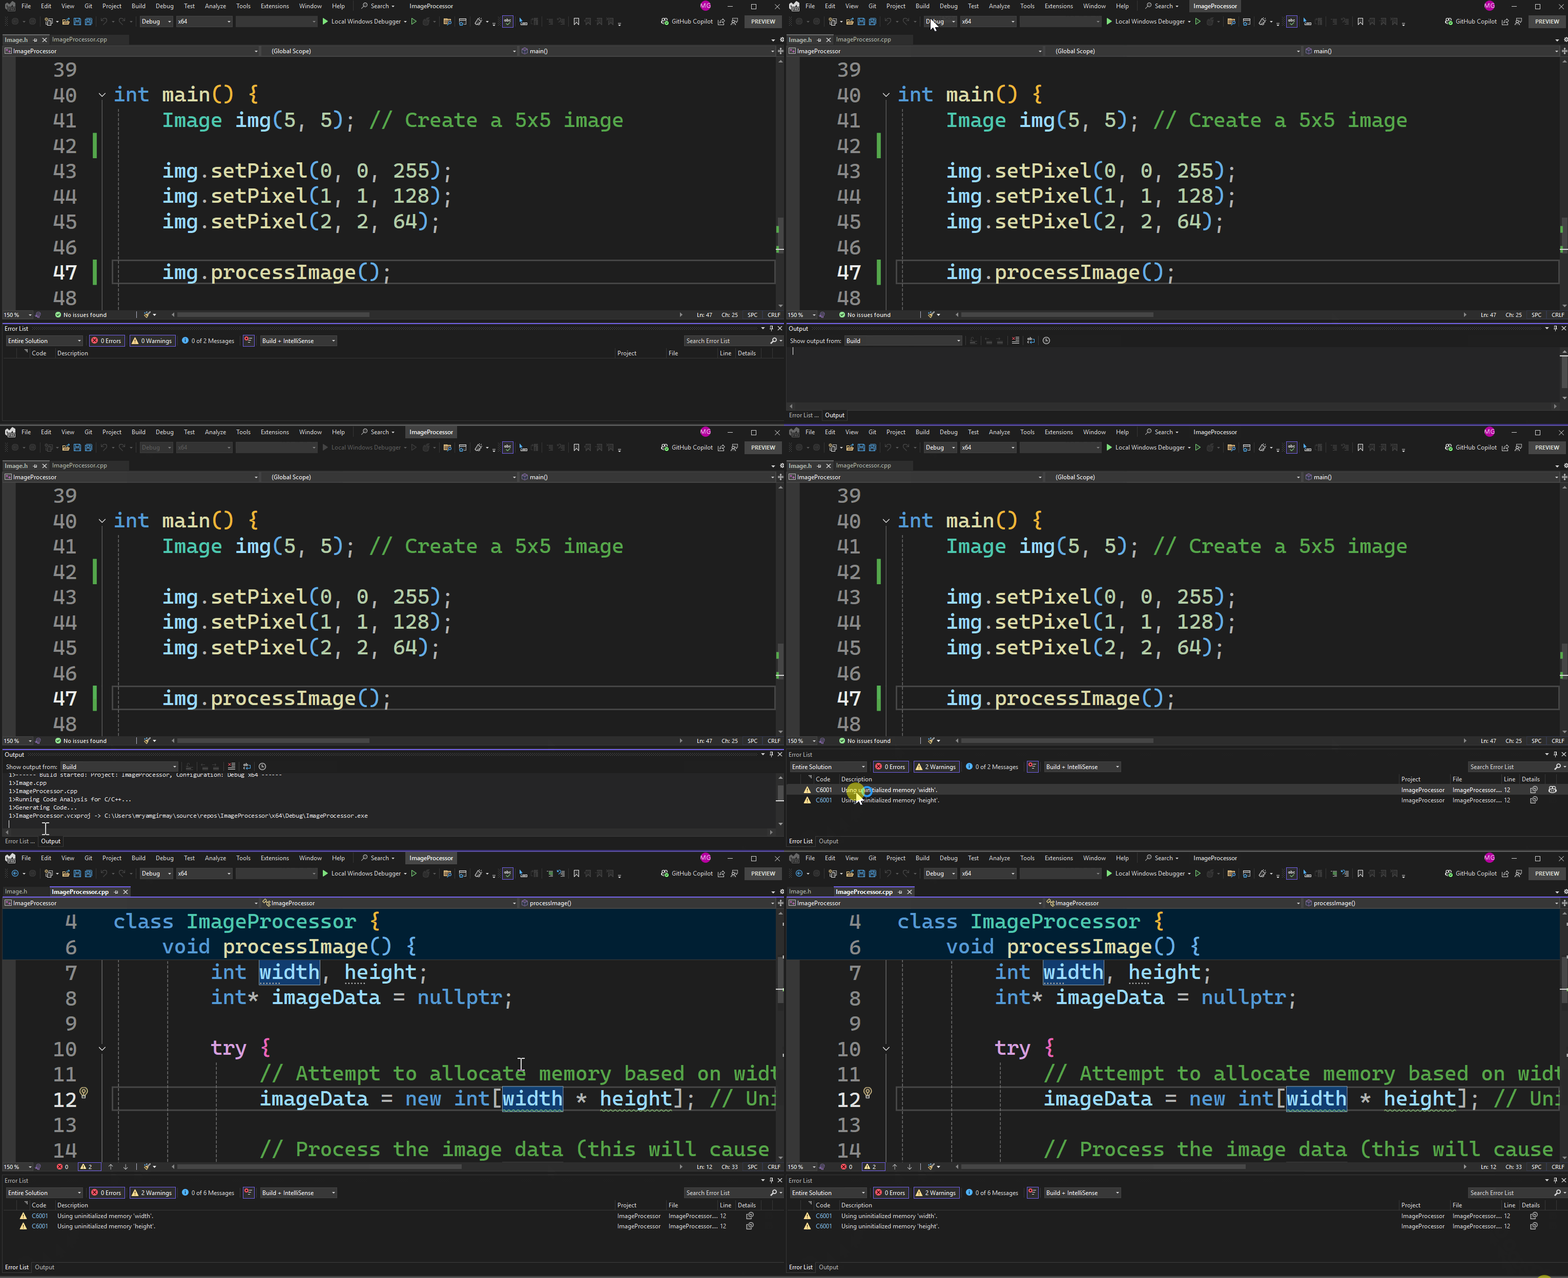
In addition to background code analysis, you can also manually run code analysis as needed. You can start by clearing all warnings in the current file you’re working on, then invoke Code Analysis for the current project. Periodically, run Code Analysis for the entire solution to maintain overall code quality. You can also manually run code analysis for individual files. There are several ways to manually run a code analysis. Following any of these steps will display the ‘Using uninitialized memory’ warning in the error list window for our example.
1. Menu-bar:
- Open the project.
-
- From the menu-bar, select Build -> Run Code Analysis on [Solution | Project Name | File]
- From the menu-bar, select Analyze -> Run Code Analysis -> [On Solution | Run Code Analysis on ‘project name’ | Run Code Analysis on File]
2. Keyboard Shortcut:
- For a single file: Ctrl + Shift + Alt + F7
Learn more about the different ways to run code analysis manually in Run code analysis.
Enable Code Analysis on Build
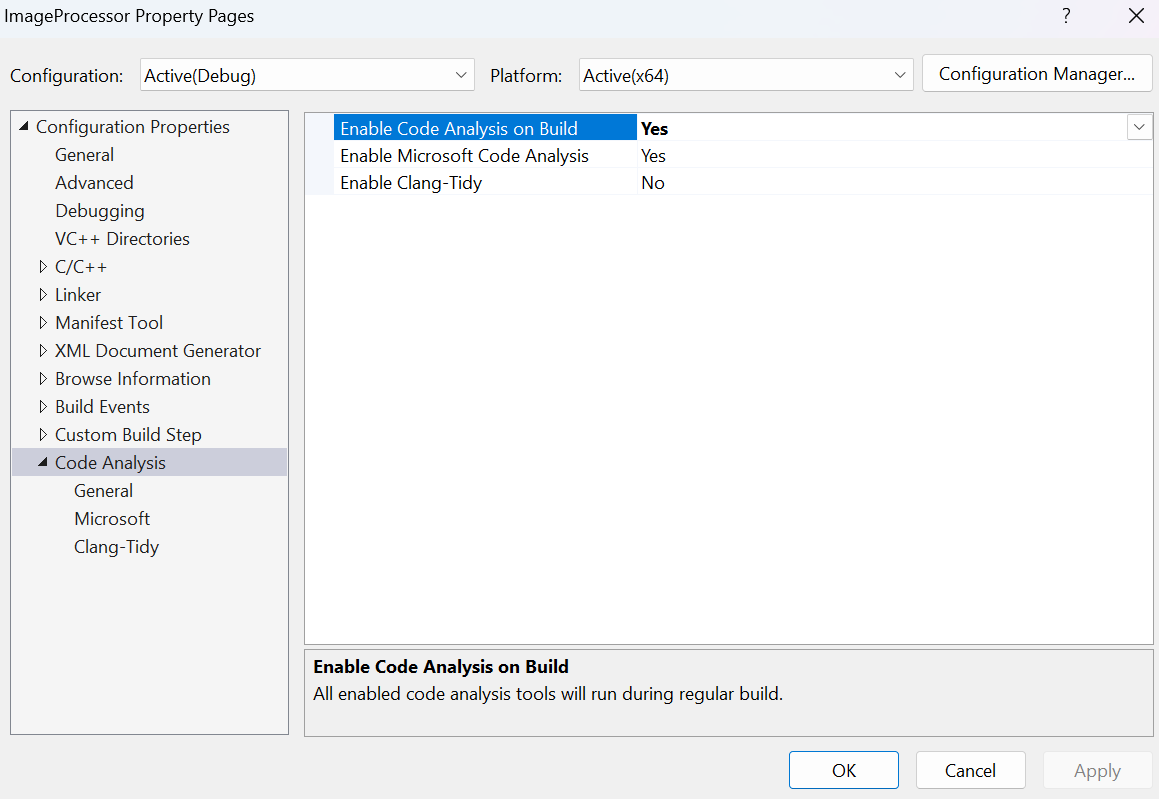
This setup ensures that code analysis runs automatically every time you build your project or compile a single file. Think of code analysis as an inspector who checks your project. While this inspector might take more time to examine everything, catching potential issues early provides peace of mind. This additional time you invest is necessary to ensure your code is secure. To enable it:
- Open Project Properties in Visual Studio.
- Navigate to Configuration Properties > Code Analysis > General.
- Select the Yes option for Enable Code Analysis on Build. Note that this option is disabled by default, whereas Microsoft Code Analysis is enabled by default.
- To view all default selected rules, including the rule for detecting uninitialized memory, navigate to Configuration Properties > Code Analysis > Microsoft, and then click Configure.
After enabling code analysis on build, building the example code will cause Visual Studio to generate a warning for the lines imageData = new int[width * height];, indicating that width and height are uninitialized. Background code analysis focuses on the files you’re actively working on, while build-time analysis ensures all project files are checked, catching any missed issues that aren’t in the current file. This warning will appear in the Error List window.
Key Events in Microsoft C++ Code Analysis help you quickly identify and fix defects by providing detailed information in selected warnings from the Error List. They trace code flow to pinpoint root causes, making it easier to understand issues like variable initialization or branching. For example, double-clicking the C6001 ‘Using uninitialized memory: width’ warning in the Error List opens a new window showing the Key Events. For further insights, please refer to the Microsoft C++ Code Analysis Warnings with Key Events blog.
Code Analysis Rules and Rulesets
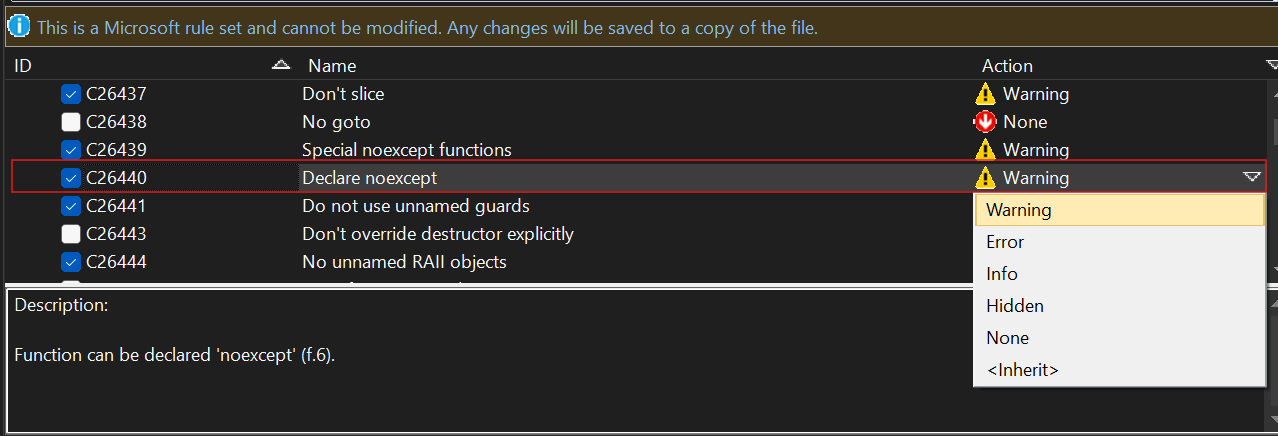
Rulesets in Visual Studio for C++ are collections of code analysis rules that ensure code quality and adherence to standards. For example, enabling the MSVC rule C26440, ‘Function can be declared ‘noexcept’,’ suggests marking functions with ‘noexcept’ if they do not throw exceptions. This can improve both performance and reliability.
To create a new custom rule set with the “Function can be declared ‘noexcept’” rule added, follow these steps:
- Open Project Properties in Visual Studio
- Navigate to Configuration Properties > Code Analysis > Microsoft.
- In the Active rules section, click “Configure”
- Select the check box for the rule that you want to include in the ruleset. The Action will automatically change from ‘None’ to ‘Warning’. You can change the severity of this rule based on your needs, with options like Error, Info, Hidden, None, or <Inherit>.
- Save the rule set with a new file name. The custom rule set is now automatically assigned to the project.
To learn more about using rule sets in depth, refer to the Use Rule Sets to Specify the C++ Rules to Run article.
Additional Tools and Techniques
Visual Studio offers several features that can enhance code quality and prevent issues like the Heartbleed bug. Here are some tools you might find useful:
Clang-Tidy Code Analysis
Clang-Tidy, a tool used with the LLVM/clang-cl compiler, is designed to modernize your code, ensure adherence to standards, perform static analysis, and automatically format your code. When using an MSVC toolset, you can configure Clang-Tidy to complement or replace the conventional Code Analysis process. This helps catch different types of issues and improves overall code quality. You can find more details in Using Clang-Tidy in Visual Studio article.
Suppress Specific Warnings
Suppressing specific warnings in C++ involves configuring your project settings to ignore certain compiler warnings for a single line, section of code, file, or entire project. This can be done at the project level or for individual files using Visual Studio’s project properties or ‘#pragma warning’ directives. By suppressing less relevant warnings, you can focus on the most critical issues, making the build output cleaner and easier to read, which simplifies identifying and addressing significant problems. To dive deeper into this topic, check out the Suppress compiler warnings article.
It’s important to note that Code Analysis tools may occasionally generate false positives. If you encounter a false positive, please report it through the Visual Studio Developer Community channel with detailed repro code and information. This helps us to improve the accuracy of Code Analysis tools and ensures a smoother development experience.
Learn More
To learn more about securing your C++ programs, visit the Build Reliable and Secure C++ programs blog. For the latest updates to the MSVC backend, check out the MSVC Backend Updates in Visual Studio 2022 version 17.10 blog.
Your feedback is invaluable in helping us enhance the MSVC Code Analysis experience. Please share your suggestions in the comments below or through the Developer Community. You can also reach us via email at visualcpp@microsoft.com or via X at @VisualC.


Fabulous post and a subject close to my heart. Please add unused member variable to your analysis though.
Hi Tom, Thank you for your feedback! Please file this request in our Developer Community channel to help us track it. For your information, Visual Studio C++ has Compiler Warning C4189, which can detect unused member variables.