
If you have experience debugging C# or Visual Basic code in Visual Studio, you are probably familiar with a debugging feature called Just My Code (JMC). In Visual Studio 2013, we introduce Just My Code for C++. In VS2013, the goal of this C++ JMC feature is to help the user focus on their code when viewing call stacks without getting lost in library code, Windows code, etc.
User Experience
When looking at a call stack, the debugger will collapse all consecutive frames of non-user code into an annotated frame labeled [External Code]. There is an exception to this, if the application is stopped in non-user code, then external code at the top part of the call stack will be shown.
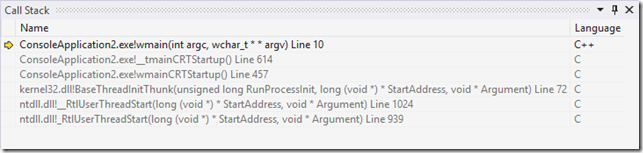
Let’s start with the most basic example. If you create a new Win32 Console application in Visual Studio 2012 (or in VS2013 with JMC turned off) and set a breakpoint on the first line, you will get the following call stack:
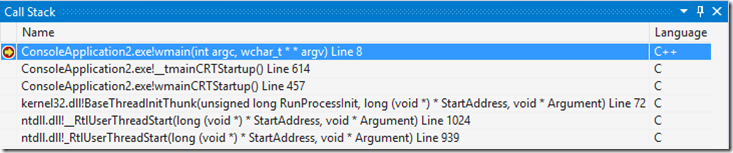
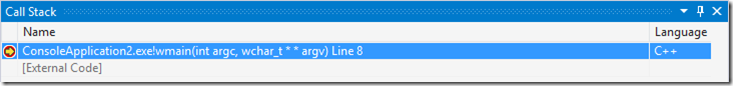
To most users, only the top frame is really the only part that is interesting. The Just My Code feature reduces the call stack to this:
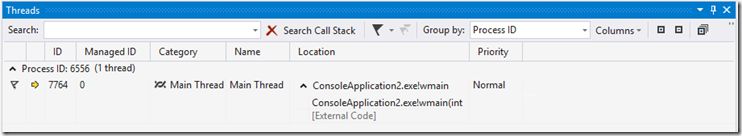
Just My Code does not just apply to the Call Stack window, but to anywhere call stacks are shown. For example, you get these same benefits in the Threads window:
Or in the Parallel Stacks window:

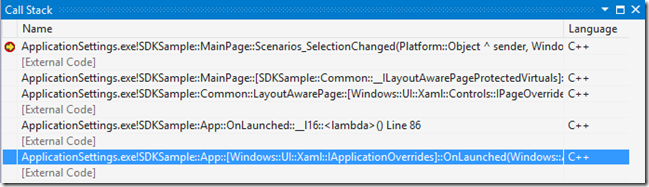
JMC can be extremely helpful in cases where there is a lot of library code that makes it difficult to find your own code. Consider this example when debugging a Windos Store app. The call stack is so unwieldy that you can’t see the user code you care about even when you un-dock the Call Stack window and expand it to its near maximum size.
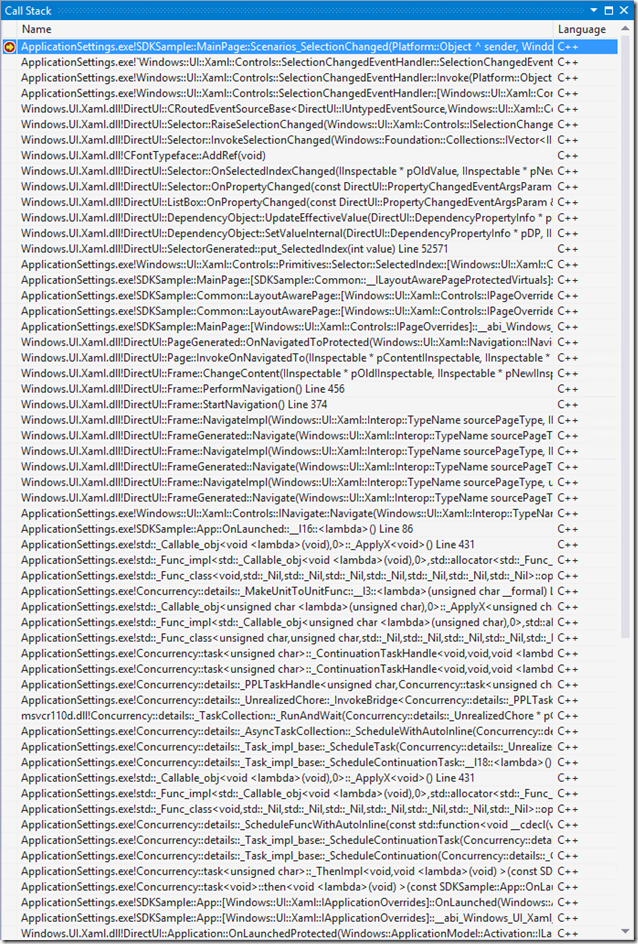
Just My Code makes it much simpler to find your code so that you can navigate to it.
Turning JMC off and on
If it turns out that if you do want to see the external code, you can use the context menu in the call stack window to toggle between showing and hiding external code.
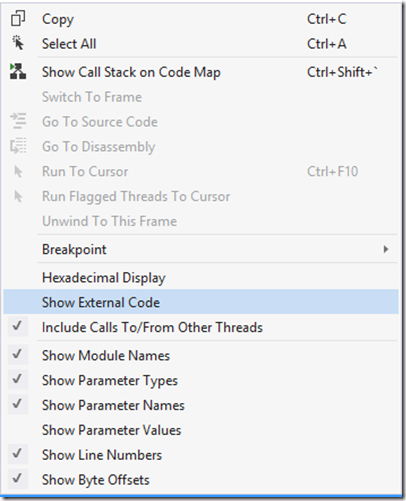
When you turn this off, Just My Code will display the external call stack frames in a lighter gray color.
If you want to turn Just My Code off completely, you can change the setting in Tools->Options.

Customizing Non-user code
While there is a default experience for JMC out of the box, you can further customize it to your liking if you so choose. Non-user code is defined in xml files with a .natjmc extension found in one of two locations.
%VSINSTALLDIR%\Common7\Packages\Debugger\Visualizers
%USERPROFILE%\My Documents\Visual Studio 2012\Visualizers
These are the same locations that are used when processing native visualizers (natvis files). The default is settings are found in %VSINSTALLDIR%\Common7\Packages\Debugger\Visualizers\default.natjmc and provide a full illustrative example of how code is defined as non-user.
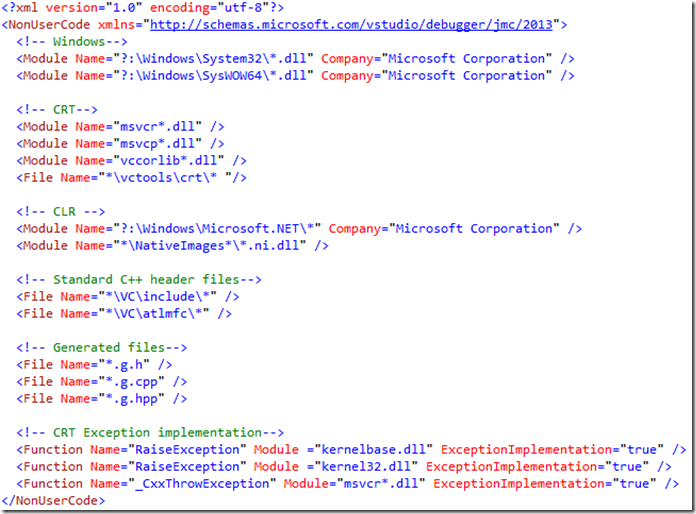
As you can see, you can define code as non-user on three different levels:
-
By Module
-
By File
-
By Function
Name matching allows for the use of * and ? so that you can adequately cover lots of cases by only adding a single line of xml. For modules, you can additionally include a company name, which will be matched against the company name included when the file was built. For example, the line below will define modules in system32 as non-user code if they come from Microsoft. However, if you install your own code into that directory, it will still be considered user code.
<ModuleName=“?:\Windows\System32\*.dll“Company=“Microsoft Corporation“ />
Additionally, for files and functions, you can include a module name to make this more specific. For example, line below will include RaiseException in kernel32.dll as non-user code, but will not include your function of the same name in a different binary.
<FunctionName=“RaiseException“Module =“kernel32.dll“ExceptionImplementation=“true“ />
As mentioned earlier, the debugger will still show external code at the top of the stack when the application is stopped in that code. The ExceptionImplementation attribute applies an exception to that rule to hide code that throws exceptions.
We would love to hear any questions or comments you have in the comments below or on our MSDN forum.
0 comments