

We’re excited to announce that the #include Diagnostics feature is now available in Visual Studio 2022 17.9 Preview 2. This new feature allows you to better understand the behavior of #include directives by providing detailed information on each directive’s references and build time.
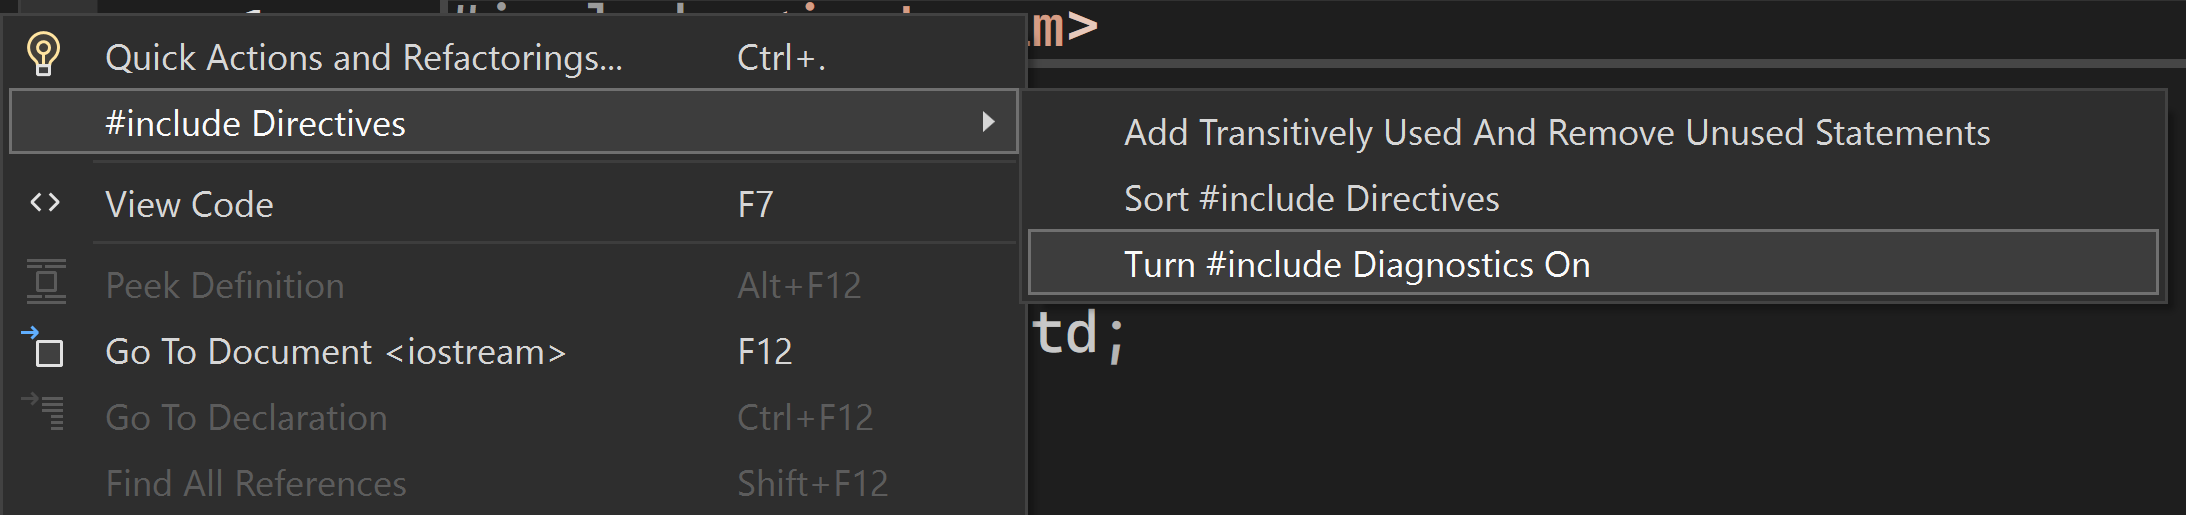
To begin utilizing this feature, activate #include diagnostics by performing a right-click in your editor to display the context menu. Then, navigate to the ‘Include Directives’ option and choose ‘Enable #include Diagnostics’.
#include References
The feature in Visual Studio allows you to analyze the usage of #include directives in your code. It shows where and how often each directive is referenced, which can be particularly useful when dealing with a long list of directives. If you find an #include directive that is infrequently used but significantly impacts your compile time, this tool will help you identify it quickly so you can take the necessary steps to optimize your code.
Once you enable #include diagnostics, you should see a line of text above each #include directive. This is the CodeLens feature in action. The text above the #include directive indicates the count of its references in your current file. Clicking this count opens a window listing these references. Selecting any reference from this list will direct you to its corresponding line of code in your project.
#include Build Time
This feature presents the build time for each #include directive. To activate this, you’ll need to run Build Insights by navigating to Build -> Run Build Insights. This action will generate the necessary build time data. This allows you to easily visualize and evaluate the build time for each #include directive by comparing its usage and compilation time. The information provided by #include Diagnostics can be utilized to optimize your #include directives and improve compilation time. In addition to the information provided by the new #include diagnostics you may also want to consider checking out our documentation on C++ modules as an alternative to #include to further improve compilation time.
Send us your feedback
Your feedback is invaluable to us as we strive to enhance your experience. Please feel free to leave your comments below. Alternatively, you can share your thoughts through the Visual Studio Developer Community. We’re also available on Twitter (@VisualC) and can be reached via email at visualcpp@microsoft.com. We look forward to hearing from you!
That’s a cool feature! thanks!