

In Visual Studio 2022 17.10 Preview 2, we’re including a small quality-of-life improvement that results in the Watch/Locals window displaying local variables correctly for any arbitrary frames in the call stack in debug builds. To try it out, please install the recently released Preview. For more information, read on.
The problem: missing variables in Watch Window
Have you ever been in this situation? We’re debugging some code, and have a breakpoint we hit in a function, foo. We need to inspect the values of some local variables a bit up the call stack, so we open up the call stack window and click to that frame.
In this case, we want to see the value of the variable y, which is an input to calculate the argument to the function foo we’re inspecting. Unfortunately, it’s not available:
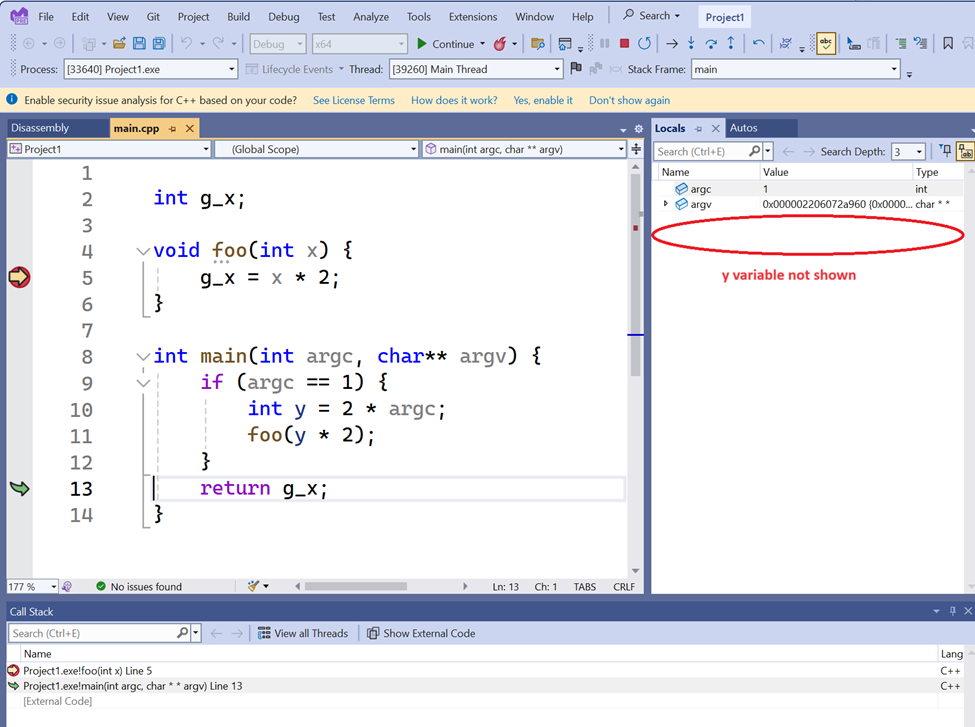
The reason it isn’t available has to do with scoping, and how call stacks are walked. The variable y is scoped to just that one if statement; when you’re outside the if block, y no longer exists. And, the way call stacks work, the return address we use to determine the scope is actually the next instruction after the call, or in this case, the return statement.
Improvements to variable visibility
In Visual Studio 2022 17.10 Preview 2, we’ve addressed this 🙏 Community Suggestion. Now, in this toy example, you will see the value of the variable y:
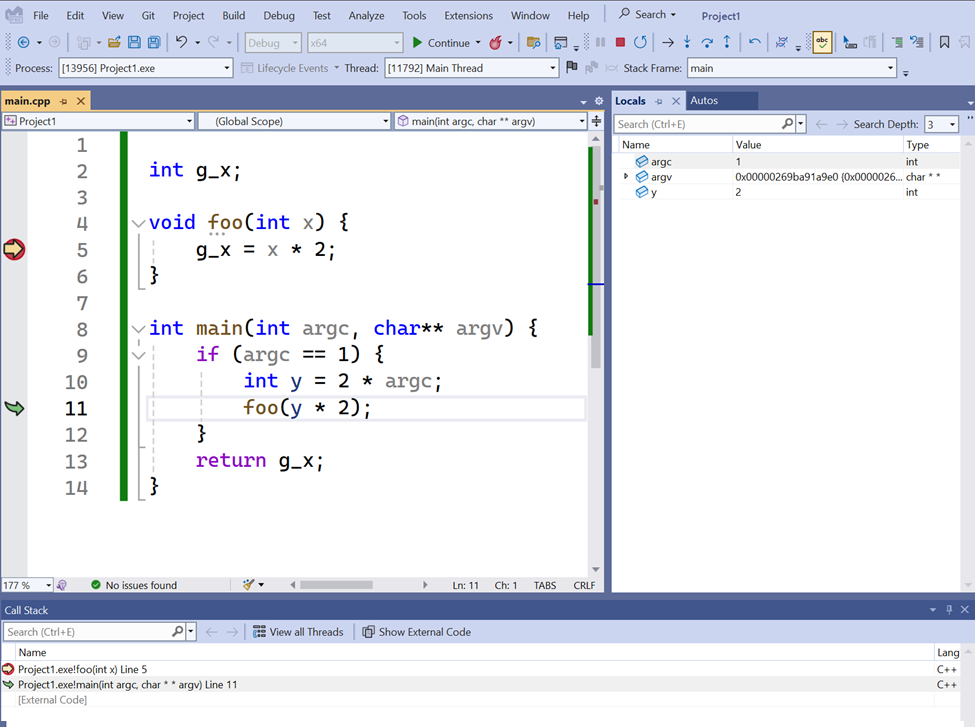
The breakpoint is in the same location, but now when you click to the previous frame, you’ll see the “next statement” arrow still points to the call, so all the variables in that scope are now available.
How did we do this? Well, there are a ton of approaches we could have taken, but the one we went with was to change the code generation of debug builds to include nop instructions after every call which ends a lexical scope (and only calls which are the final instruction in a scope).
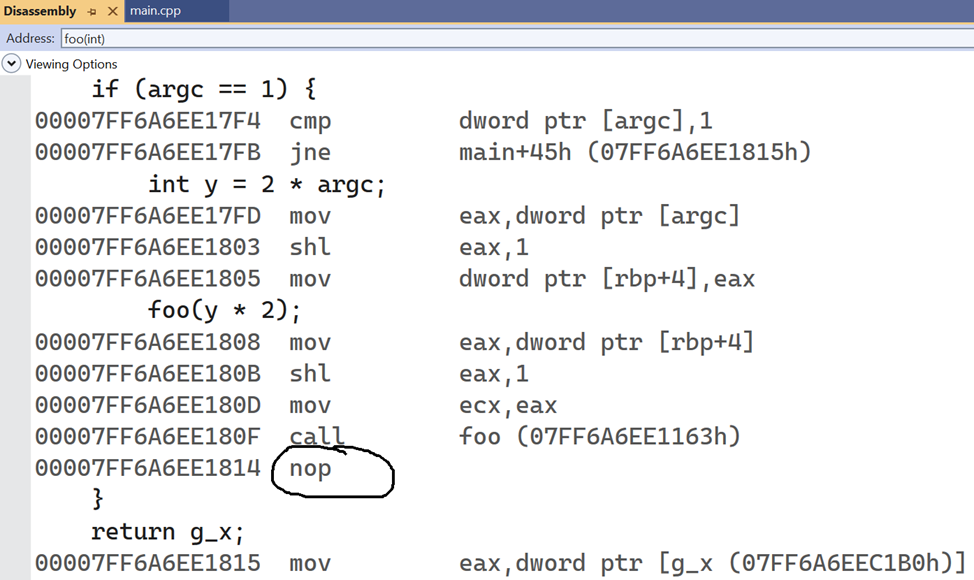
The extra nop instruction after the call to foo is what makes this work. It’s located in the same scope, so everything works as expected without having to modify the debugger or the stack walking algorithm. This has the advantage of also working on older debuggers.
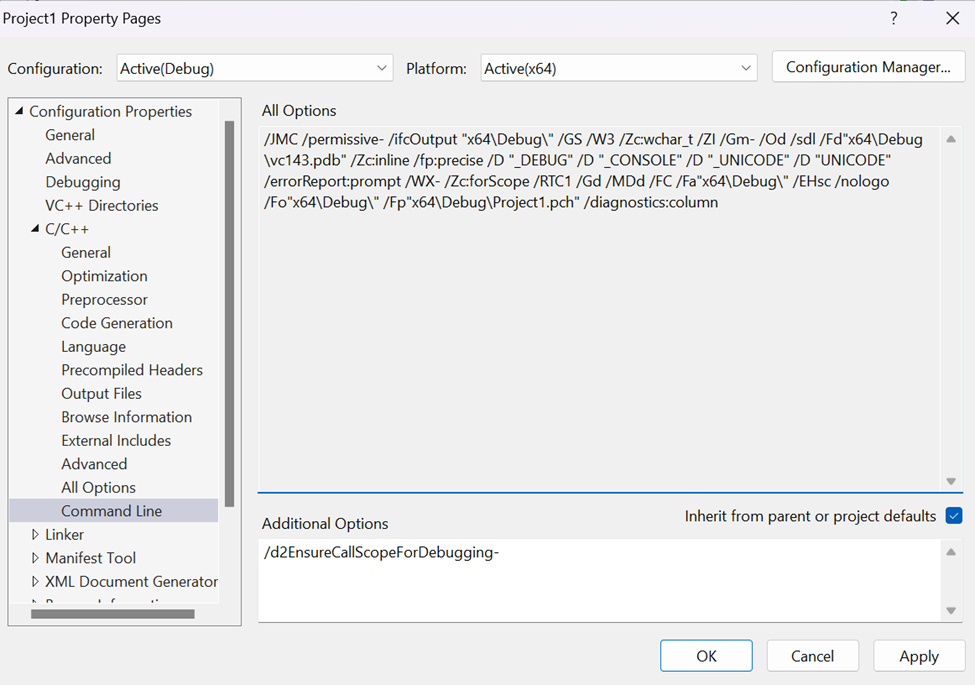
This approach does increase the code size generated in Debug builds, so should something go wrong, we’ve added a switch to disable this behavior. Just add /d2EnsureCallScopeForDebugging- to the “Additional Options” under the Command Line for your project, and you’ll get the previous behavior of not generating extra nops:
This switch may be removed in the future.
Send us your feedback
That’s the feature, let us know if you find it helpful or find any issues. Please install Visual Studio 2022 17.10 Preview 2 and give it a try! We are very much interested in your feedback to continue to improve this experience. The comments below are open.
We appreciate the time you took to report issues and sharing suggestions like this one. We hope you will continue to give us feedback when using Visual Studio about what you like and what we can improve. Your feedback is critical to help us make Visual Studio the best tool it can be. Please share your feedback via Visual Studio Developer Community. You can also reach us on X (@VisualC), or via email at visualcpp@microsoft.com.
This is a welcome addition in my world. There have been many times I’ve cursed the debugger for not being able to show me the values which ought to be in scope. Thanks for working on this!
Are there plans to adjust the debugger so it can look up context based on the previous instruction? This nop-after-call change unfortunately wouldn’t help with debugging in optimized code. It also adds overhead to debug builds, although at least it looks much less than Just My Code (which I had to disable due to ~25% slowdown).
Very little helps with debugging optimised code due to the as is principle. Basically, as long as the observable results are the same, the generated optimised code can be vastly different from the code as written. When the optimiser is able to remove huge swaths of code, variables or even entire functions if it is determined that it does nothing, then you would really not want to do any real debugging in the optimised build unless you can't replicate bugs in other builds. Even having a logged/checked build is more preferable.
Debug build overhead is also a tricky situation because...
There are still plenty of cases even in optimized builds where the variables in question are resident on the stack and up to date, such as sizable arrays and objects that have had pointer/references escape. These are perfectly inspectable in the debugger as long as it determines the correct scope, with the above issue being a notable case where it doesn’t. Using a debug build is not always feasible, such as debugging a crash dump from a released build.
Are there any plans to improve the visibility of constexpr variables?
Currently the debugger cannot see the value of `constexpr static` in the local scope and `constexpr inline` in the global scope at all.
In 17.9, the debugger does see the value of constexpr static and constexpr inline in debug builds. From what I can gather, it places it in the rdata section. For constexpr non static, the compiler places it on the stack if it is local, so the variable only contains the value after it initialises.
For release, the compiler directly loads the value into the registers, so the variable itself doesn’t exist, but this is what you would want for the release build.
Basically, at runtime, the compiler treats constexpr as const.
This says “debug builds” – does it also apply to code that has optimizations disabled, i.e. `#pragma optimize( “”, off )` blocks?
It does