Hi, my name is Renin John and I work as a Software Development Engineer in Test with the VC++ Project and Build Team. I was involved in testing the Build performance of the VS 2010 IDE and I wanted to give you all an idea about what to expect, and some basic steps you could take if you end up in a situation where your project builds slower in VS 2010 than it did in VS 2008 or a previous version.
VS 2010 has better or equal performance in majority of the cases we have measured. However, if you’re hit by a build performance degradation, stay tuned and I will show you ways to investigate the issue, identify whether you are comparing apples to apples, figure out a way to improve the build performance and report bugs with appropriate level of detail so we can take action as quickly as possible.
I – Identifying Your Situation
- What kind of build am I doing?
- If you just start up/restart your machine, open VS and do a build, it is said to be an Arctic Cold build.
- If you close down VS, open it again and then perform a build, it is said to be a Cold build (since memory is cached in this case).
- If you did a build, and you’re redoing it (Clean + Build, or Rebuild Solution), the one you’re redoing as well as any build you redo after that, are called Warm builds.Performing a Rebuild is similar to doing Clean Project 1, Build Project 1, Clean Project 2, Build Project 2, etc. Hence be aware that there is a cleaning overhead involved in the build time. Also make a note of the configuration you are building in: Debug, Release, … The performance will vary due to the different switches that get passed to the tools in each case.
- What is my Build Output Verbosity setting?
The output verbosity level impacts the build time depending on the amount of text it needs to print out to the console and the log file(s). When I did a comparison, building Diagnostic took about 5% longer. If you’re not already aware, this setting had no impact in VS 2008 … the outputs generated were always the same.

- Did I make a Remote Desktop Connection to the build machine? If you connect remotely to the machine to do a build, you will observe a noticeable difference in the build time when you compare it with what it takes to build locally on your physical machine, based on the network bandwidth, latency, etc. A cause for this variation is the build text being constantly outputted and scrolling taking place, in the Output window. Therefore, take care not to compare the build times of (say) a VS 2008 solution build locally versus a VS 2010 solution build remotely.
- Am I running a virus scanner? The anti-virus software that you’re running on your machine could interact with the tools during the build process negatively impacting the performance of a build. The level of interaction might vary between different versions of VS. During the development process of Visual Studio 2010, we tested the performance of our build scenarios with different anti-virus software installed. We were able to measure notable performance overhead in some of these scenarios and worked with vendors to help us understand and improve our toolset. One interesting thing about AV software is heuristics and scanning algorithms change frequently as new viruses and attacks are discovered in the wild. With that said, the performance we were able to measure at the time we shipped Visual Studio 2010 was acceptable with respect to the presence of AV software, but those characteristics are subject to change as AV software continues to evolve. While we are working continuously on making our tools robust in the face of security scanners, you could consider disabling your anti-virus from scanning the build output directories or entirely, for better performance. Microsoft cannot recommend you disable your anti-virus software to improve performance, but the potential interaction with it is something worthy of consideration.
- What other services do I have running on this machine? Like the security scanner, other services could also be having an impact on your build time. If you see the need, take a few minutes to identify and turn off any services that you are not using before doing the build. In addition to the anti-virus mentioned earlier, some other services you might want to turn off include Superfetch and Windows Search. In case you don’t already know, you could stop these services by bringing up the Services window on your machine: Go to Start –> Run and enter “services.msc”. Now double-click on the services of your choice, say Superfetch, hit the Stop button and click “OK”. Once you are done with the build, hit “Start” to turn the service back on.
Additional Useful Information
|
II – Common Scenarios/Issues that Would Increase Build Time
- In VS 2010, the compiler is set to generate PDBs by default in the Release configuration
In VS 2010, the default value of Debug Information Format is “Program Database (/Zi)” while in VS 2008, it was “Disabled”.
In most of the wizard generated projects in VS 2008, “/Zi” was forced and the wizards were overwriting these values in the projects. So, in VS 2010, we made this the default and the wizards no longer force the projects to overwrite this property.
This could create dissimilarity in property values between VS 2010 and the version converted from. It can surface up only in two scenarios:
- If you are upgrading from VC6.
- If you are upgrading from a project where someone had explicitly chosen “<inherit from parent or project defaults>”.
For a little background on why this is happening, VS does not create an entry in the project file whenever the property takes a default value.
Tip for identifying defaults: Default property values appear unBolded in the project’s Property Pages. Generating PDBs increases build time. Therefore, if your situation does not require generating PDBs, you could bring up the Property Pages of the project and disable Debug Information Format by clearing the value of the field corresponding to that property.
To step it up a notch and further reduce build times, you may also disable the linker from generating PDBs: Open up the Property Pages, go to Configuration Properties –> Linker –> Debugging and set Generate Debug Info to “No”.
- In VS 2008 IDE, /O2 did not get passed to the compiler when not explicitly set in the Property Pages
In VS 2008, although “/O2” was the default compiler Optimization option under Release configuration, say the user did not go and explicitly mention that he wanted the compiler to optimize as “/O2”, then the switch would not get passed to the compiler (since like mentioned above, an entry was not getting created in the project file).
So how does this affect VS 2010 build time? After converting your project to VS 2010, since this issue has been fixed, your project will build with “/O2” on (as desired) causing the build to take longer (in most cases), since the compiler needs to perform an additional task of optimizing the code.
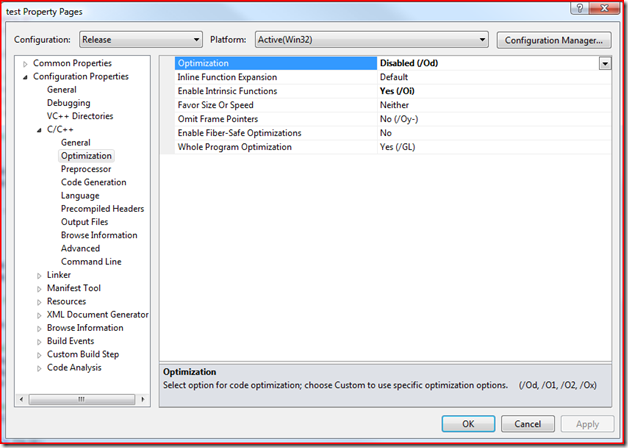
So if your priority is to have faster build time and you don’t really care about the optimization, just disable it: open up the Property Pages, go to Configuration Properties –> C/C++ –> Optimization and change the value of the “Optimization” property to “Disabled (/Od)”.

This should be implied but I’ll mention it anyways: Due to this issue, say you want to gain a meaningful understanding of the build time slowdown (if at all) in VS 2010, you could do so by eliminating the differences between the VS 2008 and VS 2010 builds. For this, enable “/O2” in VS 2008 and do a build before comparing it with the VS2010 build time. This applies to the “/Zi” case mentioned above as well (Enable “/Zi” in VS 2008 and build).
Note: Optimization settings make your application run faster on user machines. By turning off optimizations, you are making a conscious choice of accepting that your application will be slower. Here is a post on code generation improvements made in Visual Studio 2010 to improve performance. - In VS 2010, an MFC app that links to its libraries statically shows reduced build performance
In VS 2010, there has been a substantial growth of the MFC static libraries, which transforms into additional work for the linker while building (The size of the generated binary is also significantly larger as a result).
It is actually caused by a new feature added, allowing MFC controls to be added to a dialog. This in turn required that the DLGINIT handler have knowledge about the MFC controls and this pulls in all the additional portions of the library. We see the benefit of the feature as outweighing the drawback of the additional size of a static EXE, so we do not want to pull the feature. We do, however, plan to address this issue in some way in a future release of Visual Studio.
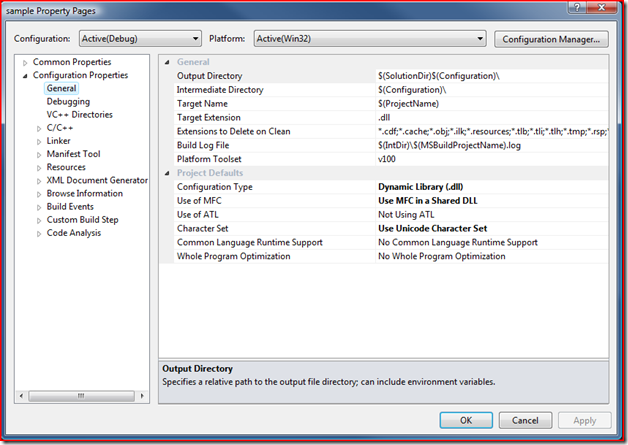
To work around this issue, consider linking to the MFC libraries dynamically. To do this, open up the Property Pages of the project, go to Configuration Properties –> General and change the “Use of MFC” property to “Use MFC in a Shared DLL”.
Microsoft recommends dynamic linking anyways. This allows users to immediately take advantage of any future security patches that may apply to these libraries without the vendor having to rebuild/reship their application.
III – Measuring Build Performance
This section contains suggestions for you to reliably measure the performance if you choose to do a Rebuild (Build -> Rebuild Solution).
A – Initial machine setup
- Reboot the machine.
- Open a VS command prompt in Administrator mode; run ngen executeQueuedItems and wait for it to complete so the ngen cache will be cleared, just in case.
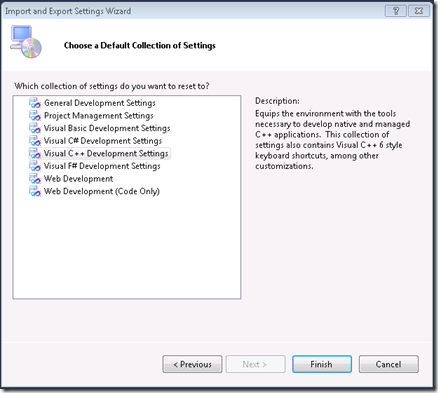
- Start VS IDE and apply the Visual C++ Development Profile.
- Load the solution.
- Do a Rebuild Solution.
B – Measuring Cold Timing
- Shutdown VS.
- Open up the Task Manager and kill all instances of MSBuild.exe (for VS 2010 builds) and mspdbsrv.exe.
- Start VS, Load the Solution, and wait for the CPU to become idle.
- Execute the following steps:
- Choose Rebuild Solution.
- Immediately, start a timer (like the old times, a stopwatch should still work).
- Wait for the build to complete and for the status bar to display a message saying “Rebuild All Succeeded”.
- Immediately stop the timer.
C – Gathering Warm Timings
- Repeat step 4 in the previous section three times.
- Report the average of the three timings collected. If any reading has a lot of variation, redo the build to gain confidence. Or you could perform more number of builds and eliminate the highs and lows.
Note: When you measure the time for the Rebuild Solution scenario, keep in mind that this involves the additional overhead of cleaning up files that were generated during a prior build. For consistency purposes, choose from one of the options listed below:
|
IV – Conducting Investigations
A build includes various pieces like MSBuild, IDE, Tools, Tasks … Listed below are four steps to take to narrow down a slowdown to its root cause:
- Find out if it is a Compiler/Linker Tools regression
The most helpful place to start is with a log of compile/link times by passing the timing switches during build: /Bt for the compiler and /time for the linker. The question you are really trying to answer is what component slowed down and compiling/linking what thing is the cause.
Just in case you are wondering how to pass these switches, there are two ways:
- Open up the Property Pages of each project (you could multi-select the projects) and go to C/C++ or Linker –> Command Line and add the switch under Additional Options.
- Open up a command prompt, set _CL_=/Bt and _LINK_=/time and launch the VS IDE from the command prompt using devenv.exe.
This blog contains additional information regarding the use of these timing switches. Use this information gathered to create a table like:
Project File Front-end Time (c1.dll + c1xx.dll) Back-end Time (c2.dll) Link Time (Final: Total Time) 1 1 X1 Y1 Z1 2 2 X2 Y2 Z2 The best way to go about this is to create a script to parse the logs into the format shown above. You can then merge these together in (say) Excel for two to three different runs to compare the times for each file/project and see where the big diffs are. One of two things will happen: 1. Slowdown is across the board 2. One or a few things will have regressed greatly.
In the first case, you may create a repro by extracting any small file or project from the solution. While in the second case, extract a repro of just the particular file or project causing the slowdown. You should verify that you can reproduce the slowdown by just compiling or linking the extracted project, ideally by just running the actual command like cl.exe … or link.exe … You may then use this repro to report the issue to us (There is a section on Reporting Bugs below). If you did see a wall clock regression for an entire build but no cl/link tools time slowdown, you have thereby eliminated the cl and linker, and can now proceed investigating the other tools (see Step 2).
- If no regression is identified in Step 1, look for regression in Other Tools
As there are no similar hidden switches for the other tools (Lib, RC, Mt, BSCMake, Resgen, CustomBuild …), we can use the timing information output by MSBuild to isolate/investigate the regression. Change the build log verbosity to Diagnostic in order for MSBuild to print out these times. But these times include the additional overhead of invoking the tool, etc.
To view these times, for each project in the solution, find the Task Performance Summary towards the end of the build output. It would look like this:Task Performance Summary:
0 ms SetEnv 4 calls
0 ms Touch 2 calls
0 ms ReadLinesFromFile 1 calls
0 ms Message 3 calls
0 ms Delete 2 calls
0 ms AssignCulture 1 calls
0 ms MakeDir 10 calls
0 ms WriteLinesToFile 1 calls
0 ms AssignTargetPath 5 calls
359 ms RC 1 calls
937 ms Mt 1 calls
3843 ms CL 2 calls
7061 ms Link 1 calls
Although you were done analyzing the compiler and linker times in Step 1, you might want to consider looking into their Task times reported here as well. If you see any regression, it would mean that the slowdown is stemming from the additional MSBuild overhead sub-tasks and not from the tool. You can then measure this exact time by subtracting the Task time from its respective tool time (calculated in Step 1; note, build log verbosity should have been set to Diagnostic in this case). Again, figure out if the slowdown is across the board or in a particular project. If you don’t see a regression in any of these tools, it should most probably be a regression in MSBuild itself. However before concluding that, eliminate the IDE factor by performing Step 3.
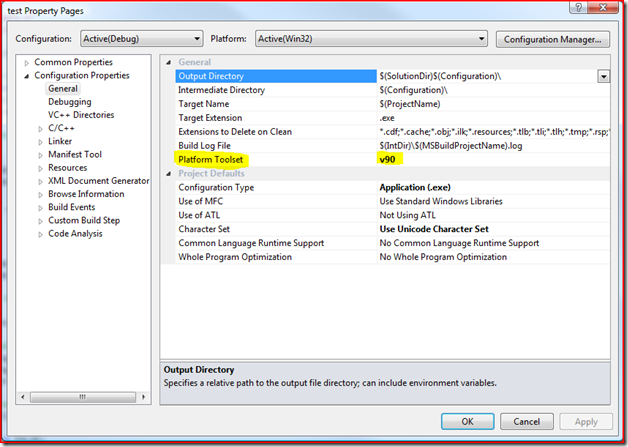
Tip: There is a way to cross check if the slowdown you are seeing is being caused by VS 2010 tools (cl, link, mt, etc.) in particular. For this, you will need to have VS 2008 installed on the same machine. Open up the Property Pages, go to Configuration Properties –> General, change the Platform Toolset to “v90”, and do a build. If you see an improvement in build time, you’ve just narrowed down the issue to VS 2010 tools.
- If no regression is identified through Steps 1 and 2, test whether it is from the IDE The next thing you could do is test whether the slowdown is being caused by the IDE. You may determine this by building with MSBuild over the command line and eliminating the IDE completely. If the slowdown still exists, you know for sure that it is not being caused by the VS 2010 IDE. For details on how to build with MSBuild over the command line, read this blog.
- Collect ETW Traces ETW stands for Event Tracing for Windows. A tool was released recently that automates collecting these traces. You may find it by clicking here. On installation of the tool, you will see a user guide document; follow the instructions in there. Essentially you will just need to start the Profiler, run your scenario and then stop the profiler. Once you have the ETW trace, send it over to us for analysis.
V – Reporting Bugs
If after going through the steps above, you still think that there is a performance issue that needs our attention, feel free to get in touch with us through forums if you need some clarification, or open a Connect bug if you would like something to be considered for fixing in a future release.
When getting in touch with us, please be as detailed as possible providing relevant information from the sections above. Provide all variability information regarding your machine configuration (type of processor, number of cores, amount of installed memory, free disk space, etc.)
Attach the project sources (if it does not violate any licensing terms). If there are license restrictions, try removing/obfuscating any IP and send it to us. If that is not feasible either, consider sending us just the solution (.sln) and project (.dsp/.vcproj & .vcxproj) files. Include Diagnostic logs (see section I.2; build output/log file verbosity setting should be changed to Diagnostic) with timing information enabled (/Bt and /time), along with ETW Traces.
Be detailed about the steps you took in narrowing down the issue and the percentage of slowdown you are observing after eliminating any disparities between the two builds that you are comparing. This will help speed up our investigations and enable us to respond to you quicker. Feel free to also provide any subjective observations you made while doing the exercise.
I would like to thank you all from my end for using Visual Studio 2010 and being patient enough to read this blog. If you have any questions/concerns/comments, throw them at me and I’ll be happy to respond to them.
Renin John Visual C++ Project and Build team


0 comments