
C++ Build Insights is a collection of tools and APIs that can help you gain a deeper understanding of your build times. Today, we’d like to teach you about a special metric offered in this toolkit: the wall clock time responsibility (WCTR). It can be used to estimate how much time is really spent by each activity in your build, even in the presence of parallelism. We first describe how to access this metric with vcperf. Then, we delve into a real-world case study of using the metric to guide the creation of a pre-compiled header (PCH) for the CopperSpice open source project. We hope you will find uses for WCTR in your own build analysis scenarios!
How to obtain and use vcperf
The examples in this article make use of vcperf: a tool that allows you to capture a trace of your build and to view it in the Windows Performance Analyzer (WPA). The latest version with WCTR support is available on GitHub.
1. Follow these steps to obtain and configure vcperf and WPA:
- Clone the vcperf repository from GitHub. Make sure you are synched to the latest version of the sources.
- Open the
vcperf.slnsolution file in Visual Studio 2019, and build the Release configuration for the architecture of your choice: x86 or x64. Choose the architecture that corresponds to your version of Windows. - The vcperf executable you just built will be available in the
out\Release\{architecture}directory. - Obtain WPA by downloading and installing the latest Windows ADK.
- Overwrite the
perf_msvcbuildinsights.dllfile in your WPA installation directory with the one from your vcperf repository. This file is the C++ Build Insights WPA add-in, which must be available to WPA for correctly interpreting the build traces produced by vcperf. You must overwrite this file every time you upgrade your version of vcperf to ensure compatibility.- The location of
perf_msvcbuildinsights.dllin your vcperf repository is:packages\Microsoft.Cpp.BuildInsights.{Version}\wpa\{Architecture}. Use the same architecture as your version of Windows. - WPA’s installation directory is typically:
C:\Program Files (x86)\Windows Kits\10\Windows Performance Toolkit.
- The location of
2. Follow these steps to collect a trace of your build:
- Open an elevated command prompt and browse to the location of the vcperf you just built.
- Obtain a trace of your build:
- Run the following command:
vcperf /start MySessionName. - Build your C++ project from anywhere, even from within Visual Studio 2019 (vcperf collects events system-wide).
- Run the following command:
vcperf /stop MySessionName outputFile.etl. This command will stop the trace, analyze all events, and save everything in theoutputFile.etltrace file.
- Run the following command:
- Open the trace you just collected in WPA.
Accessing the WCTR metric in WPA
vcperf will give you a WCTR value for every activity in your build, from compiler and linker invocations down to template instantiations. For this reason, you can find a Wall Clock Time Responsibility column in all C++ Build Insights views: Build Explorer, Files, Template Instantiations, and Functions. If you are not yet familiar with these views, consider bringing yourself up to speed by reading the following articles:
| Build Explorer | Finding build bottlenecks with C++ Build Insights |
| Files | Faster builds with PCH suggestions from C++ Build Insights |
| Template Instantiations | Profiling template metaprograms with C++ Build Insights |
| Functions | Improving code generation time with C++ Build Insights |
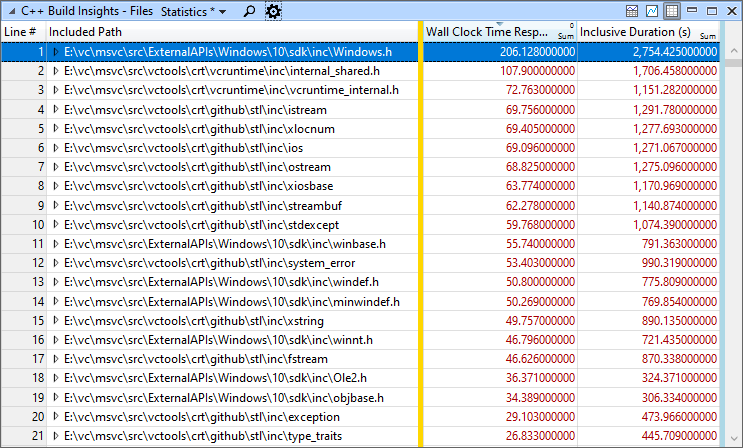
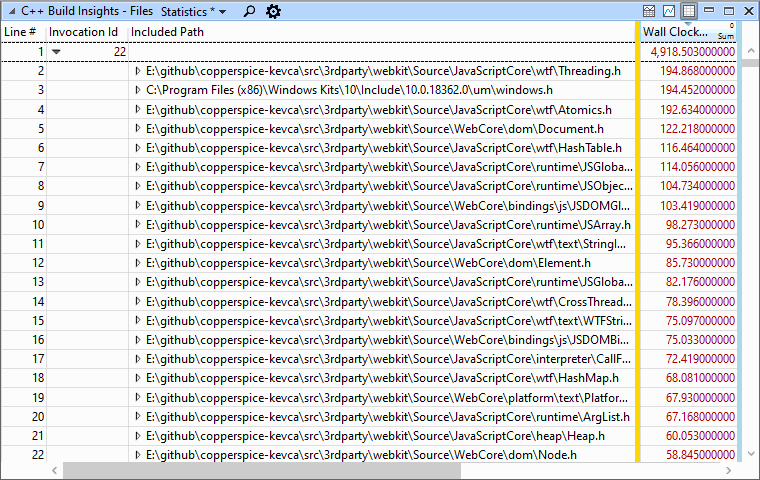
The combination of WCTR and the aggregation done by WPA is what makes this metric truly valuable. Consider the Files view shown below. It tells us that, in total, the aggregated duration of all the times Windows.h was parsed is 2,754 seconds. However, the duration of the entire build (not shown in the image) is around 2,100 seconds, which doesn’t make sense! What’s happening is that headers are parsed on many threads at the same time, adding seconds to our aggregated duration beyond what’s physically possible. As such, the 2,754 value cannot reliably tell us how much time would be saved if we put the Windows.h header in a PCH. The WCTR value, on the other hand, takes build parallelism into account to provide a more realistic estimate. In the example below, we can see that precompiling Windows.h would save us around 206 seconds of real, wall-clock time.
Note: adding a header to a PCH has a time saving effect beyond its own inclusive parsing time. The header itself can include other headers which also become part of the PCH. If these headers are found in multiple inclusion trees, additional savings will occur. For this reason, the WCTR metric tends to underestimate the time that will be saved from adding a header in a PCH. Nonetheless, it is accurate enough to guide your decision-making.
Case study: guiding the PCH creation process for CopperSpice with WCTR
In this case study, we use the WCTR metric to decide which C++ projects within the CopperSpice code base should use a PCH. We proceed to make a simple PCH, improving total build time by 12%.
Use these steps if you would like to follow along:
- Make sure you have CMake version 3.16 or above installed and available on your PATH.
- Open an elevated x64 Native Tools Command Prompt for VS 2019.
- Clone the CopperSpice GitHub repository to a location of your liking.
- Change the directory to the root of the freshly cloned repository and run the following command:
git checkout 9a97793e0c9f. This is the commit that was used for the case study below. - Run the following command:
mkdir build && cd build - Generate the Visual Studio 2019 solution using CMake by running the following command:
cmake -G “Visual Studio 16 2019” -A x64 .. - Open the
copperspice.slnin Visual Studio 2019. This file was generated in thebuildfolder. - Obtain a trace for a full rebuild of the solution:
- From your elevated command prompt, run the following command:
vcperf /start CopperSpice- Make sure you use a vcperf executable built from the vcperf GitHub repository. The vcperf that comes with Visual Studio 2019 will only support WCTR starting from the next version, 16.9.
- Rebuild the x64 Release configuration of the
copperspice.slnsolution file in Visual Studio 2019. - Run the following command:
vcperf /stop CopperSpice copperspice.etl. This will save a trace of the build incopperspice.etl.
- From your elevated command prompt, run the following command:
- Open the trace in WPA.
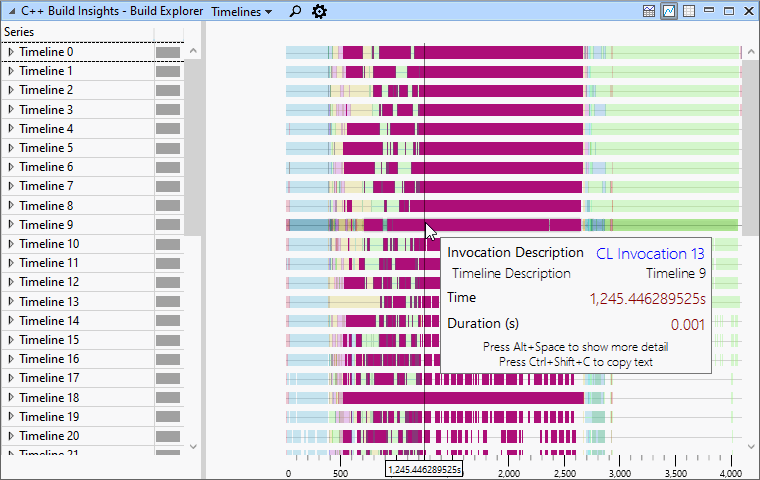
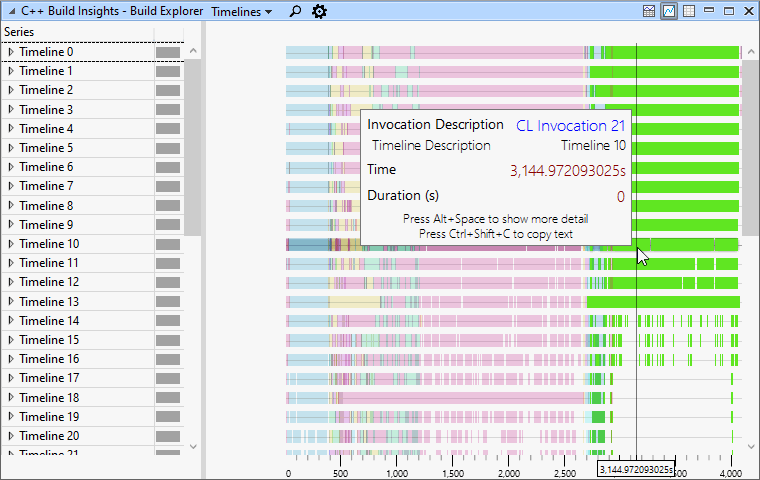
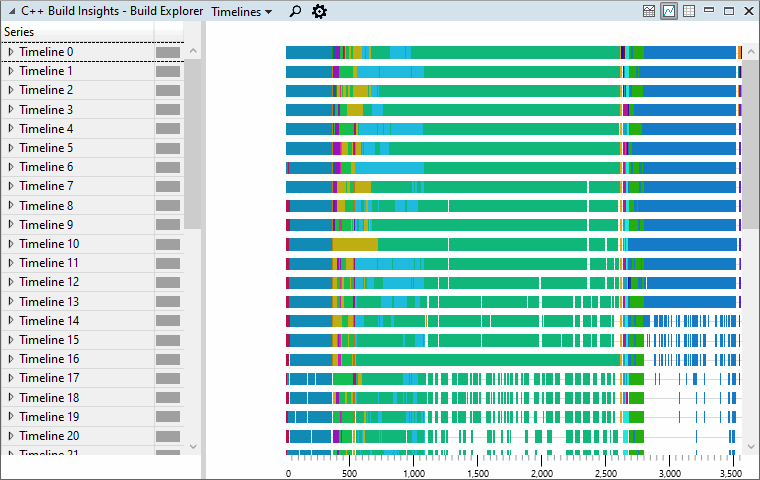
We start by bringing up the Build Explorer view and setting it to the Timelines preset. We notice that total build time is around 4,050 seconds based on the timeline at the bottom of the view. We also notice that there are 2 large CL invocations: one in the middle and one on the right. Their numbers are 13 and 21, respectively.
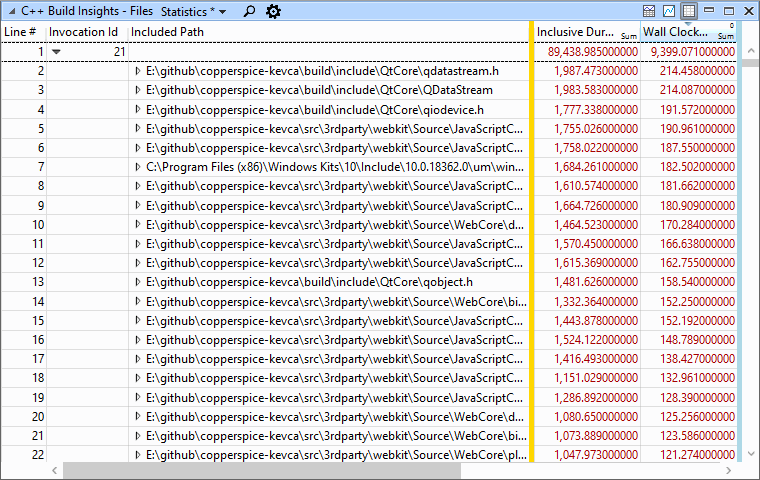
We think that there may be opportunities to speed up these invocations with a PCH, so we bring up the Files view and set it to the Statistics preset. The data shows that, indeed, a lot of time in our build is spent parsing headers.

Currently, the Files view is telling us the header parsing time for our build as a whole. We’d like to get a breakdown of parsing time for each invocation individually. To do so, we use the WPA grouping feature to group our data by invocation ID.
The data is now showing a lot of header parsing activity in invocation 21. The top header is qdatastream.h, with an aggregated inclusive parsing duration of 1,987 seconds. We’d like to know whether pre-compiling this header would be worth the effort, so we look at the Wall Clock Time Responsibility value on the right. The field indicates 214 wall clock time seconds. We decide that this is significant enough to proceed.
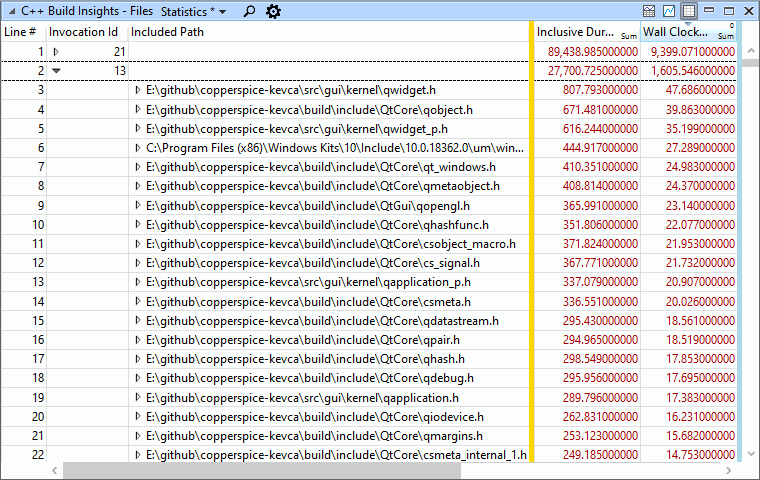
Before jumping into creating our PCH, we also look at the data for invocation 13. The aggregated parsing duration of 807 seconds for qwidget.h could have fooled us into thinking that it’s an excellent PCH candidate. However, WCTR tells us that we’d only save around 47 seconds. Most other headers from this invocation also have a low WCTR. Given this information, we decide that creating a PCH for invocation 13 is not worth it for now.
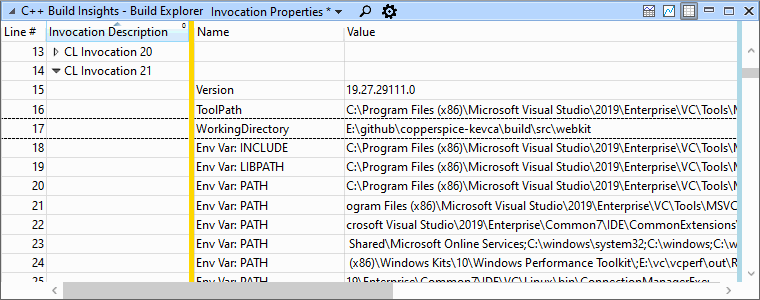
We want to start creating a PCH for invocation 21, but we first need to know which project this invocation corresponds to. We switch back to the Build Explorer view, but this time set it to the Invocation Properties preset to get more information on CL invocation 21. From the Working Directory property, we learn that the project we need to modify is in the webkit directory.
We make our way through the CopperSpice repository until we find the CMake configuration file for the webkit project. We use CMake 3.16’s PCH feature to configure the project to add qdatastream.h into a PCH, as we found out earlier that this is the top header for invocation 21. Feel free to look at our GitHub commit to see the necessary CMake change.
Now that we’ve created our PCH for invocation 21, we collect a new trace for a full rebuild of the copperspice.sln solution in the x64 Release configuration. When complete, we load the trace in WPA and excitedly summon the Build Explorer view. As expected, we notice a marked decrease in build time for our CL invocation. Our new total build time has dropped to 3,550, an improvement of 500 seconds, or 12%.
We also look at the Files view to notice that header parsing time has gone down in CL invocation 22. We see that a lot more has changed in the view than just the qdatastream.h header. That is because adding qdatastream.h to a PCH affected all headers that include it or its children. Now that we have an updated Files view that shows these effects, it would be a good time to continue our PCH by selecting the second header. For the purpose of this case study, we will stop here.
Note: due to MSBuild’s nondeterministic build order, invocation 21 from our previous trace has become invocation 22 in our second trace.
If you’ve been paying attention, you may have noticed that the 500 seconds we saved is greater than the expected WCTR value of 214 seconds for qdatastream.h. As explained at the beginning of this article, WCTR values for the inclusive parsing time of a header file tend to underestimate PCH time savings. Adding a header into a PCH typically causes all other headers it includes to also be in the PCH, causing additional time savings. It’s possible to use the C++ Build Insights SDK to derive a more accurate estimate by taking the file inclusion graph into account. We leave this as an exercise to the reader… or as a topic for a future article!
Understanding wall clock time responsibility
Wall clock time responsibility is a quantity defined by the following integral:
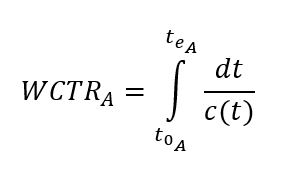
The symbols used in this formula are described below:
| WCTR_A | Wall clock time responsibility of an activity A. |
| t0_A | Start time of activity A. |
| te_A | End time of activity A. |
| c(t) | Function representing the number of concurrent activities at time t. |
As you can see, WCTR differs from a simple duration in that it takes into account build parallelism. Consider the simple build timeline shown below.
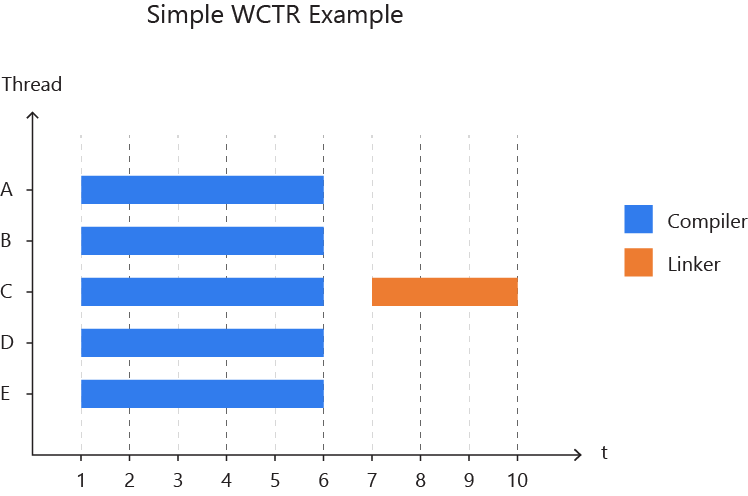
Let’s say we want to know how much time we waited on the compiler for this build. Looking at the timeline, it’s easy to tell that we waited 5 seconds. But how would we calculate this value if we couldn’t look at the timeline? We can’t just add up the durations of all compilers because the result would be 25. This is longer than the build itself, so it wouldn’t make any sense!
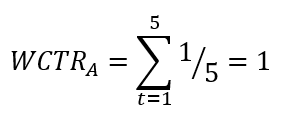
Wall clock time responsibility solves this conundrum by assuming that each compiler invocation is responsible for only a fraction of whatever else is going on at this particular time in the build. In this simple case, each compiler invocation is responsible for one fifth of their duration because there is a total of 5 concurrent compilers working at the same time. They each have a wall clock time responsibility of one second. Adding up the wall clock time responsibility of each compiler now results in the correct value of 5. More formally, the wall clock time responsibility of each compiler for this example is calculated using the following formula:
Real build timelines are never this simple! Let’s consider the slightly more complex example shown below.
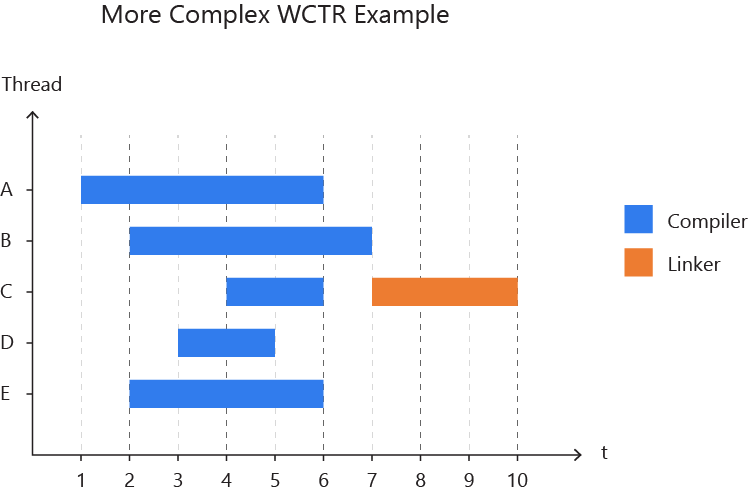
Again, it is trivial to tell at a glance that in this build we waited on the compiler for 6 seconds. But how could we derive this value without a picture of the timeline? By adding up their wall clock time responsibilities, of course!
In this case, we can’t just divide every compiler’s duration by 5 to obtain their WCTR because the number of concurrent compilers changes as time goes on. Instead, we do the computation second by second, and add the smaller results together as we go along. For example, the WCTR for the compiler on thread A is computed using the following formula:
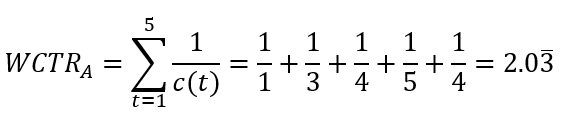
Between seconds 1 and 3, there is only one compiler invocation, so we divide by 1. Between seconds 2 and 3, there are 3 concurrent compiler invocations, so we divide by 3. We continue this process, adding each result together until we reach second 6, at which point the compiler invocation on thread A is over. If you use this process to compute the WCTR of all 5 compiler invocations, you’ll see that adding their WCTRs together gives the correct result of 6.
Tell us what you think!
In this article, we shared how to collect and view the wall clock time responsibility metric by using vcperf and WPA. We hope you’ll find this information useful, and that it’ll give you a better understanding of how time is really spent in your builds.
Have you used WCTR to tweak and tune your builds? Have you written your own application that makes use of this metric with the C++ Build Insights SDK? Let us know in the comments below, on Twitter (@VisualC), or via email at visualcpp@microsoft.com.
I tried to make an application using C++ Build Insights SDK for a job in rain gutter installers and it was amazing! I have a job!
I am getting an error when starting vcperf from an elevated command prompt (see below). The error indicate that there already is an ongoing trace.
The (helpful) error messages tells me to run tracelog -l, but the output from that command does not show any ongoing MSVC_BUILD_INSIGHTS_SESSION.
Could this error message also trigger on a different error condition?
<code>
Hello Johan,
In addition to the regular MSVC events, vcperf also requires kernel ETW events when performing an analysis. For this reason, you can see this error message if a kernel trace is already running on your system when executing the vcperf /start command. You can tell if this is the case by running the tracelog -l command in an elevated (won't work with regular) command prompt. If a session named NT Kernel Logger is found in the output, it means a kernel trace is currently being collected. You can stop a kernel trace by running the xperf -stop command in...
Hello Kevin and thanks for the reply.
xperf -stop did indeed to the trick! Thanks for your help.
May I suggest you also add this possibility to the error message when vcperf fails to start? (Or would you accept a PR?)
Hi Johan,
Happy to hear it! Yes, feel free to submit a PR and I will approve.
Thanks,
Kevin
PR submitted.
Without making any changes to the generated .sln file other than than setting /MP on, building everything on my machine took about 1400 seconds.
That’s probably because I have a two-CPU system with 16 physical cores that can run 32 copies of the compiler simultaneously.
So I guess the moral is “Get a real computer”.
Hi Steve,
Thanks for your comment. The case study in this blog post also makes use of /MP as a baseline, albeit with a less powerful machine. Even with a 32-core machine, you should be able to use the examples in this blog post to inspect WCTR values and create a PCH for even faster build speeds.
Cheers,
Kevin
Ok, that makes sense. However, my project, the TwoMisses hash table, builds in about 20 seconds with my current settings, so I’m not sure how much time I should spend on optimizing the build. 🙂
Well, that depends. What if you could bring that down to 10 seconds? 🙂
Well, since my regression tests take about 10 minutes to run, I don’t think that would make a noticeable difference in my overall work flow.
And during those regression tests, I use msbuild to build all of the different projects at once via -maxcpucount. That takes only about 30 seconds to build them all.
But I’ll definitely keep this new feature in mind for future projects if build times become an issue, as they obviously are with copperspice!
Thanks for the article! Based on your description I’ve created a little tool to calculate WCTR from ninja build logs: https://github.com/martinus/ninja2wctr
Awesome! Thanks for sharing!
Kevin