The creation of a precompiled header (PCH) is a proven strategy for improving build times. A PCH eliminates the need to repeatedly parse a frequently included header by processing it only once at the beginning of a build. The selection of headers to precompile has traditionally been viewed as a guessing game, but not anymore! In this article, we will show you how to use the vcperf analysis tool and the C++ Build Insights SDK to pinpoint the headers you should precompile for your project. We’ll walk you through building a PCH for the open source Irrlicht project, yielding a 40% build time improvement.
How to obtain and use vcperf
The examples in this article make use of vcperf, a tool that allows you to capture a trace of your build and to view it in the Windows Performance Analyzer (WPA). The latest version is available in Visual Studio 2019.
1. Follow these steps to obtain and configure vcperf and WPA:
- Download and install the latest Visual Studio 2019.
- Obtain WPA by downloading and installing the latest Windows ADK.
- Copy the perf_msvcbuildinsights.dll file from your Visual Studio 2019’s MSVC installation directory to your newly installed WPA directory. This file is the C++ Build Insights WPA add-in, which must be available to WPA for correctly displaying the C++ Build Insights events.
- MSVC’s installation directory is typically:
C:\Program Files (x86)\Microsoft Visual Studio\2019\{Edition}\VC\Tools\MSVC\{Version}\bin\Hostx64\x64. - WPA’s installation directory is typically:
C:\Program Files (x86)\Windows Kits\10\Windows Performance Toolkit.
- MSVC’s installation directory is typically:
- Open the perfcore.ini file in your WPA installation directory and add an entry for the perf_msvcbuildinsights.dll file. This tells WPA to load the C++ Build Insights add-in on startup.
You can also obtain the latest vcperf and WPA add-in by cloning and building the vcperf GitHub repository. Feel free to use your built copy in conjunction with Visual Studio 2019!
2. Follow these steps to collect a trace of your build:
- Open an elevated x64 Native Tools Command Prompt for VS 2019.
- Obtain a trace of your build:
- Run the following command:
vcperf /start MySessionName. - Build your C++ project from anywhere, even from within Visual Studio (vcperf collects events system-wide).
- Run the following command:
vcperf /stop MySessionName outputFile.etl. This command will stop the trace, analyze all events, and save everything in the outputFile.etl trace file.
- Run the following command:
- Open the trace you just collected in WPA.
Viewing header parsing information in WPA
C++ Build Insights provides a WPA view called Files that allows you to see the aggregated parsing time of all headers in your program. After opening your trace in WPA, you can open this view by dragging it from the Graph Explorer pane to the Analysis window, as shown below.
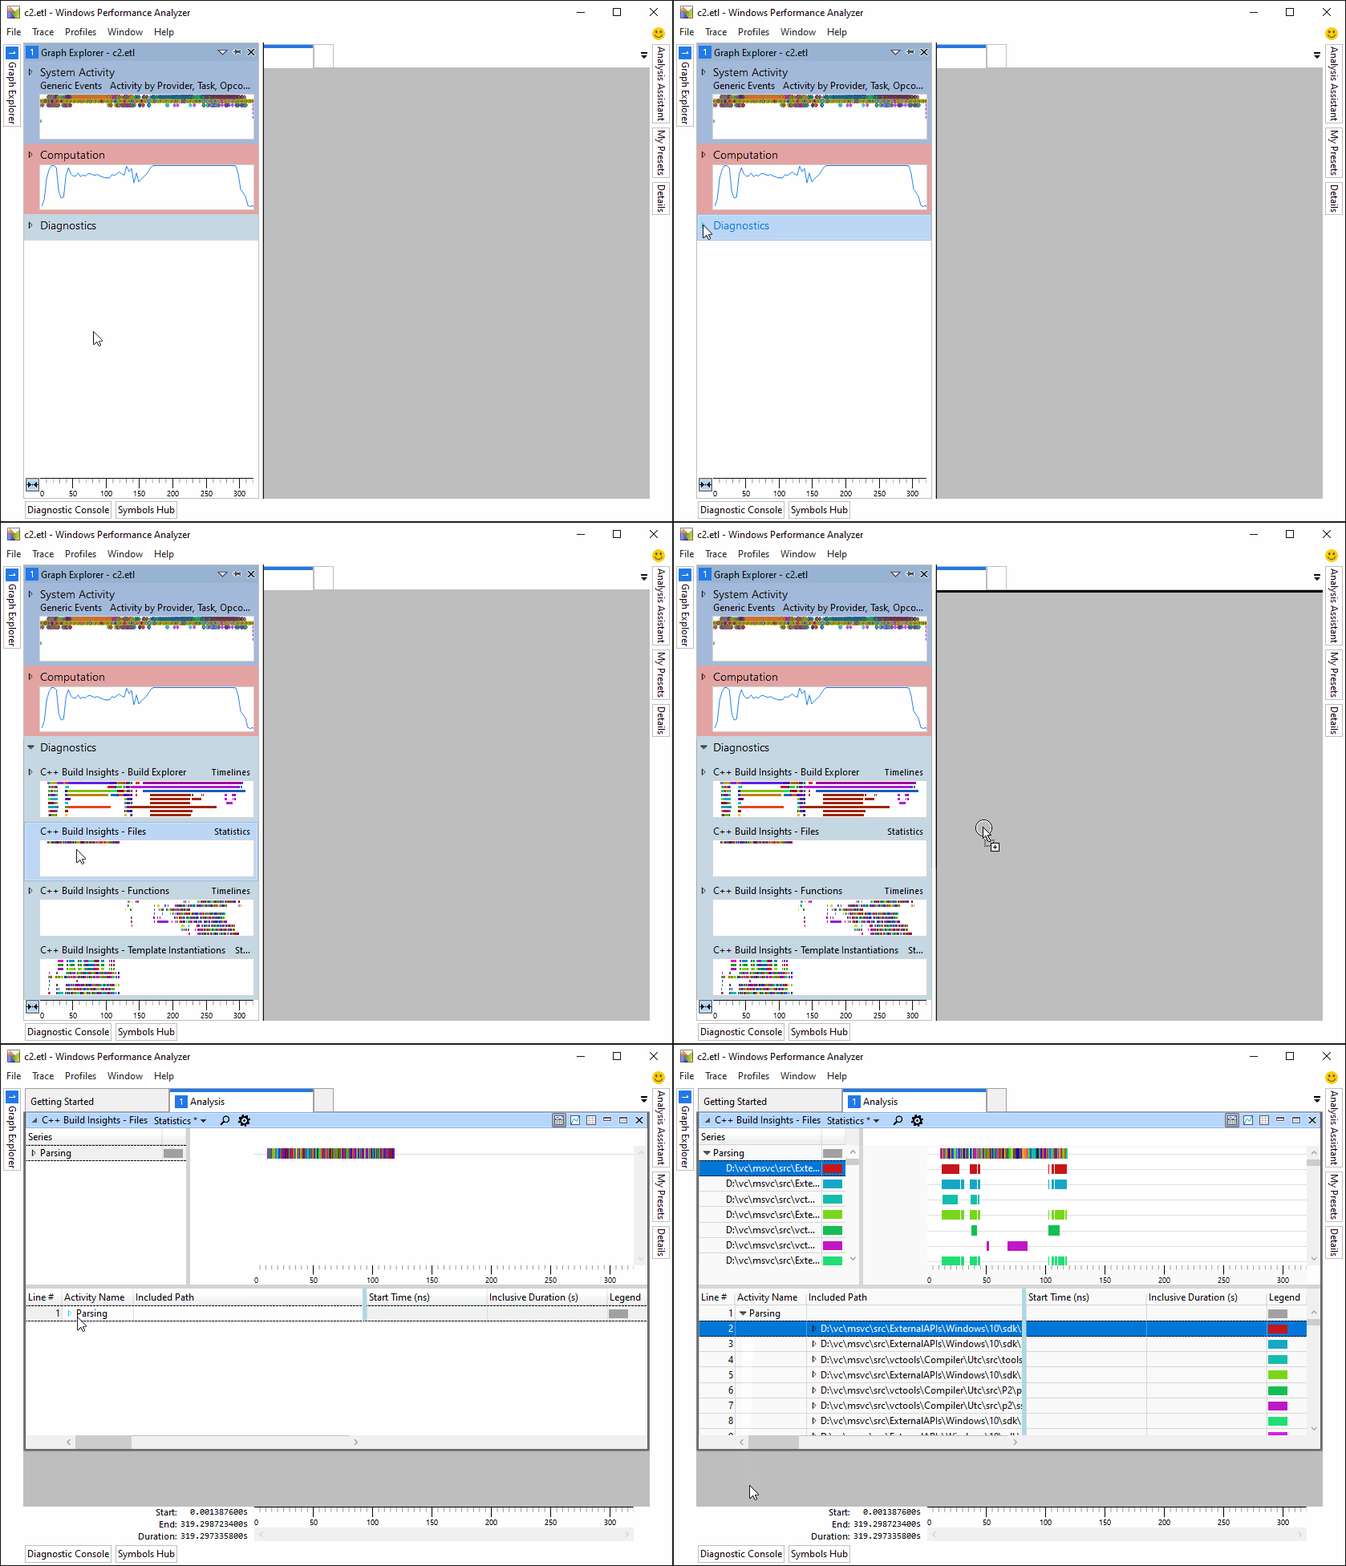
The most important columns in this view are the ones named Inclusive Duration and Count, which show the total aggregated parsing time of the corresponding header and the number of times it was included, respectively.
Case study: using vcperf and WPA to create a PCH for the Irrlicht 3D engine
In this case study, we show how to use vcperf and WPA to create a PCH for the Irrlicht open source project, making it build 40% faster.
Use these steps if you would like to follow along:
- Clone the Irrlicht repository from GitHub.
- Checkout the following commit:
97472da9c22ae4a. - Open an elevated x64 Native Tools Command Prompt for VS 2019 Preview command prompt and go to the location where you cloned the Irrlicht project.
- Type the following command:
devenv /upgrade .\source\Irrlicht\Irrlicht15.0.sln. This will update the solution to use the latest MSVC. - Download and install the DirectX Software Development Kit. This SDK is required to build the Irrlicht project.
- To avoid an error, you may need to uninstall the Microsoft Visual C++ 2010 x86 Redistributable and Microsoft Visual C++ 2010 x64 Redistributable components from your computer before installing the DirectX SDK. You can do so from the Add and remove programs settings page in Windows 10. They will be reinstalled by the DirectX SDK installer.
- Obtain a trace for a full rebuild of Irrlicht. From the repository’s root, run the following commands:
vcperf /start Irrlicht. This command will start the collection of a trace.msbuild /m /p:Platform=x64 /p:Configuration=Release .\source\Irrlicht\Irrlicht15.0.sln /t:Rebuild /p:BuildInParallel=true. This command will rebuild the Irrlicht project.vcperf /stop Irrlicht irrlicht.etl. This command will save a trace of the build in irrlicht.etl.
- Open the trace in WPA.
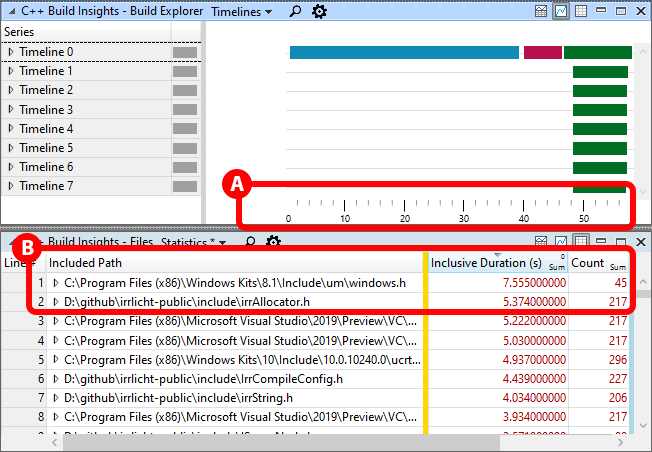
We open the Build Explorer and Files views one on top of the other, as shown below. The Build Explorer view indicates that the build lasted around 57 seconds. This can be seen by looking at the time axis at the bottom of the view (labeled A). The Files view shows that the headers with the highest aggregated parsing time were Windows.h and irrAllocator.h (labeled B). They were parsed 45 and 217 times, respectively.
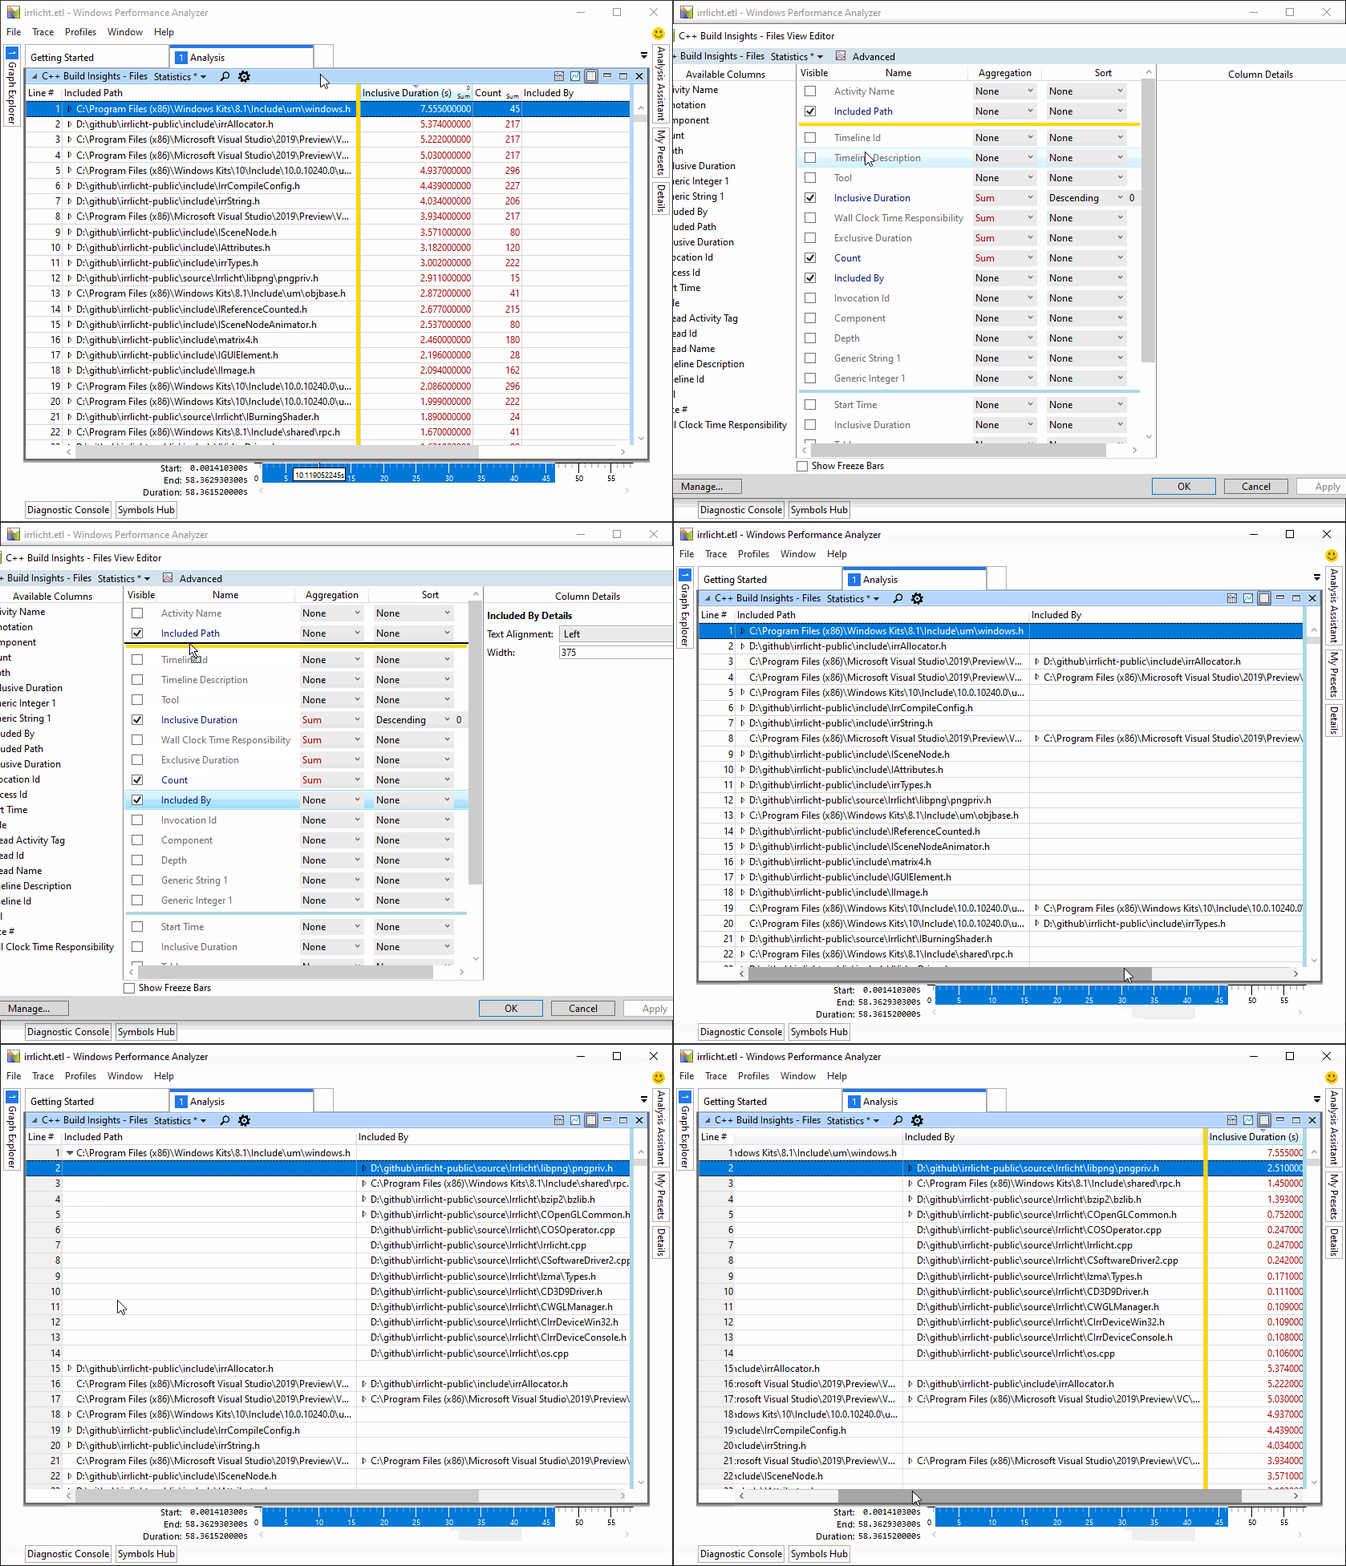
We can see where these headers were included from by rearranging the columns of the Files view to group by the IncludedBy field. This action is shown below.
Creating a PCH
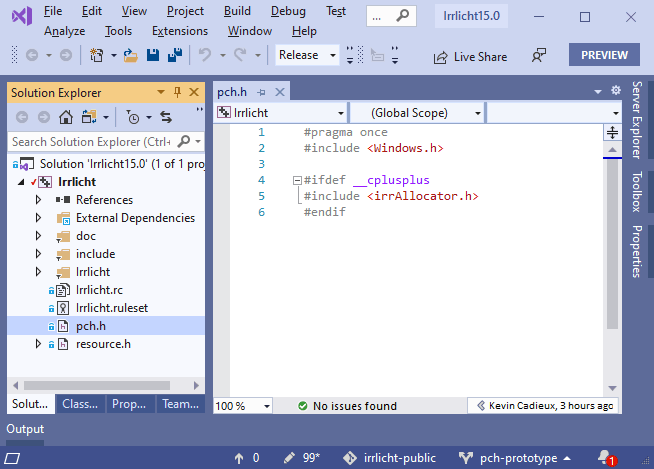
We first add a new pch.h file at the root of the solution. This header contains the files we want to precompile, and will be included by all C and C++ files in the Irrlicht solution. We only add the irrAllocator.h header when compiling C++ because it’s not compatible with C.
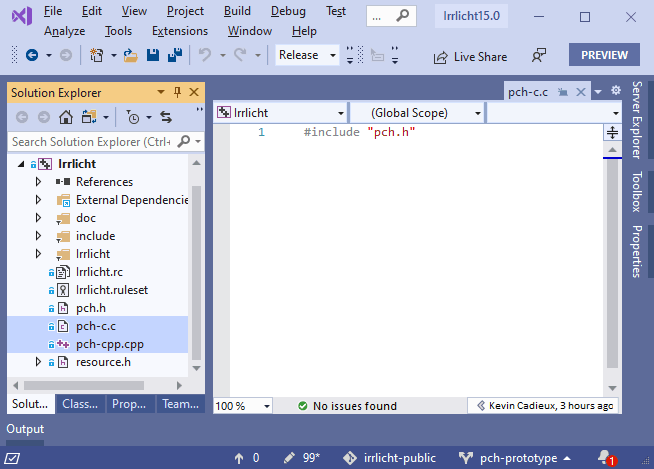
PCH files must be compiled before they can be used. Because the Irrlicht solution contains both C and C++ files, we need to create 2 versions of the PCH. We do so by adding the pch-cpp.cpp and pch-c.c files at the root of the solution. These files contain nothing more than an include directive for the pch.h header we created in the previous step.
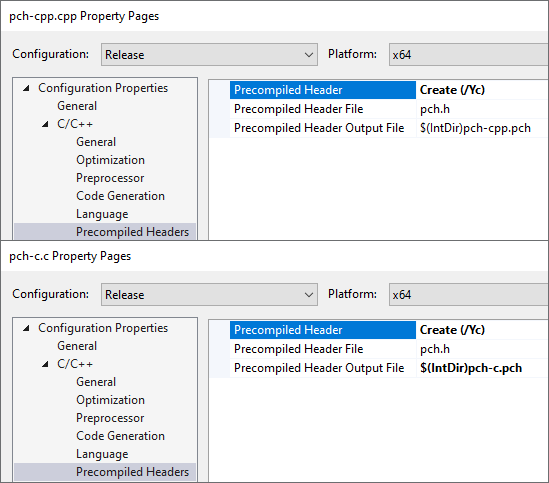
We modify the Precompiled Headers properties of the pch-cpp.cpp and pch-c.c files as shown below. This will tell Visual Studio to create our 2 PCH files.
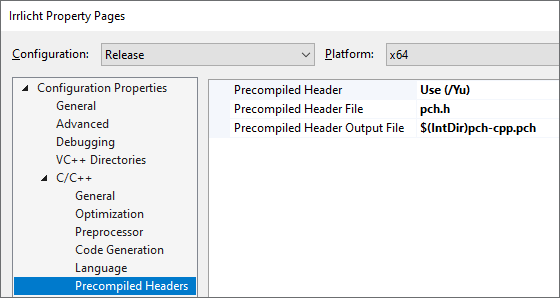
We modify the Precompiled Headers properties for the Irrlicht project as shown below. This will tell Visual Studio to use our C++ PCH when compiling the solution.
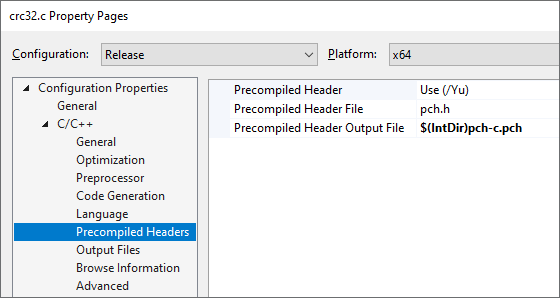
We modify the Precompiled Headers properties for all C files in the solution as follows. This tells Visual Studio to use the C version of the PCH when compiling these files.
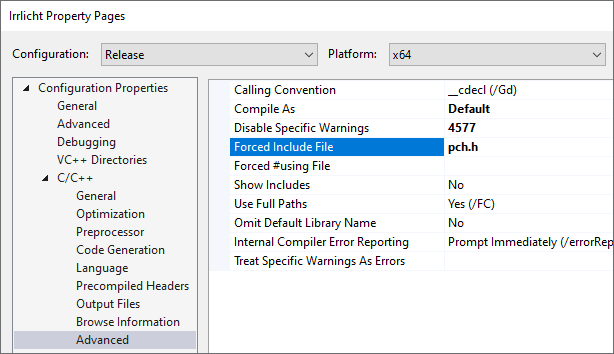
In order for our PCH to be used, we need to include the pch.h header in all our C and C++ files. For simplicity, we do this by modifying the Advanced C/C++ properties for the Irrlicht project to use the /FI compiler option. This change results in pch.h being included at the beginning of every file in the solution even if we don’t explicitly add an include directive.
A couple of code fixes need to be applied for the project to build correctly following the creation of our PCH:
- Add a preprocessor definition for HAVE_BOOLEAN for the entire Irrlicht project.
- Undefine the far preprocessor definition in 2 files.
For the full list of changes, see our fork on GitHub.
Evaluating the final result
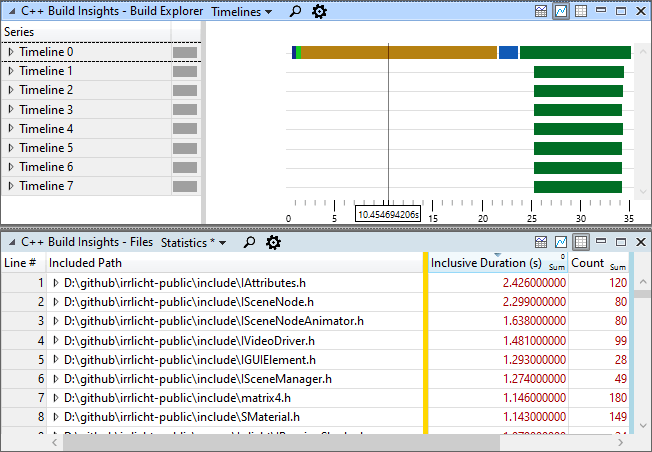
After creating the PCH, we collect a new vcperf trace of a full rebuild of Irrlicht by following the steps in the Case study: using vcperf and WPA to create a PCH for an open source project section. We notice that the build time has gone from 57 seconds to 35 seconds, an improvement of around 40%. We also notice that Windows.h and irrAllocator.h no longer show up in the Files view as top contributors to parsing time.
Getting PCH suggestions using the C++ Build Insights SDK
Most analysis tasks performed manually with vcperf and WPA can also be performed programmatically using the C++ Build Insights SDK. As a companion to this article, we’ve prepared the TopHeaders SDK sample. It prints out the header files that have the highest aggregated parsing times, along with their percentage weight in relation to total compiler front-end time. It also prints out the total number of translation units each header is included in.
Let’s repeat the Irrlicht case study from the previous section, but this time by using the TopHeaders sample to see what it finds. Use these steps if you want to follow along:
- Clone the C++ Build Insights SDK samples GitHub repository on your machine.
- Build the Samples.sln solution, targeting the desired architecture (x86 or x64), and using the desired configuration (debug or release). The sample’s executable will be placed in the
out/{architecture}/{configuration}/TopHeadersfolder, starting from the root of the repository. - Follow the steps from the Case study: using vcperf and WPA to create a PCH for the Irrlicht 3D engine section to collect a trace of the Irrlicht solution rebuild. Use the
vcperf /stopnoanalyze Irrlicht irrlicht-raw.etlcommand instead of the/stopcommand when stopping your trace. This will produce an unprocessed trace file that is suitable to be used by the SDK. - Pass the irrlicht-raw.etl trace as the first argument to the TopHeaders executable.
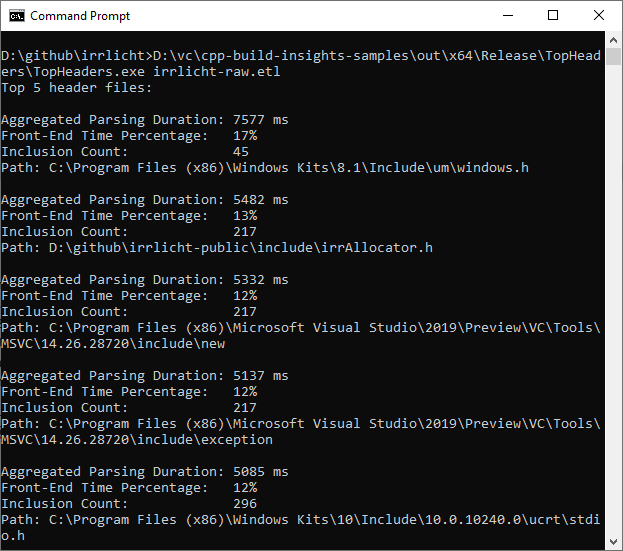
As shown below, TopHeaders correctly identifies both Windows.h and irrAllocator.h as top contributors to parsing time. We can see that they were included in 45 and 217 translation units, respectively, as we had already seen in WPA.
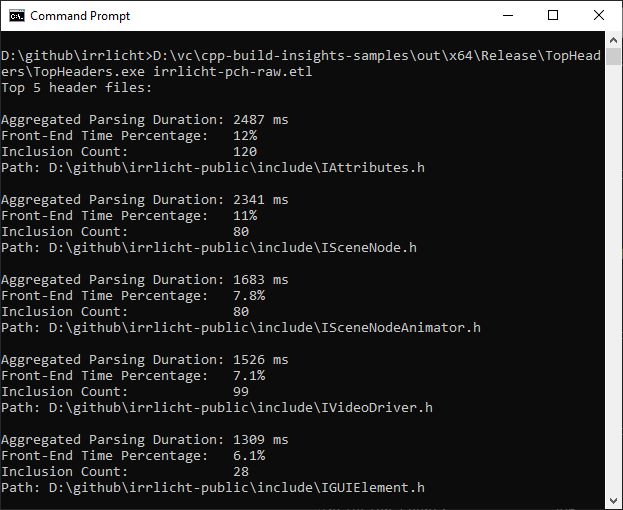
Rerunning TopHeaders on our fixed codebase shows that the Windows.h and irrAllocator.h headers are no longer a concern. We see that several other headers have also disappeared from the list. These headers are referenced by irrAllocator.h, and were included in the PCH by proxy of irrAllocator.h.
Understanding the sample code
We first filter all stop activity events and only keep front-end file and front-end pass events. We ask the C++ Build Insights SDK to unwind the event stack for us in the case of front-end file events. This is done by calling MatchEventStackInMemberFunction, which will grab the events from the stack that match the signature of TopHeaders::OnStopFile. When we have a front-end pass event, we simply keep track of total front-end time directly.
AnalysisControl OnStopActivity(const EventStack& eventStack) override
{
    switch (eventStack.Back().EventId())
    {
    case EVENT_ID_FRONT_END_FILE:
        MatchEventStackInMemberFunction(eventStack, this,
            &TopHeaders::OnStopFile);
        break;

    case EVENT_ID_FRONT_END_PASS:
        // Keep track of the overall front-end aggregated duration.
        // We use this value when determining how significant is
        // a header's total parsing time when compared to the total
        // front-end time.
        frontEndAggregatedDuration_ += eventStack.Back().Duration();
        break;

    default:
        break;
    }

    return AnalysisControl::CONTINUE;
}
We use the OnStopFile function to aggregate parsing time for all headers into our std::unordered_map fileInfo_ structure. We also keep track of the total number of translation units that include the file, as well as the path of the header.
AnalysisControl OnStopFile(FrontEndPass fe, FrontEndFile file)
{
    // Make the path lowercase for comparing
    std::string path = file.Path();

    std::transform(path.begin(), path.end(), path.begin(),
        [](unsigned char c) { return std::tolower(c); });

    auto result = fileInfo_.try_emplace(std::move(path), FileInfo{});

    auto it = result.first;
    bool wasInserted = result.second;

    FileInfo& fi = it->second;

    fi.PassIds.insert(fe.EventInstanceId());
    fi.TotalParsingTime += file.Duration();

    if (result.second) {
        fi.Path = file.Path();
    }

    return AnalysisControl::CONTINUE;
}
At the end of the analysis, we print out the information that we have collected for the headers that have the highest aggregated parsing time.
AnalysisControl OnEndAnalysis() override
{
    using namespace std::chrono;

    auto topHeaders = GetTopHeaders();

    if (headerCountToDump_ == 1) {
        std::cout << "Top header file:";
    }
    else {
        std::cout << "Top " << headerCountToDump_ <<
            " header files:";
    }

    std::cout << std::endl << std::endl;

    for (auto& info : topHeaders)
    {
        double frontEndPercentage =
            static_cast<double>(info.TotalParsingTime.count()) /
            frontEndAggregatedDuration_.count() * 100.;

        std::cout << "Aggregated Parsing Duration: " <<
            duration_cast<milliseconds>(
                info.TotalParsingTime).count() <<
            " ms" << std::endl;
        std::cout << "Front-End Time Percentage:   " <<
            std::setprecision(2) << frontEndPercentage << "% " <<
            std::endl;
        std::cout << "Inclusion Count:             " <<
            info.PassIds.size() << std::endl;
        std::cout << "Path: " <<
            info.Path << std::endl << std::endl;
    }

    return AnalysisControl::CONTINUE;
}
Tell us what you think!
We hope the information in this article has helped you understand how to use C++ Build Insights to create new precompiled headers, or to optimize existing ones.
Give vcperf a try today by downloading the latest version of Visual Studio 2019, or by cloning the tool directly from the vcperf Github repository. Try out the TopHeaders sample from this article by cloning the C++ Build Insights samples repository from GitHub, or refer to the official C++ Build Insights SDK documentation to build your own analysis tools.
Have you been able to improve your build times with the header file information provided by vcperf or the C++ Build Insights SDK? Let us know in the comments below, on Twitter (@VisualC), or via email at visualcpp@microsoft.com.

Great article! Thanks for sharing this! I'm super excited to try this out, but when I open the .etl file with WPA, I do not see the "Diagnostics" section.
First I installed Visual Studio 2019 Version 16.6.1, and WPA Version 10.0.19041.1 (WinBuild.160101.0800). I tried capturing a trace and analyzing without placing perf_msvcbuildinsights.dll in the Performance Toolkit folder because a dll of that name was already present with the WPA that I installed. Opening the resulting .etl file, I only see "System Activity" and "Computation".
Then I went back and placed my VS2019 perf_msvcbuildinsights.dll in C:\Program Files (x86)\Windows Kits\10\Windows Performance Toolkit, and...
Thanks!
I obtained the same version of WPA and VS as you are using and am able to collect and view a trace.
The most common reasons why no C++ Build Insights views are present under Diagnostics are:
1. Tracing an unsupported toolset. You said that you downloaded VS 2019 16.6.1, but are you also building your C++ project with this version? Sometimes people download the latest version of VS to get vcperf but their project is actually built using an older toolset. vcperf will only work for projects that are built with VS 2017 15.9 and above.
2. Not installing the WPA...
Thanks for the great tips Kevin! Our projects are built with VS 2015 toolset, and I confirmed that building using VS 2017 toolset allowed the Diagnostics view to show up!
It is also great to know how to verify if the WPA addin was installed correctly.
Thanks again!
You’re welcome! Consider upgrading to the latest toolset for building your projects. Not only does it come with improved linker performance, but also has the new C++ Build Insights template instantiation events.
This tool is very impressive, great job !
Can you explain the difference between inclusive and exclusive duration ?
I have some files were: Count * exclusive < inclusive. What could be a logical explanation for such behaviour
Hi Paltoquet,
If A includes B and C, the inclusive duration of A is the time it takes to parse A and its inclusions B and C (i.e. the entire inclusion hierarchy rooted at A). The exclusive duration would be the time that was spent parsing only A, excluding the children B and C. As such, exclusive will always be smaller than inclusive. Does this answer your question?
Too large PCH files also make the build slow. What’s the best way to start analyzing in legacy projects when a PCH file already exists? Is there a recommendation for this?
I would suggest capturing a trace with the PCH disabled and building it again from scratch.
However if you just disable the PCH some headers will be included everywhere even when it's not required. This might skew your results. The most accurate method would be to temporarily revert back to including individual headers only where they are needed if it's not too much work.
If it's too much work, you could keep including the headers everywhere but remove from the PCH the ones that don't show up high in WPA. This way you can at least avoid triggering a full rebuild when...
Nice tool, good article! But why isn’t PCH optimization already an integral part of VisualStudio?
PCH optimization requires build time metrics to be done accurately and before Build Insights we didn’t have easy access to those metrics for a full rebuild. There is a suggestion on Developer Community to integrate C++ Build Insights in the IDE. Feel free to upvote it if that’s something you are interested in:
https://developercommunity.visualstudio.com/idea/810960/have-full-integration-of-build-insights-within-vis.html
Great article! I was able to reduce build time 30% in a project which already has precompiled headers.
Before this article, I used to choose the most repeated headers. Now I know how to choose the best headers in order to reduce build time.
Great tool! Thanks!
Very great tool, i reduce my build duration from 25 minutes to 10 minutes.
With precompile header I increase the perf by ~40%, was spending 6 minutes inside mscvc/xxatomic.h
With the timeline tool i target specific modules to compile using unity build, i also gained 2 minutes.
Thanks
That’s awesome! Thanks for letting us know.
You’re welcome! Thanks for letting us know about your success with the tool!