
We made improvements to C++ link time earlier in Visual Studio 2019, and we have more improvements to tell you about. As of version 16.7, we measure up to 5X improvement in some incremental linking and debugging scenarios and up to a 1.5X speedup in full linking. These represent some of the improvements The Coalition saw in their recent experiment. Keep reading to find out the details.
After the link time improvements in versions 16.0 and 16.2, we took a step back and re-evaluated the complete edit-build-debug (“inner loop”) experience of C++ developers. We were still looking at large projects like AAA games and Chrome because large projects are most likely to suffer from longer iteration times. We found a couple of opportunities that looked promising and went after them. The first, in Visual Studio 2019 version 16.6, is an improvement to some of the algorithms inside the Program Database (PDB) and Debug Interface Access (DIA) components, which are the libraries that enable writing and reading debug information respectively. The second, in Visual Studio 2019 version 16.7, is an optimization to speed up the worst case Incremental Linking time, which can be as bad as or worse than a full link.
Faster Debug Information
Program Database (PDB) creation is often the bottleneck when linking binaries, and for large, monolithic codebases, linking ends up being a very long pole at the end of the critical path. Furthermore, PDB reading is a significant contributor to delays when debugging large projects. It features prominently in profiles when hitting breakpoints and single-stepping—particularly when the developer has multiple debug windows like the Call Stack and Watch windows open in Visual Studio.
In our private benchmarks, these improvements showed some big gains in AAA Games and other large scenarios. The following chart has some examples of the improvements we saw.
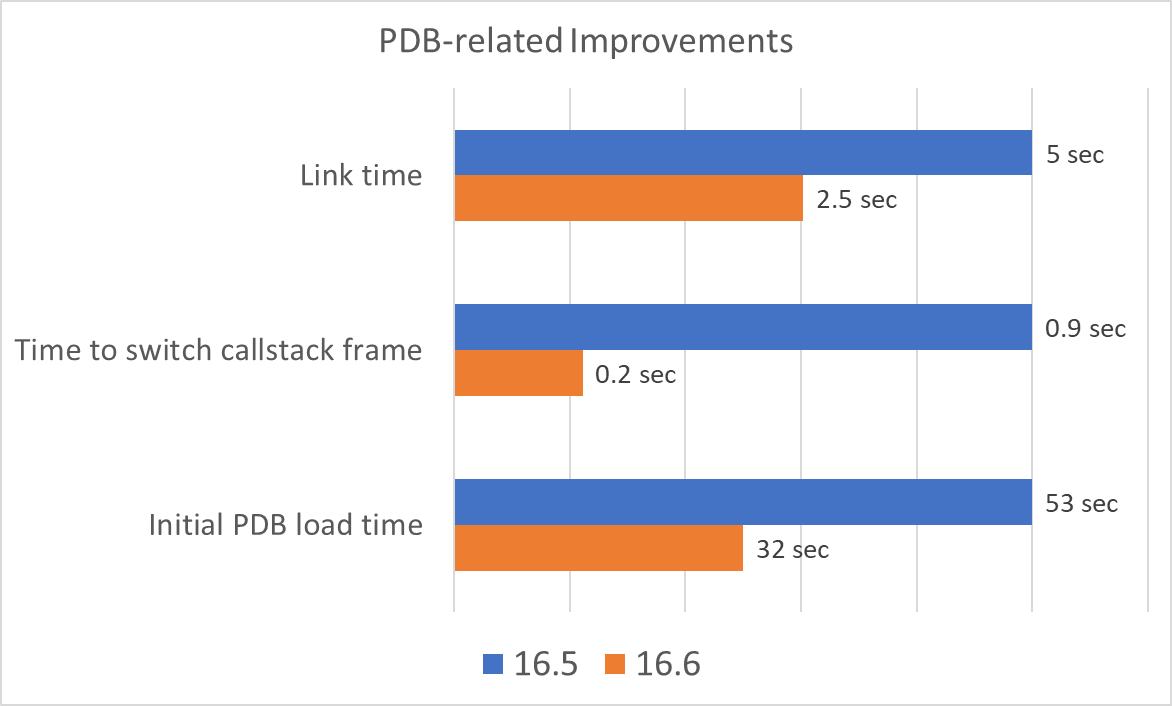
Note that the absolute time deltas in the chart are examples taken from different projects. However, all are indicative of the type of speedup we saw across multiple projects. That is, they are not cherry-picked outliers. To summarize, we often saw:
- Up to 1.5X speedup for full linking
- Up to 4X speedup in switching active function on call stack with many variables
- 2X speedup of initial PDB load
Perhaps more compelling, though, is that since version 16.6 was released, the time to enter break state after a single step is faster by about 2X on average. The actual benefit depends on the size of your project and the number of debugger windows (watch, callstack, etc.) you have open, but the good news is that users who encountered stepping delays in the past are likely to notice improvements in version 16.6.
What We Did
For version 16.6, we profiled some common developer scenarios and found several opportunities to improve the code that both reads and writes debug information. Below are some examples of the types of algorithmic improvements we made.
- Avoid search by Relative Virtual Address (RVA) by caching the result of the previous request, which in 99% of cases uses the same RVA
- Compute older CRC-32 hash for type records on-demand (gives the most speedup in /Zi full link)
- Create fast-path for the VS debugger’s query pattern
- Improve memory-mapped file reading by using AVX-based memcpy tuned for multiples of the page size
- Use C++ std::sort instead of qsort
- Use integer division by a constant (e.g. page size) rather than division by a variable
- Reuse rather than rebuild hash tables
- Avoid virtual function calls and manually inline code for the two most common symbol lookups
- Prefetch PDB data in some cases
Note that the first item, caching the previous request’s result, was responsible for the vast majority of the PDB reading wins.
Better Worst-case Incremental Linking
Incremental linking is one of the most time-saving features of our toolset. It allows developers to iterate quickly when making common source changes in large projects by reusing most of the results of earlier links and strategically applying the differences made in the last source edit. However, it can’t accommodate all source changes and will sometimes be forced to fall back on full linking, which means the overall incremental link time can actually be worse than a full link, since incremental linking will spend time figuring out it can’t proceed before starting over from scratch. It makes sense that high-impact edits, like changing compiler or linker options or touching a widely-included header file require a rebuild, but simply adding a new object (.obj) file will also trigger a full re-link. For many developers, this isn’t a big deal since they rarely add new object files and/or full linking isn’t terribly long anyway. However, if you work on large binaries or you use a coding style or project system (like some variants of a Unity build) that commonly results in object files being added or removed, the hit to incremental link time can be tens of seconds or more. Unfortunately, these limitations are fundamental to the design of incremental linking and removing them would mean slowing down the most common case that incremental linking is optimized for: simple source edits to small numbers of existing translation units.
Type Merge Cache
In version 16.7, though we couldn’t reasonably make incremental linking work in more cases, we realized that we could improve how long it takes to link when we must fall back on full linking. The key insights were:
- Most of the time for a full link is spent generating debug information, and
- Generating correct debug information is much more forgiving than correctly linking an executable binary.
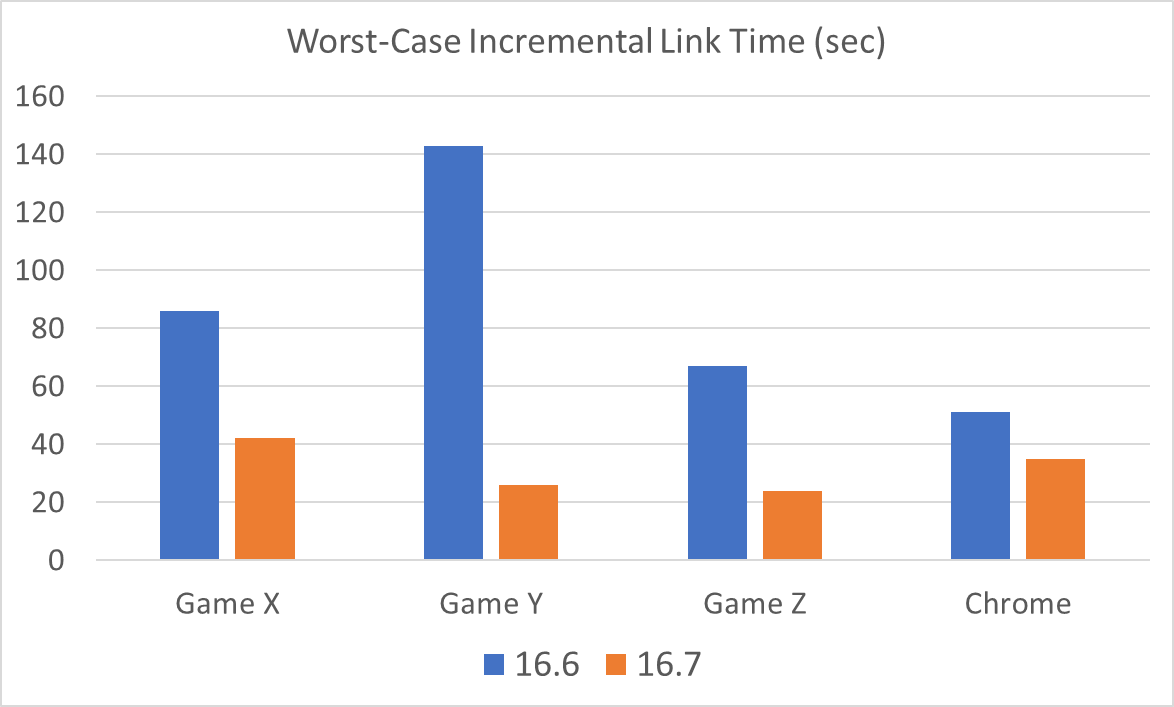
Conceptually similar to how incremental linking works, we added the ability to cache the results of earlier debug information generation (specifically, the result of type merging) and reuse that during subsequent links. This technique can mean drastic speedups (2X-5X) in link time when incremental linking falls back on full linking. The following chart has some examples of the impact on three AAA Game projects and Chrome.
This caching does have some downsides, though:
- The cached data is stored in the PDB file, which is therefore larger, and
- The first (clean) link of an incremental build takes slightly longer since the cache must be built up.
The following table captures the benefits as well as downsides for the above projects.
| Initial link time | PDB size | Subsequent full link time | |
| Game X | 10% | 35.1% | -48.8% |
| Game Y | 1.4% | 31.8% | -81.1% |
| Game Z | 3.4% | 27.9% | -64.2% |
| Chrome | 10.9% | 10.1% | -29.4% |
The “Subsequent full link time” column corresponds to a scenario where incremental linking is enabled (/INCREMENTAL) but had to fall back on full linking, such as when a new object file is introduced. As you can see, the impact of this new cache can be substantial when the full link time is measured in tens of seconds or minutes.
It’s interesting to note that the cache could be used for any full linking scenarios, not just the case when incremental linking must fall back to a full link. However, because of the drawbacks, it’s only on-by-default when incremental linking is used. Release builds and builds where incremental linking is disabled (/INCREMENTAL:NO) won’t see an impact unless the new /PDBTMCACHE linker switch is specified. Similarly, the /PDBTMCACHE:NO switch can be used to disable the cache creation and return to version 16.6 behavior if desired. Note that the linker does not rely on the presence of the cache. If the cache is present and passes validation, the linker will use it to accelerate linking, but a missing cache or a cache that has been invalidated is silently ignored.
Future work
We know there are at least a few people for whom the PDB size impact of the Type Merge Cache will be a concern, so, in the future, we might consider placing the cache in a separate file. We didn’t put it in the incremental link file (.ilk) because the feature isn’t fundamentally tied to incremental linking—that’s why there is a switch to control it independently.
In a future blog post, we’ll share the details of further link time improvements in version 16.8!
Upgrade today and let us know about the difference you see
We profiled developer inner loops in several scenarios that we track, and we tamped down a couple of hot spots that stood out in PDB reading and writing and incremental link fall-back. Did you notice a difference when upgrading from version 16.5 or earlier to 16.6 and/or 16.7? If so, we’d love to hear about them in the comments below or via email (visualcpp@microsoft.com). If you’ve got a problem or would like to share other feedback, please use Help > Send Feedback > Report A Problem / Provide A Suggestion in Visual Studio or go to Developer Community. You can also find us on Twitter (@VisualC)). And, of course, if you haven’t tried Visual Studio 2019 yet, we’d love for you to download it and give it a try.
This at least makes me excited that to know that something has changed and I'm not imagining things. So: is there a tool that can inspect PDB files to look for corruption? Starting with 16.8 I have seen many cases where VS and WinDbg both report corrupt debug records for some functions (but not all). It seems to be related to the fact that for most of our builds we use the Hostx86 cl.exe and link.exe (because the PCH files generated by the Hostx64 toolchain are too large), but the 64bit mspdbsrv.exe (because the 32bit version exhausts address space). For...
I've had issues with the PDB size increasing with every build, especially when touching a header file impacting many obj. The PDB could increase of more than 100MB with every change -> build iteration, quickly causing a compilation error because the PDB is >4GB, forcing to delete it manually.
Also, an issue is that depending of the amount of change, the incremental link is now longer than a full link. When impacting 100 obj on our project, an incremental link is ~2 minutes, when the full link is 30s (with unity/jumbo builds, I even managed to have incremental links >...
Have you reported this on Developer Community yet? I’m also seeing the perpetually increasing PDB size issue.
The pdb file size is limited to 4GB(in practice ‘a big MMO Game’:The limit was exceeded compiling with debug:fastlink)
when compiling with debug:fastlink .
we decreased pdb size by striping ‘DEBUG_S_SYMBOL’ .the debugger still works on the pdb!!!
so what does ‘DEBUG_S_SYMBOL’ mean?