
On the C++ team we’ve heard loud and clear from users that build times are a pain point. We’ve continued our focus on improving the step, linking, that dominates F5 build times. Fast F5 build times, or iteration build times, are a key contributor to developer productivity and we felt that there was a large opportunity so we narrowed in on changes that we felt could move the needle 2x or more. This is on top of the significant improvements we made to the tool chain to speed up link times in the Visual Studio 2019 version 16.0 release. Let me give a teaser of the kinds of wins we were able to achieve.
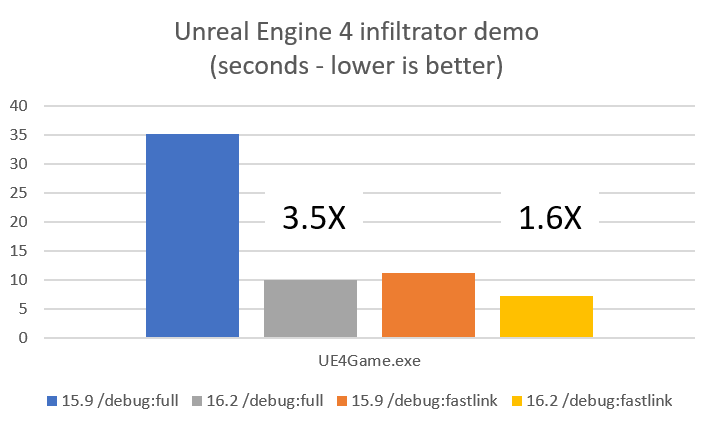
This shows a 3.5X win in 16.2 vs. 15.9 for a /debug:full build of the release configuration of the UE4 infiltrator demo and a 1.6X win using /debug:fastlink. This is a middle of the road win given the other workloads we measured. The fastlink win in particular was a little weak. So what did we do? We went back to basics.
What did we do: Improved Fundamentals
Link.exe is responsible for combining a disparate and large set of data into the executable and PDB and is fundamentally a serial process (mostly). After our changes in VS2019 16.0 to reduce the size of the debug input, as well as improvements to our type hashing strategy, we went back to basics and improved our core data structure and algorithm implementations. With this change all our internal data structures have been updated to give better cache performance and memory utilization, as well as implement aggressive memoization of intermediate data to eliminate redundant computation. These changes are at the base of the linker and the entire C++ ecosystem and, happily, show wins across nearly all the scenarios we track. Do you use /debug:full? It’s faster. Do you use /debug:fastlink? It’s faster too. Additionally, recompile scenarios that use link /incremental also follow the trend and are faster as well.
A key objective with these changes, as with any changes we make to the MSVC toolset, was to maintain compatibility. All of the changes we made preserved interoperability so if you have an older library or PDB that is binary compatible with VS everything will continue to work.
Show me the numbers
One of our key outcomes we wanted from this effort was to improve iteration build times for our largest inputs. These typically are large dlls or exes that combine a large number of objs with static libs and other components. There are a lot of places where project sizes get big, but there were two main areas where we found good examples to analyze and improve.
Open Source Projects
There are several large OSS projects that we track for general correctness representative of long link times. For each of the workloads below we looked through the builds and found the link command that took the most time, and then created a link repro for it. To model the single obj rebuild and link time each of these link repros were then run in isolation. The times below are for each of the individual link repros and show the comparison between VS 2017 15.9 and VS 2019 16.2 Preview 2 “all up”. Note: the tables are split out into one for Debug time as well as one for Release with debug info time, also a description of /debug:fastlink is available on the VC blog.
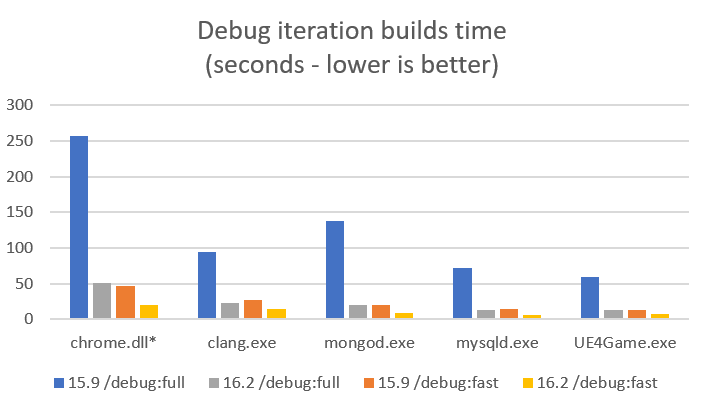
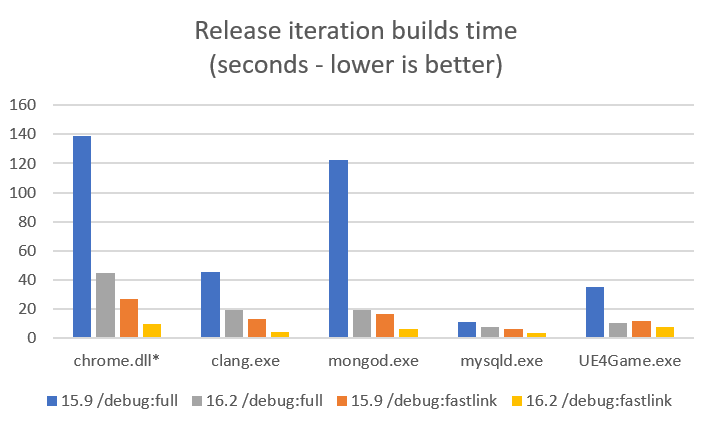
These are the links to the source of the workloads we used in the above experiments.
- Chrome (commit 2a88e68bd7498b185675098bcd0addf2c7b7808 ) * this is an older time stamp that still builds with MSVC.
- Clang
- MongoDB
- MySQL
- UE4Game (requires github signin and approval)
AAA Games
Many AAA games are great examples of large monolithic exes, and because we worked closely with some of the game studios working on AAA titles for Xbox One we can show numbers – but with the names removed. “Beta” and “Charlie” are large games that showed long link times and are representative of large production C++ source bases. These were some of our most challenging linker inputs.
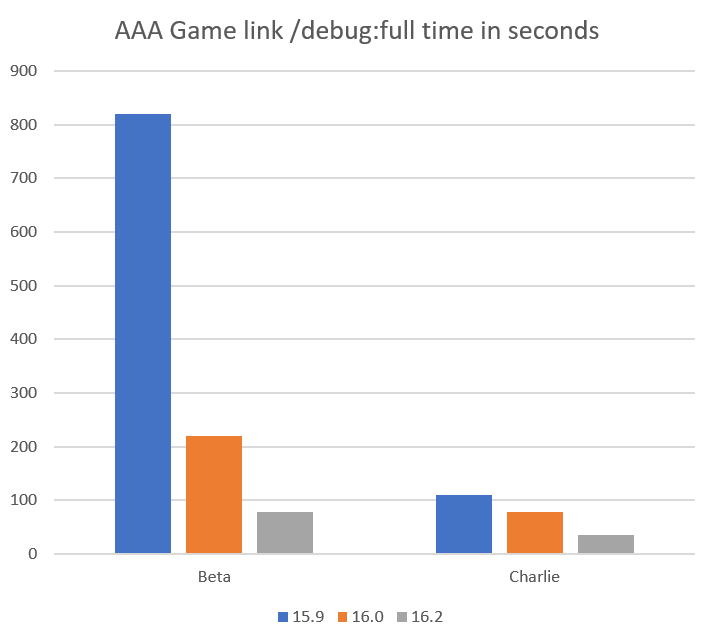
As you can see from the graph the improvements can scale with the size of the input. This can change depending on project specifics but we see this general trend across all the data.
Here’s the Summary
We did a major renovation and cleanup of the component that is the dominant part of the iteration build time. These changes show wins in the 2X range for /debug:fastlink and /incremental, while /debug:full is typically 3X-6X and up. (We’ve seen 10X wins on some workloads). These wins will show up in a wide variety of workloads and are fully compatible with other binaries produced by MSVC.
Is there any more?
Link times still dominate F5 and we’re still looking for ways to speed this up. At this point we think that a lot of the low hanging fruit is plucked so we are focusing on how the toolchain as a whole manages intermediate build products and debug info, so stay tuned for more.
Take it for a test drive
We’d love for you to download Visual Studio 2019 16.2 and give it a try. As always, we welcome your feedback. We can be reached via the comments below or via email (visualcpp@microsoft.com). If you encounter problems with Visual Studio or MSVC, or have a suggestion for us, please let us know through Help > Send Feedback > Report A Problem / Provide a Suggestion in the product, or via Developer Community. You can also find us on Twitter (@VisualC) and Facebook (msftvisualcpp).
Just saw that in your Hostx64\x64 folder you have tbbmalloc.dll since 14.22.27905 compilers (I usually install all compilers). Simply wondering, was memory allocation an issue? (Assuming it was done through multiple threads).
Also what led to the choice of tbbmalloc, vs say jemalloc, or others – how about Microsoft’s own – https://github.com/microsoft/mimalloc
Simply asking, as someone who run into this problem, and with the help of mimalloc we were able to aleviate our problems.
Thanks!
Great news. We have a 100+ project based application using DLL’s. Recently we discovered that using static libraries might gain a 15% performance increase in certain scenario’s. Unfortunately the linking is really slow for release builds (> 5 minutes). We are still using the 14.14 toolset since going to another toolset / Visual Studio takes time which is always scarce.
It seems a bit weird that the intro says these are gains on top of the 16.0 release, but that all the charts compare to the 15.9 release. How much of the changes to the “fundamentals” counts toward the 3.5x improvement versus how much came from the 15.9->16.0 upgrade?
Not sure if this was in the original article but towards the end, there’s this chart that compares 15.9, 16.0, and 16.2. The intro did come off as a bit manipulative.
Sorry this came off as shady. I was really trying to make sure that the cursory reader was getting a clear message about the size of the win to be had from upgrading to 16.2 from 15.9. We went through a bunch of iterations on the data and the complete set of data lookd pretty busy with both /debug:full, /debug:fastlink, across three releases. I’m in process with a follow up blog with more of the breakdown of the numbers. So stay tuned.
It makes me very happy to see this! Do you happen to have any comparisons against lld-link with /DEBUG:FULL handy? Also what about /Z7? I assume these numbers are with /Zi, but a lot of places use /Z7 because their builds are distributed.
Anyway, on LLD we kind of reached a similar point where after we got all of the low hanging fruit taken care of, we had start making more fundamental changes to the compilation / linking flow so that the compiler could find more ways of helping the linker do its job even faster, which is how /DEBUG:GHASH was...
Hi Zachary, Yeah. We did some testing against LLD (which also had /Z7 so that we could use the same link repros). In general we're really compeditive with LLD (no GHASH) - and we tested with a build from pretty close to head of tree. Looking at the breakdown our debug builds are generally a bit faster than LLD, and our release builds are a bit slower. This is for both /Zi and /Z7 - our largest wins are in /Z7 actually (/Zi, since it merges in the compiler PDB, washes out the win). We don't have the same coverage...
Just to be complete: Not competitive with GHASH. With GHASH and my llvm-objcopy patch lld is still much much faster and uses a lot less memory.
link.exe uses 25GB of private working set and takes 58s while lld uses 20GB of mmaped memory (most of it shared if linking more than one binary at the same time) and 16s.
We might start using link.exe /debug:fastlink if the debugger stalls were fixed in this release, for now we use a mixmash of 2017 compiler and 2015 link.exe for fastlink.
We got bitten pretty hard on the debugger stalls on the 2017...
My comparisons were with /Zi for link.exe (but generating one pdb per obj as we have a distributed build system) and /Z7 for lld. Somehow link.exe is particularly bad with /Zi… using /Z7 for both makes linker.exe much happier using only 4gb of ram and taking 28s. Still almost twice as slow as lld, but way better than in the past.
And the plot thickens even more… link.exe /debug:fastlink on the other hand doesn’t like /Z7 that much, and takes 8s to link, while /Zi with one pdb per obj takes 5s. Now I need to test both to see which causes more debugger stalls. Would be very cool to have any documentation around this.
Hi Leonardo, There are a few wrinkles in here. I'll try and get through them. At the top though, yes, I'm planning a follow up blog that gives more details and recomendations. In this blog I was trying to get to the point of "why should you upgrade from 15.9 to the most recent 16 toolset (i.e. 16.2).
- On the ghash changes. It's interesting. We didn't see that much of a spread but I don't remember doing anything for "llvm-objcopy" so we'll have to go back and look again. For the changes we have now, the comparisons should be...