When we write software our goal is to create correctly functioning applications the first time. Unfortunately, it rarely works that way and we spend a significant amount of time and effort debugging problems in the code rather than adding new value. Fortunately, when issues arise that need investigation Visual Studio ships a world class debugging experience to help find the issue quickly. However, many of us don’t take full advantage of the debugger because we don’t know or simply forget about many of the capabilities it offers to speed up problem solving.
In this post I’ll provide a brief overview the debugging features I showed in a recent C++ Debugging Tips and Tricks video. It certainly doesn’t cover everything but each capability is linked to more detailed information if you want to dive deeper. Additionally, each tip contains a direct link to the exact point in the video I show it.
So go through the following 22 tips and let us know how many of these are new to you – is there anybody that knew all of them? Which one is your favorite?
Finally, before you continue please take a minute to sign up to help us continue to improve the debugger to better meet your needs.
Tips and Tricks
Configuring launch options from project properties (1:25). One common pattern when developing software is to add configuration options to change behavior or test alternate designs based on either command line or environment variable settings. You can configure both command line parameters and set environment variables for the target application on the “Debugging” tab of the Project Properties page (Right click on the project in Solution Explorer and choose “Properties” from the context menu.
Function return values (2:34). When stepping through code in the debugger, the Autos window shows you the values returned by all functions called on the previous line of code.
Set next statement (3:16) enables you to change the next instruction in the application that will execute. This is great for going back and re-running a piece of that that just executed, or can be useful for forcing the application down different code paths to test functionality (e.g. you can move execution inside of a conditional block even if the condition evaluates to false). You can change the next statement by either click and dragging the yellow instruction pointer in the left margin to the desired line, access it through the context menu by right clicking on the desired line and choosing “Set Next Statement” from the context menu, or by using the keyboard shortcut Ctrl+Shift+F10 to set the next statement to line the cursor is on. It is important to note that this simply changes the next instruction that will execute, it does not undo anything that happened previously or run code if you move it forward, for example, if you skip a line of code that initializes a variable using set next statement, the application will crash since the variable will remain initialized.
Step into specific (4:07) allows you to step directly into a function when there are multiple function calls on the same line without the need to navigate to the definition, set a breakpoint, and then continue execution to hit the breakpoint. Step Into Specific can be access from the editor’s context menu by right clicking on the current line, or using the keyboard shortcut Shift+Alt+F11
Run to cursor (5:05) functions as a onetime use breakpoint, by running the debugger to that line and then stopping at that point. Run to cursor can be accessed from both the editor context menu or by using the keyboard shortcut Ctrl+F10 to run to the line the cursor is on. Another useful tip for Run To Cursor is even at design time (when you’re not debugging) the keyboard shortcut Ctrl+F10 will start debugging and run the application to that line of code just like you set a breakpoint and hit F5.
Edit and Continue (6:57) is one of the great productivity time savers when debugging code. If you notice a simple mistake you can correct it while stopped in the debugger without the need to stop debugging, recompile, and run the application back to that location. In Visual Studio 2015 we added support for Edit and Continue into the default C++ debug engine including support for x64 debugging.
Exception Settings (8:31) configure the debugger to stop when specified exceptions are thrown, even if they will later be caught in the application. This is useful when debugging issues where the application is handling the exception but you need to debug why the exception is happening.
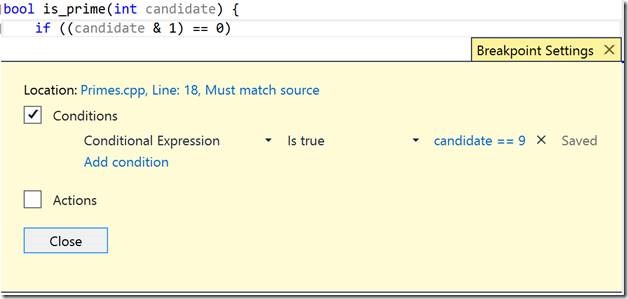
Conditional, Hit Count, and Filter Breakpoints (13:44). A Conditional Expression tells the debugger to stop only when a certain condition in the application is met (e.g. when a variable matches a certain string). A Hit Count enables you to break based on the number of times the breakpoint has been hit when equal to an absolute number, equal to or greater, or when the count is a multiple of the number; which is useful if you need to take a sampling based approach to solving an issue (e.g. only show every 100th value). Filter conditions are designed for parallel processing scenarios and enable you to stop when executing on a certain thread, process, or machine.
Pinning DataTips (19:17) when working inside an iterative code path (e.g. for loop) you’re often focused on a single value. Inspecting variables by hovering over them in the editor is great but the DataTips disappear when you move the mouse. By clicking the “pin icon” on the far right side of the DataTip you can “stick” it to the editor so it stays visible on that line of source code until you choose to close it.
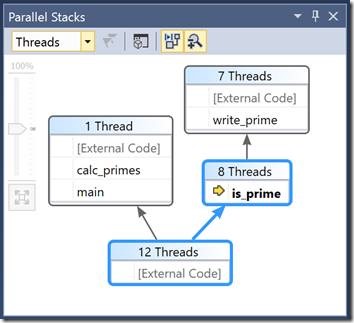
Parallel Stacks window (19:42) shows you the call stacks of all of the threads in the process in a concise view. The Parallel Stacks window is opened through the Debug -> Windows menu.
Show External Code (20:30). Visual Studio by default enables a feature we call Just My Code that helps you focus on the code you control by collapsing operating system and runtime frames on the call stack into a single [External Code] frame. I you want or need to see the complete stack, you can right click in either the Call Stack or Parallel Stacks window to show the complete call stack. If you prefer to debug with this always off, you can permanently disable Just My Code under Debug -> Options
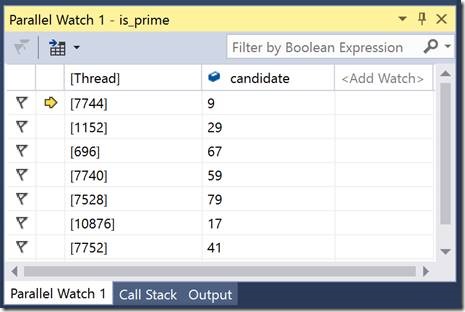
Parallel Watch window (22:00) shows the value of a variable across all threads executing in the current function. It also will show the value of the same variable across stack frames in the case of a recursive method.
Freeze and Thaw threads (23:13) gives you fine grained control over the execution of individual threads. If a particular thread is problematic but you don’t want other threads running while your debugging a single thread you can freeze the threads you don’t want running. When frozen they do not execute any code even when you resume execution of the application.
Flag Threads and Run Flagged Threads to Cursor (24:18) flagging threads enables you to create groups of threads, and then just like Run to Cursor enables you to run the application to a specific line of code, Run Flagged Threads to Cursor enables you to move a group of threads to a specific line. This can be very useful in situations where you need to control the location of certain threads (e.g. to make sure that none of them are holding a lock and then freeze them).
Show Threads in Source (26:13) is a setting that enables you to see what threads are executing with a small glyph in the breakpoint margin. To turn it on, click the “Show Threads in Source” button the debugger toolbar (shown below).
This feature is incredibly powerful when working in code that is running in parallel, but does come at a small performance cost so shouldn’t be left on indefinitely when you’re not using it.
Debug Location toolbar (28:09) is a toolbar that gives you access to the current call stack and the ability to quickly switch between threads among other capabilities. It is visible by default if you use the “General Settings” profile, otherwise you’ll need to manually enable it through View -> Toolbars.
Debugging Heap Corruption with PageHeap (29:43). Heap corruption can be one of the most difficult types of bugs to solve, since the logic error that resulted in the corruption usually occurs long before the application crashes or behaves strangely making it hard to diagnose the location the issue occurs at. PageHeap is a capability in Windows that causes in the operating system to raise an exception if the application either writes to or reads from memory it no longer owns resulting in heap corruption causing the debugger to stop at the location causing the heap corruption. Enabling page heap currently requires using the gflags utility built into the Debugging Tools for Windows as part of the Windows SDK. Once you’ve installed the Debugging Tools for Windows, open an administrative command prompt and run gflags /p /enable [executable name] to enable PageHeap, then debug the application in Visual Studio like normal. A quick word of caution, PageHeap causes Windows to do more memory tracking, so it slows down the speed of the application it is enabled for, so you shouldn’t leave this on indefinitely if not debugging heap corruption.
PerfTips (33:32) shows you the time your code was executing between stops in the debugger (both when stepping over code and running between breakpoints).
Integrated CPU Profiling (35:53) when writing code, often we do all we can to get it working correctly and it can be difficult or impossible to take the time to profile it separately. To improve the convenience of quickly finding major issues in performance we’ve integrated a CPU profiler into the debugger, that can be access through the Diagnostic Tools window.
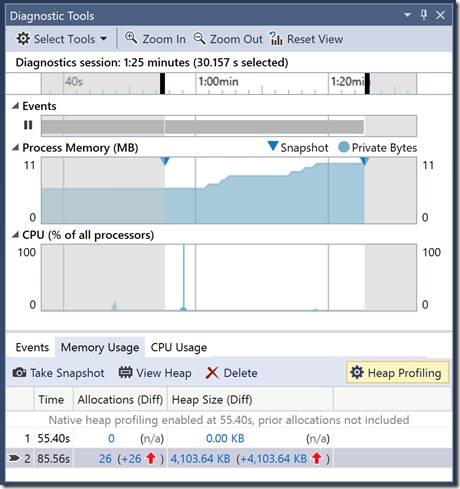
Integrated Memory Profiling (38:01) tracking down memory leaks can be hard. To make this easy as possible we’ve integrated memory profiling tools designed to help find and fix leaks directly in to the debugger through the Diagnostic Tools window. By integrating it directly into the debugger, you have fine grained control over where you take snapshots, meaning you look at the memory changes introduced by a single function call or a single line of code.
Natvis (41:03) lets you customize the way Visual Studio displays native types in the debugger. In Visual Studio 2015 we added support for adding project local natvis files, that take effect in the debugger as soon as they are updated, no need to restart debugging.
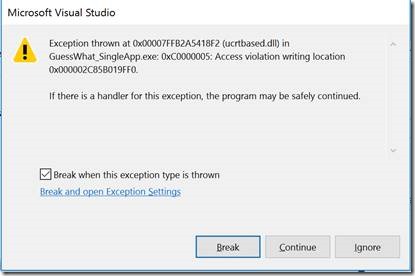
Showing what source code causes an Access Violation (42:43) frequently a single line of code will deference multiple pointers, which results in hunting for exactly which pointer triggered an access violation. In Visual Studio 2015 Update 1 we added analysis logic into the debugger to show you the exact source expression that triggered the Access Violation.
Conclusion
I hope this brief overview of some of the things you can do with Visual Studio’s debugger was helpful. Please let me if you have any comments or questions in the comments section below, or via Twitter. Lastly, we’re always looking for people to help us improve the Visual Studio debugger.






0 comments