When debugging your native applications, it is often useful to view the values of the objects in memory in a specific way, whether that be with custom string formatting, or even performing an operation on the data to make it more meaningful and easy to interpret. Since VS2012, Visual Studio had provided the .natvis visualizer format for declaring custom visualizations for different C/C++ types. Visualized types change the way objects are shown in the native expression evaluator which populates the watch and variable windows, as well as debug data tips. For additional information on the expression evaluator beyond what is needed for reading this post, consult this documentation and this blog post.
Writing a Simple Visualizer
Let’s start by creating a native for the following Volcano class:
using namespace std;

class Volcano
{
 private:
     string m_EnglishName;
     string m_nativeName;
     string m_meaning;Publish
     int m_elevation;

//...rest of class definition
}
Natvis Item Template
Adding new .natvis files to a project is easy in VS2015 with the new built-in template which can be found under Project->Add New Item->Visual C++->Utility->Debugger visualization file (.natvis):
In order to make our Volcano objects easier to debug, we will make the display string equal to the English name since that is the most recognizable entity where referring to a volcano object. The we will create an expand view to display the contained members. To remove quotations on the first two strings we will apply the sb format specifier to both the native and English names, but will leave it off the meaning member since quotation marks will help differentiate the definition when debugging. Since our integer m_elevation is already clearly readably, we will simply list the variable without modification.
Below is the simple .natvis visualizer for displaying our Volcano objects as desired in the C++ expression evaluator when debugging. Notice that the curly brace operator on the <DisplayString> node which relays values from application being debugged. This allows for use of regular text in the output as well as debuggee values:
<?xml version="1.0" encoding="utf-8"?>
 <AutoVisualizer xmlns="http://schemas.microsoft.com/vstudio/debugger/natvis/2010">
   <Type Name="Volcano">
     <DisplayString>Name: {m_EnglishName,sb}</DisplayString>
     <Expand>
       <Item Name="Native name">m_nativeName,sb</Item>
       <Item Name="Meaning">m_meaning</Item>
       <Item Name="Elevation">m_elevation</Item>
     </Expand>
   </Type>
 </AutoVisualizer>
In order to make our Volcano objects easier to debug, we will make the display string equal to the English name since that is the most recognizable entity where referring to a volcano object. Notice that the curly brace operator on the DisplayString node which relays values from application being debugged, which allows for use of regular text in the output as well as debuggee values. Then we will create an expand view to display the contained members. To remove quotations on the first two strings we will apply the sb format specifier to both the native and English names, but will leave it off the meaning member since quotation marks will help differentiate the definition when debugging. Since our integer m_elevation is already clearly readable, we will simply list the variable without modification.
Visualized View of a Volcano Object
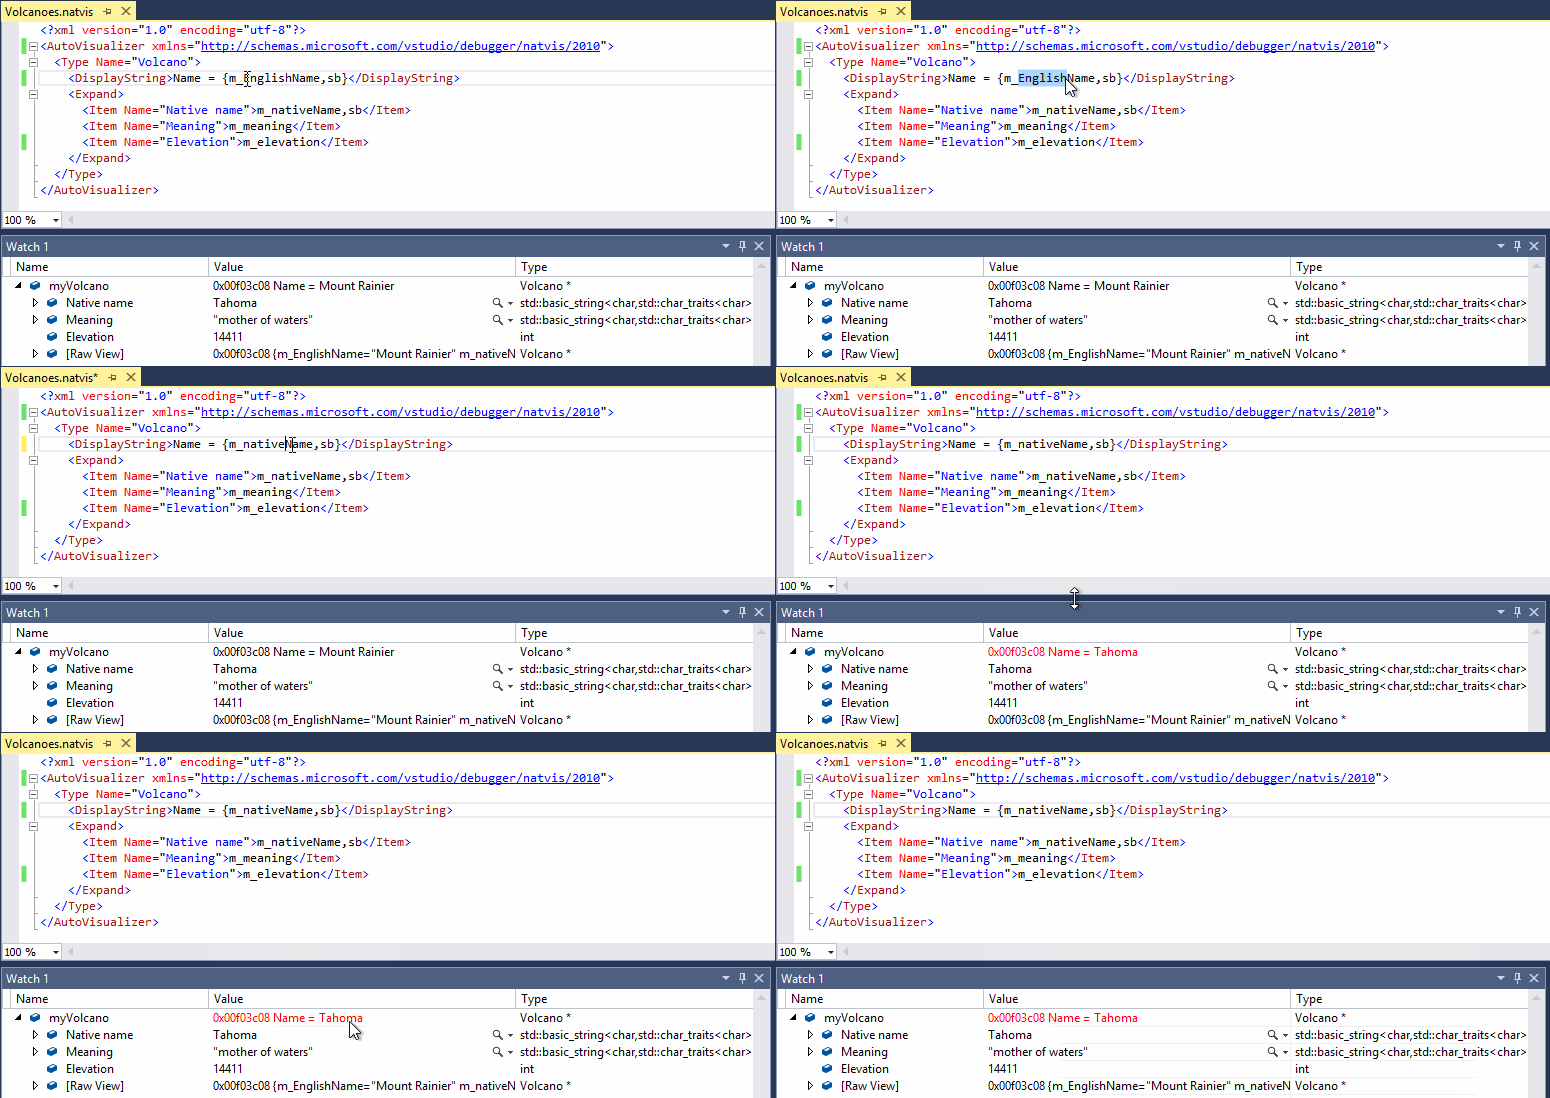
Once the .natvis file is integrated into the project, a Volcano object will be the visualized as shown in the watch window below. The [Raw View] node can be expanded to easily see the default view:
For more information on writing type visualizers inside .natvis files, check out the full documentation of writing basic type visualizers.
New Visualization Features in VS2015
Project Integration of Natvis Files
As shown with the above template and in an earlier preview of VS2015, .natvis files can now be added to projects or solutions and benefit from source control, as well as the ability to link into the PDB during a build for future consumption by the debugger. Besides individual projects, you can also add a .natvis file as a top-level solution item for .exe projects. Manually copying .natvis files to the special directories is longer necessary!
If multiple valid entries are encountered for the same type, the first one in the following list will be used:
- PDB
- Project/solution
- User directory: %USERPROFILE%\My Documents\Visual Studio 2015\Visualizers
- Install directory: %VSINSTALLDIR%\Common7\Packages\Debugger\Visualizers
Modify Visualizers While Debugging
The following animation shows to the top level display string for the object being changed the show the m_nativeName instead of the m_EnglishName. The changes to the .natvis file are immediately picked up by the debugger and the difference is shown in red text:
Improved Array and Vector Debugging
The [] element access operator is now supported in the expression evaluator, and can be used watch windows as well as in <ArrayItems> and <IndexListItems> elements of a .natvis file. Here is an example in the watch window:
Hashtable visualization for CAtlMap
Members of CATLMap data structures can now be expanded to visualize key and value pairs.
Natvis Diagnostic Improvements
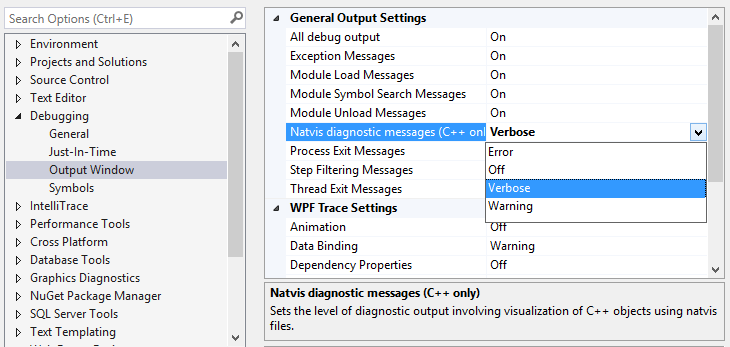
Diagnosing problems in your custom .natvis files is now much easier. The old EnableNatvisDiagnostics registry switch is no longer used. Instead, you can now enable natvis diagnostics in Tools->Options->Debugging->Ouput Window and select one of the options: “Off,” “Error”, “Warning”, and “Verbose”, which will provide additional information concerning the parse failures of the XML:
New Natvis Attributes
“Optional” Attribute
- Any node can have the “Optional” attribute.
- If any sub-expression inside of an optional node fails to parse, only that node will be thrown out. The rest of the <Type> entry is still valid. Previously the entire visualizer would fail for the type.
- For example, you may have a member that only exists when in debug configuration, and this feature allows you to provide a single .natvis entry for the type that works across configurations:
struct Foo
{
     int i;
     int j;
#if _DEBUG
     std::string debugMessage;
#endif
 };
“Inheritable” Attribute on <Type>
- In VS2013, every natvis entry would apply to not only the type specified, but all derived types.
- This works most of the time, but based on feedback, it is sometimes undesirable. (For example: you may want to see the raw members of the derived object without the natvis for the base object masking it)
- In VS2015, the “Inheritable” attribute allows you to control this behavior. Default is “true”. If false, natvis entry applies to base class only.
“Priority” Attribute
- “Low”, “MediumLow”, “Medium”, “MediumHigh” “High” , default is “Medium”
- Where the file comes from (project, user dir, install dir) trumps priority attribute
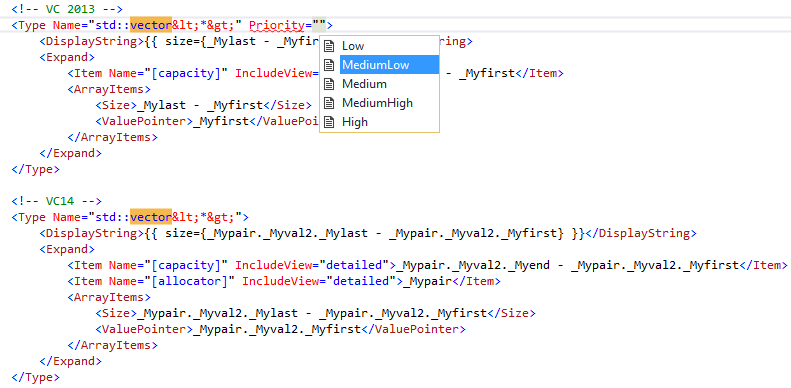
- An example: std::vector for VS2013 declares a “MediumLow” priority so that the VS2015 version is used by default, even though both are still defined in the visualizer file to maintain legacy debugging support. If you wanted to utilize the legacy visualizer when targeting the older v120 toolset, switching the VC2013 implementation to “Medium High” or “High” would enable this to override the default priority of medium for the v140 implementation.
Android Debugging
VS2015 introduced support to develop and debug C++ Android applications, including basic .natvis support for many commonly used stl containers.
Other Natvis Improvements
- <IncludeView> and <ExcludeView> can now be used at the <Type> level, rather than only on individual elements
- <CustomVisualizer> nodes can now specify “Condition”, “IncludeView”, or “ExcludeView” attributes
- Natvis now works on function return values in autos window
- Natvis now works on structs that are optimized into a register
- Improved robustness when natvis entries recursively reference other natvis entries
Future blog posts will cover more advanced debug visualizer options that are available inside Visual Studio.


0 comments