Welcome to the C++ Tutorial series. In this article, we explore debugging concepts and do some hands-on debugging with Visual Studio 2017.
One of the most useful features of an IDE is the debugger. Under a debugger, you can step through code as it is running, examining the values of variables, structures, program flow, screen output, and other elements of the application for errors. It is slower than running the program outside of the debugger, but vital to understanding the inner workings of an application.
When Debugging Helps
Even the best developers make mistakes. That is why the best developers know their way around a debugger and have sound strategies for diagnosing and fixing code issues even when the code belongs to someone else.
You may need to debug when:
- Code crashes randomly, stopping the application and losing data
- Results are wrong or different from previous versions
- Divide by zero
- You need to optimize code based on profiling results
- Feature does not work as expected (selecting “print” produces a garbled page)
- User interface elements are in the wrong place, wrong size, have wrong labels…
- Network communication is not working
- Game enemy keeps running into the corner and dying (AI issue)
- Multi-threaded code is deadlocking
- Component fails to load
- Customer files a bug in your feature area
- You need a better understanding of how code works under the hood
With practice, you will get better at diagnosing issues, isolating behavior, and fixing code. It takes time.
Debugging Hello, World
Time for some hands-on experience with the Visual Studio debugger. We will use the Hello, World program from the first tutorial and then modify it to include a variable we can inspect (and change).
- Load the Hello, World project from the Hello, World tutorial.
- Press F10 to start debugging. Visual Studio will rebuild your project if any changes were detected. Debugging will begin with the first statement (indicated by the yellow arrow, line 4), the open brace of function main():
 This statement has not yet been executed.
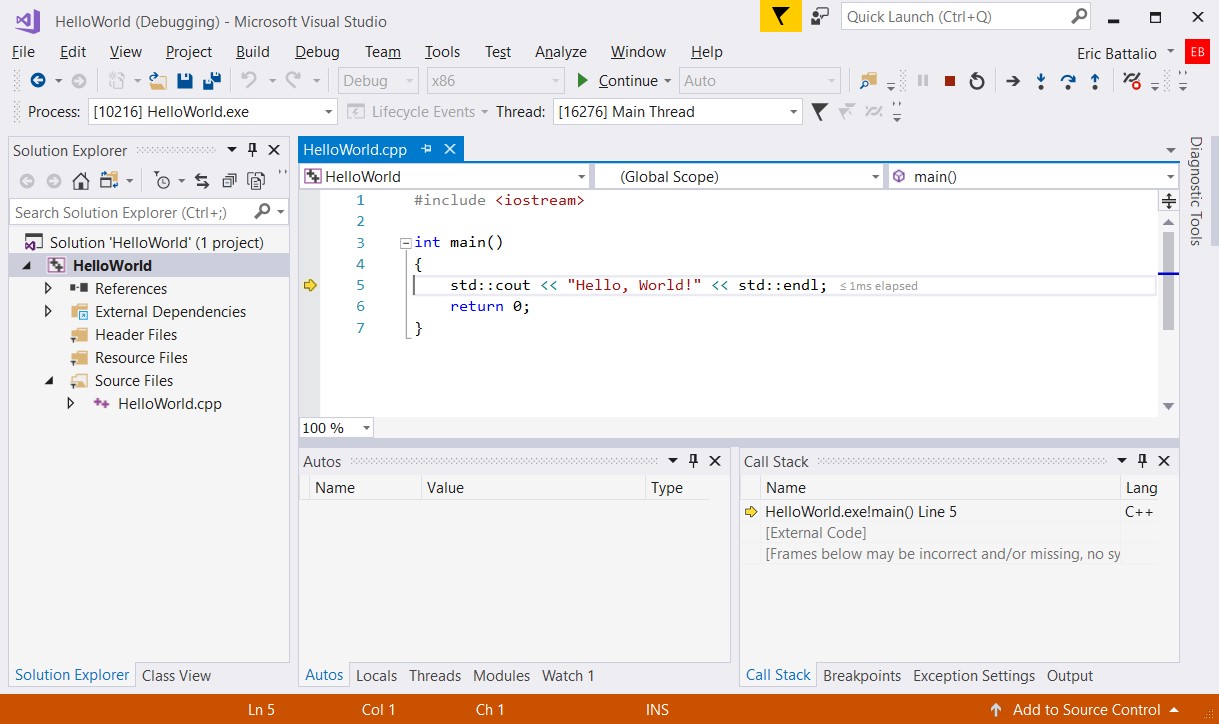
 - Press F10. The yellow arrow should be pointing to the Hello, World output statement (line 5):
 To the right of the statement, you can see the previous statement took less than one millisecond to execute. You can use it to identify bottlenecks and optimize, subjects for another day.
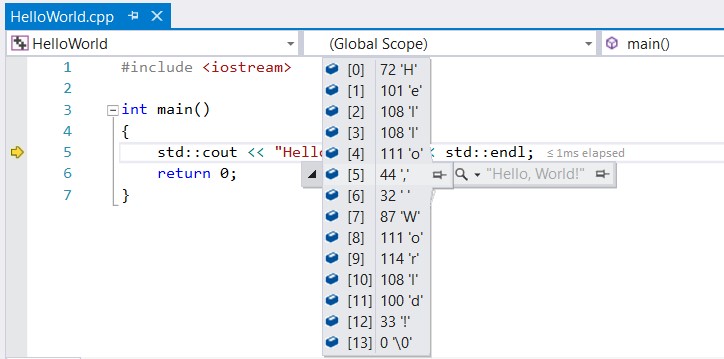
 - Hover the mouse cursor over “Hello, World!”. Visual Studio will pop up a visualizer for the constant:
 In Visual Studio, visualizers help you understand what a constant, variable, class or other element “looks like”. A string constant is an array of characters. If you click the + to expand the view, the string will be shown as an array:
- Press F10 to execute the output statement. Look at the output console window to see “Hello, World!” printed out:

- Press F10 to execute the return statement and press F10 one more time to exit main() (returning 0)
Congratulations, you have just debugged your first C++ application.
Integrated and Stand-Alone Debuggers
Some debuggers are stand-alone and some are integrated into a development environment.
A stand-alone debugger exists independent of other development tools. Because it is independent, it might have a different user interface, might support a broader set of languages, and might need to be told which program to launch for debugging or which running program to attach to for debugging. WinDBG and GDB are popular stand-alone debuggers.
An integrated debugger is part of a development tool, usually alongside other useful development tools in the IDE. With an integrated debugger, you do not need to switch from editor to debugger to diagnose issues. The user interface is consistent, languages supported by the IDE are usually supported by the integrated debugger, and it is already configured for common scenarios. Visual Studio has an integrated debugger that works with all Visual Studio programming languages and their associated libraries.
Common Features
Most debuggers share a common set of features. Here are the features you need to know (and how to use them with C and C++ code in Visual Studio).
Start debugging
To debug, you need to start your app with the debugger attached to the process.
In Visual Studio, press F5 or select Debug | Start Debugging. Your code may need to be rebuilt.
Sometimes, in the heat of debugging, you may forget whether you are in edit mode or actively debugging an application. Visual Studio provides clues. In edit mode, the bar at the bottom of the editor is blue.
In debugging mode, “(Debugging)” appears in the title bar and the bar on the bottom of the screen is orange. And unless you’ve made configuration changes, there are debugging and diagnostic panels in the editor.
Setting a breakpoint
Breakpoints are useful when you know the line of code or the section of code that you want to examine in detail. By setting a breakpoint, you tell the debugger to pause when execution hits a selected line of code so you can inspect values, examine output, change program flow, override values, and perform other diagnostic tasks.
In Visual Studio, you set a breakpoint by clicking in the margin to the left of a line of code, by pressing F9, or by selecting Debug | Toggle Breakpoint on the menu. When in debug mode, you can Run to Click, to advance the debugger to the line of code where you clicked by hovering over over a line of code until the Run to Click (Run execution to here) button appears.
Step into code
Stepping into code advances the app execution into the details of the function. You will see the underlying function code in detail and is helpful when you are trying to identify where a bug might be hiding.
In Visual Studio, press F11 to step into code. If you press this while not debugging, the debugger will start and execution will begin at the first line of your code.
Step over code
Stepping over code advances the debugger without exposing function details. The code still executes, but execution advances in a single “leap”, avoiding the implementation. It is a good way to skip over code that you’re not interested in, so you can quickly get to code that you are more interested in.
Press F10 in Visual Studio to step over code.
Inspect variables
Inspect the current type and value of variables in scope to find incorrect data and better understand program behavior. You might be able to see variables used in the previous few lines of code (called automatic or auto variables) and local variables (variables currently in scope, often including the implicit “this” pointer when inside a C++ object).
The Visual Studio debugger displays both Autos and Locals windows while debugging. You can see the value of an individual variable by hovering the mouse cursor over it.
Modify a variable
Sometimes it is useful to see what happens when variables have different values while debugging. For example, your application might control an automatic lawn sprinkler that turns off when rain is detected; you might set the “isRaining” flag manually regardless of whether it is actually raining to make sure the sprinklers turn off and on as desired.
Values can be C and C++ expressions. If you use operators that modify values (like post-increment) or call a function, it can change the value of other variables or otherwise affect the state of your application.
In Visual Studio, the variable windows, Autos, Locals, and Watch, display the values of certain variables during a debugging session. The QuickWatch dialog box can also display variables. When the debugger is in break mode, you can use the variable windows to edit the values of most variables that appear in these locations.
Examine the call stack
The call stack shows the order in which methods and functions are called (like function x calling function y which in turn calls function z). This is a good way to understand the execution flow of an app and helps answer the question “where am I in code and how did I get here?”
The Visual Studio debugger automatically shows the Call Stack.
Change execution flow
By changing execution flow, you change which statement will be executed next. This is helpful to force execution flow down a certain code path or to re-execute a block of code after setting variables to different values.
With the Visual Studio debugger paused on a line of code, use the mouse to grab the yellow arrow pointer on the left and move the yellow arrow pointer to a different point in the code execution path. Then you use F5 or a step command to continue running the app.
And more…
Learn more about general debugging features in Visual Studio and then dig a little deeper into C++ debugging and diagnostics. If you are using another debugger, consult the documentation to learn what features are supported.
A More Advanced Example
We have not yet looked at C++ types, but let’s add an integer variable and output statement to Hello, World and see how we can visualize and modify variable values.
- Load the Hello, World project from the Hello, World tutorial.
- Add the following two statements before return 0 (line 6):
int x = 47;
std::cout << x << std::endl;
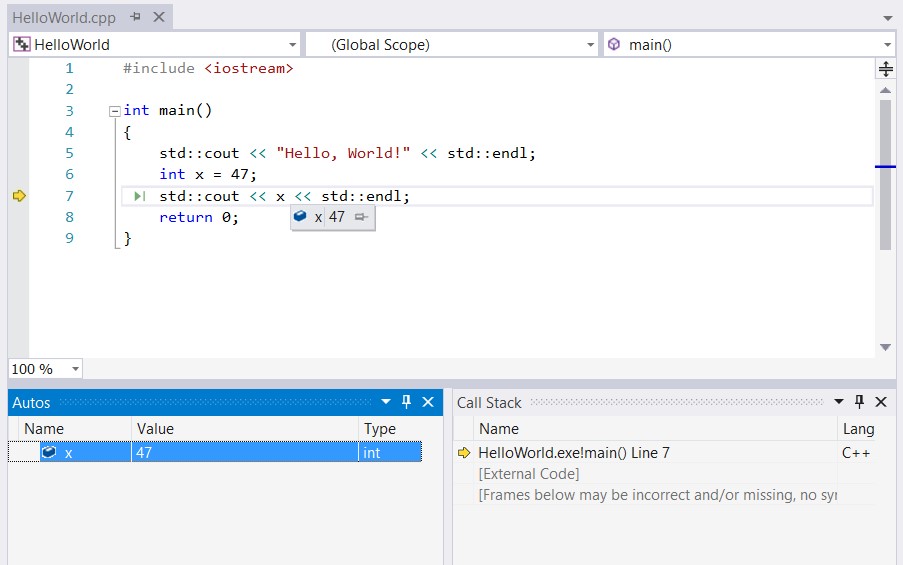
Your code should look like this:
- Right-click on line 7 and select Run To Cursor (CTRL-F10). Hover the mouse over the variable x to see its current value. It can also be seen in the Autos window (both are shown below):

- Press F10 and check the output window. You should see “47” under “Hello, World!”. Does the output work for a different number? Let’s find out.
- Drag the yellow arrow to line 7 (or move the cursor to line 7, right-click and select Set Next Statement).
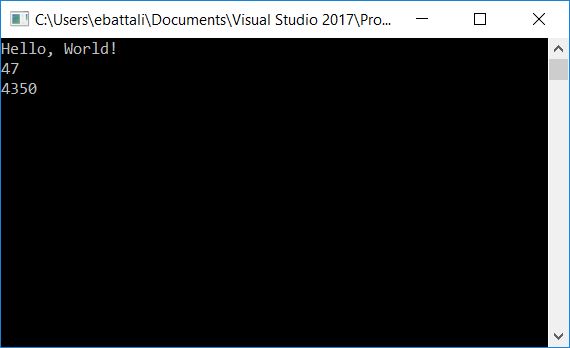
- Modify the value of x. Hover over x on line 7 and then click on 47 when it appears to edit. Change it to 4350 and then click enter.
- Press F10 to output the value. Check the output console; you should see the following:

- You can stop debugging any time by selecting Debug | Stop Debugging (SHFT+F5). Do so now.
Congratulations again, you just modified a variable and changed program flow in a running application.
Review
In this C++ tutorial, you learned the basics of debugging including when you might need to debug (like when a function is not providing the expected results), the difference between stand-alone and integrated debuggers (integrated debuggers are part of an IDE and might be easier to use), and common debugger features. You also debugged a simple and a more complex application, changing values and modifying execution flow.
Want more? Find additional C++ tutorials and debugging insights on this blog.
If you have any feedback or suggestions for us, please reach out. We can be reached via the comments below, via email (ebattali@microsoft.com or visualcpp@microsoft.com) and you can provide feedback via Help | Report A Problem in the product, or via Developer Community. You can also find us on Twitter (@VisualC) and Facebook (msftvisualcpp).
Thanks to Kate Gregory – Partner, Gregory Consulting Limited; and James McNellis – Microsoft Senior Software Development Engineer, for allowing us to use some of their video lectures, demonstrations, and content. Thanks also to Gerry O’Brien, Microsoft Learning Experience, for curriculum design and assistance.


0 comments