

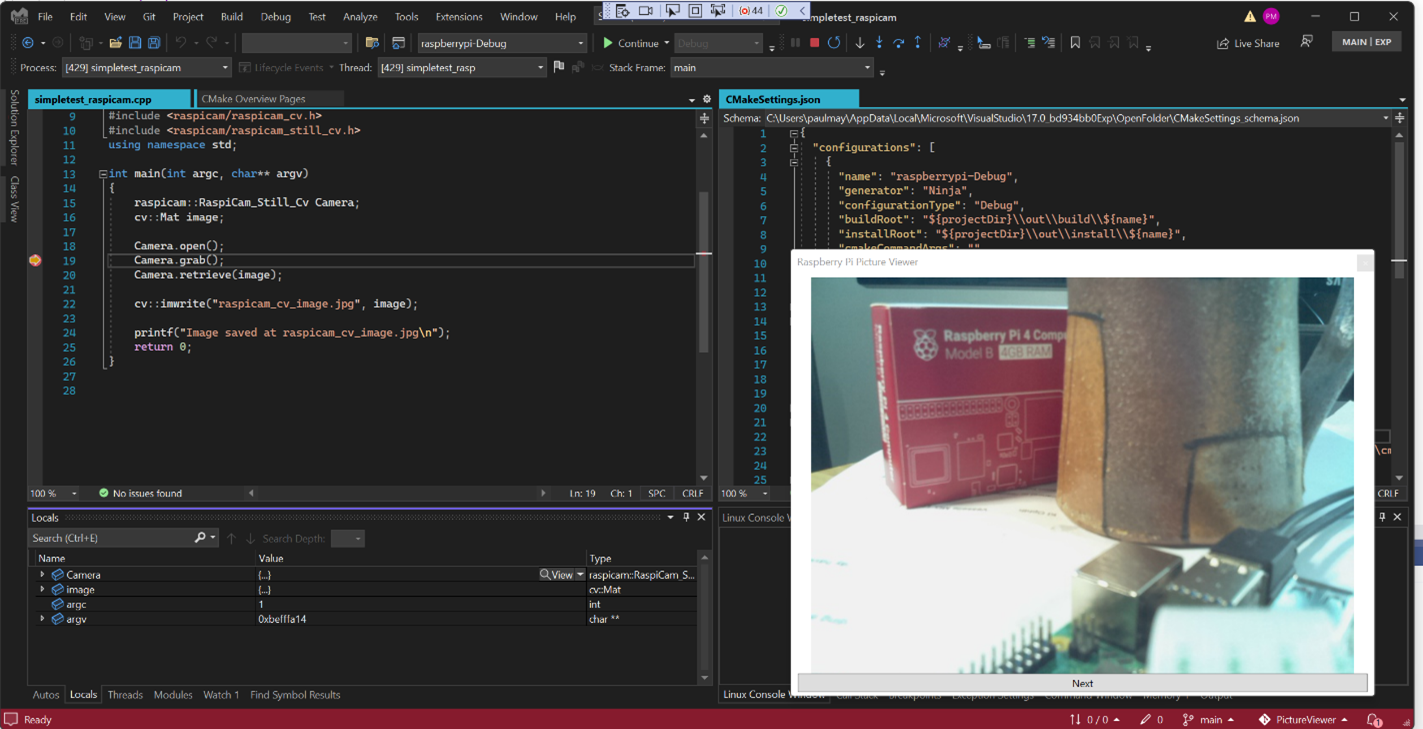
While developing a sample application for a Raspberry Pi with a camera using the RaspiCam library, it occurred to me that it would be convenient and fun to be able to see the current camera input while debugging the application. The Visual Studio debugger supports type-specific custom visualizers and end-user extensions that implement UI for these visualizers. I decided to make one for the RaspiCam camera types that would display the current image from the camera. The image below is the end result, showing Visual Studio debugging a program running on the Raspberry Pi and displaying the content of a Raspberry Pi camera object in a pop-up debugger visualizer.
Build a RaspiCam Application
I needed a sample Raspberry Pi camera application. I downloaded the Raspberry Pi SDK and a CMake toolchain to my windows machine. I downloaded the Raspiam cd camera library and OpenCV. I used the Raspberry Pi toolchain to build both these repositories. I then created a new CMake project in Visual Studio, wrote a simple camera application and linked to these two libraries. My CMakePresets.json file contains this configuration:
  "configurePresets": [
    {
      "name": "raspberrypi-Debug",
      "generator": "Ninja",
      "binaryDir": "${sourceDir}/out/build/${presetName}",
      "installDir": "${sourceDir}/out/install/${presetName}",
      "cacheVariables": {
        "CMAKE_BUILD_TYPE": "Debug",
        "CMAKE_TOOLCHAIN_FILE": "C:/temp/raspberry/toolchain-rpi.cmake",
        "OpenCV_DIR": "D:\\opencv-4.5.5\\opencv-4.5.5\\out\\install\\RaspberryPi-Debug\\lib\\cmake\\opencv4",
        "raspicam_DIR": "D:\\raspicam\\out\\install\\raspberrypi-Debug\\lib\\cmake"
      },
      "environment": {
        "RASPBIAN_ROOTFS": "c:/temp/raspberry/arm-linux-gnueabihf/sysroot",
        "PATH": "c:/temp/raspberry/bin;$env{Path}"
      }
    }
  ],
  "buildPresets": [
   {
      "name": "cross-build",
      "environment": {
        "PATH": "c:/temp/raspberry/bin;$penv{PATH}"
      },
      "configurePreset": "raspberrypi-Debug"
    }
  ]
My Raspberry Pi application uses the OpenCV library and the RaspiCam_Still_Cv camera type for capturing and manipulating the camera image.
    raspicam::RaspiCam_Still_Cv Camera;
    cv::Mat image;

    Camera.open();
    Camera.grab();
    Camera.retrieve(image);
    cv::imwrite("raspicam_cv_image.jpg", image);
I wanted to debug this application on the Pi so I added the launch configuration below. This instructs the debugger to first deploy the application to my RaspberryPi device in directory ~/camera. I copied all the shared OpenCV and RaspiCam libraries I needed to this directory too.
    {
      "type": "cppgdb",
      "name": "DebugOnPi",
      "project": "CMakeLists.txt",
      "projectTarget": "simpletest_raspicam",
      "debuggerConfiguration": "gdb",
      "MIMode": "gdb",
      "args": [],
      "env": {},
      "deployDirectory": "~/camera",
      "remoteMachineName": "<your-connection-name-here>",
      "preDebugCommand": "export LD_LIBRARY_PATH=~/camera"
    }
I could now debug on the Raspberry Pi.
Add Visualizers to the Linux Debugger
Although the Visual Studio Windows debugger supports UI visualizers, it turned out that the Visual Studio Linux debugger did not have this feature implemented. Since the Raspberry Pi runs Raspian, a Debian Linux variant, the first thing I had to do was fix that. The Linux debugger is an open source project called MIEngine. The MIEngine runs as a Visual Studio debugger “engine” that controls a gdb process running remotely on a Linux host. The MIEngine already supported custom variable visualization using natvis files (example below). However, it did not support the UIVizualizer tag in natvis files which is necessary to open a new visualization window containing, for example, a camera image. The work described here is now part of the MIEngine and in Visual Studio. The completed PR with the changes is here. Remember it’s open source, so you too can contribute in this way!
<?xml version="1.0" encoding="utf-8"?>
<AutoVisualizer xmlns="http://schemas.microsoft.com/vstudio/debugger/natvis/2010">
     <UIVisualizer ServiceId="{0A73397B-D550-4BFE-94C9-C0E5122DC06F}" Id="1"
             MenuName="Raspberry Still Camera (OpenCV) Visualizer"/>

      <Type Name="raspicam::RaspiCam_Still_Cv">
         <UIVisualizer ServiceId="{0A73397B-D550-4BFE-94C9-C0E5122DC06F}" Id="1" />
      </Type>
</AutoVisualizer>
There were two changes I needed to make to the MIEngine: First was to recognize and process the UIVisualizer element in natvis files and second was to automatically load natvis files for registered Visual Studio extensions.
- Recognizing the element was simple. The MIEngine already parsed natvis files, it was just ignoring the
UIVisualizerelement. I simply changed the natvis lookup code to return not just the visualized string value for an expression, but also a list of anyUIVisualizersthat were present for the expression type. The MIEngine returns an expression value to the Visual Studio debugger as anAD7Property. I updated theAD7Propertyclass to also return the list ofUIVisualizersfound. - The MIEngine makes requests of Visual Studio via its
DebugEngineHost. In order to support visualization, I needed to call into Visual Studio from theDebugEngineHostand ask it for anIVsExtensionManagerPrivateservice reference. I then called into the resulting service asking for a list of all resources tagged as “NativeCrossPlatformVisualizer”. It returned a list of file names for resources that have this tag. These are given to the MIEngine natvis processor for parsing.
Finally, there was an additional feature that was missing from the MIEngine. It didn’t have a convenient way for a caller holding an AD7Property object to determine the execution context (that is, stack frame) where the expression that generated that property was evaluated. So, I extended the AD7Property class to implement a new interface IDebugMIEngineProperty that contains a method for returning the properties IDebugExpressionContext2. Now all the parts are in place for developing a UIVisualizer for Linux applications.
Create a Visualizer VSIX Project
The UIVisualizer for a data type is identified in natvis by a GUID ServiceId and an integer Id. These are the values the debugger will use to find and open the associated visualizer. The ServiceId identifies a type that implements VsCppDebugUIVisualizer. The Id identified which of its visualizers to open – in the case that more than one visualizer is supported by the service. I needed to author a service for my camera picture viewer as a visual studio extension.
To start, I created a VSIX (Visual Studio extension project) called PictureViewer (you need to have the “Visual Studio extension development” workload installed). Then I defined an interface for my visualizer tagged with my viewer’s ServiceId and attributed the VSIX Package object with this interface. I now had to define the relationship between the UIVisualizer element in the natvis file with this VSIX package.
[Guid("0A73397B-D550-4BFE-94C9-C0E5122DC06F")]
public interface IPictureViewerService
{
}
…
[PackageRegistration(UseManagedResourcesOnly = true, AllowsBackgroundLoading = true)]
[ProvideService(typeof(IPictureViewerService), ServiceName = "PictureViewerService", IsAsyncQueryable = true)]
[Guid(PictureViewerPackage.PackageGuidString)]
public sealed class PictureViewerPackage : AsyncPackage
{
…
}
I then added a new PictureViewerService that implements both IPictureViewerService and IVsCppDebugUIVisualizer. The only method it implements is IVsCppDebugUIVisualizer.DisplayValue.
int DisplayValue(uint ownerHwnd, uint visualizerId, IDebugProperty3 debugProperty)
This is the API called by the debugger to display a value using a custom UIVisualizer. The already evaluated expression value is passed to the visualizer in the debugProperty object.
I implemented my UI in class PictureViewerViewModel. The UI in this example is very simple, just an Image and a Button in a pop-up window. When the service activates the UI the view model object fires off a task to load the image from the application being debugged and then invokes ShowDialog. The XAML snippet below defines the content of the dialog.
<Grid Margin="4">
    <Grid.RowDefinitions>
        <RowDefinition Height="*" />
        <RowDefinition Height="Auto" />
    </Grid.RowDefinitions>
    <Image Width="{Binding Image.Width}" Height="{Binding Image.Height}"
        Source="{Binding Image}"/>
    <Button Grid.Row="1" Margin="4,0" x:Uid="LoadNext_Button"
            Content="Next"
            Command="{Binding ClickCommand, Mode=OneTime}" />
</Grid>
The view model is where the work is done to populate the UI from the camera content. In this case I was interested in retrieving JPEG content from the camera and using it to create a BitmapImage. To get an image from a camera object the debugger must perform the same operations that the application would have to do to do the same thing. Or more accurately, the debugger must instruct the debuggee to do these steps using expression evaluation. The code below uses Visual Studio debugger APIs to evaluate a string expression given an IDebugMIEngineProperty context. It returns both a string with the debugger’s result of the evaluation and a memory context object that can be used to read the raw bytes of that result.
private DEBUG_PROPERTY_INFO EvalExpression(string expr, out IDebugMemoryContext2 ppMemory)
{

   if (context.ParseText(expr, enum_PARSEFLAGS.PARSE_EXPRESSION, 10, out IDebugExpression2 ppExpr, out string error, out uint errorCode) != VSConstants.S_OK)
   {
      throw new ApplicationException($"Failed to parse expression '{expr}'.");
   }

   if (ppExpr.EvaluateSync(0, 0, null, out IDebugProperty2 prop) != VSConstants.S_OK)
   {
      throw new ApplicationException($"Failed to evaluate expression '{expr}'.");
   }

   DEBUG_PROPERTY_INFO[] value = new DEBUG_PROPERTY_INFO[1]; ;
   if (prop.GetPropertyInfo(enum_DEBUGPROP_INFO_FLAGS.DEBUGPROP_INFO_VALUE, 10, 0, null, 0, value) != VSConstants.S_OK)
   {
      throw new ApplicationException($"Failed to get expression value for '{expr}'.");
   }

   if (prop.GetMemoryContext(out ppMemory) != VSConstants.S_OK)
   {
      ppMemory = null;
   }

   return value[0];
}
Now I needed to implement the right sequence of expression evaluations. I based the sequence on the sample C++ code below that retrieves an in-memory jpg image from a camera object.
raspicam::RaspiCam_Still_Cv Camera;
...
cv::Mat image;
Camera.grab();
Camera.retrieve(image);

vector<uchar> jpgImage;
vector<int> jpgParams;
cv::InputArray ia = cv::_InputArray(image);
string jpg = ".jpg";

cv::imencode(jpg, ia, jpgImage, jpgParams);
Since I have registered the visualizer for the camera type, the debugProperty object that is passed into the visualizer will contain the results of evaluating a RaspiCam_Still_Cv object. It can be cast to an IDebugMIEngineProperty and used to get a context for evaluating expressions. The final result is that the debuggee application creates an in-memory object containing a JPEG image. The debugger then reads the bytes from the debuggee memory and creates the BitmapImage.
The first thing you might notice is that this sequence of evaluations involves creating several objects: image, jpgImage, jpgParams, ia, and jpg. These objects do not exist on the debuggee so they must be created. To create an object via expression evaluation, the debugger must first malloc the memory for the object and then invoke the object’s constructor. I do this in MakeHeapObject below:
private string MakeHeapObject(string type, string constructor, string cparams = "")
{
   var address = this.EvalExpression($"malloc(sizeof({type}))");
   if (!address.bstrValue.StartsWith("0x"))
   {
      throw new ApplicationException(address.bstrValue);
   }

   var init = this.EvalExpression(
                $"(({type} *){address.bstrValue})->{constructor}({cparams})");
   return address.bstrValue;
}
For example, to make an object of type “vector<int>,” the visualizer calls:
this.MakeHeapObject("std::vector<int, std::allocator<int> >", "vector")
A string containing the new object’s address in the debuggee is returned, for example “0xf7003421”. The object is similarly deleted in FreeHeapObject when it is no longer needed. Notice that it is possible to introduce new interactions that would not have occurred whenever running code in the debuggee. It may not be safe to create and destroy objects that affect shared resources.
Now all the pieces are in place for evaluating the sequence of expressions necessary to get the jpg image into a debuggee in-memory byte array. Once this is done the IDebugMemoryContext2 is used to read the bytes from debuggee memory into a buffer in Visual Studio. The Bitmap image is created from a MemoryStream built on that buffer.
The VSIX project also needs to contain the .natvis file containing the type-to-Visualizer mapping (see top of this section). The VSIX manifest points to the file and tags it as a “NativeCrossPlatformVisualizer” asset.
<Asset Type="NativeCrossPlatformVisualizer" Path="raspicam.natvis"/>
All the details can be found in this git repository, including the sample CMake application (above) to test with.
Great stuff! Didn’t know that the VSCode cpp debugger was that expandable, thanks for this.
Also, is there any reason you didn’t opt to use CMakePresets.json instead of CMakeSettings.json?
Oops, wrong version got uploaded. Presets version is there now. Thanks for pointing this out.