
We have made substantial runtime performance improvements in the x86/x64 C++ compiler for Visual Studio’s default debug configuration. For Visual Studio 2019 version 16.10 Preview 2, we measure 2x – 3x speedup for programs compiled in debug mode. These improvements come from reducing the overhead introduced by runtime checks (/RTCs) which are enabled by default.
Default debug configuration
When you compile your code in debug configuration in Visual Studio, there are some flags that are passed to the C++ compiler by default. Most relevant to this blog post are /RTC1, /JMC and /ZI.
While all of these flags add useful debugging functionality, their interactions, particularly when /RTC1 is involved, add significant overhead. In this release, we removed the unnecessary overhead while making sure they keep helping you find bugs and make your debugging experience smoother.
Consider the following simple function:
1    int foo() {
2        return 32;
3    }
and the x64 assembly generated by the 16.9 compiler when compiled with /RTC1 /JMC /ZI (Godbolt link):
1    int foo(void) PROC
2    $LN3:
3            push rbp
4            push rdi
5            sub rsp, 232                ; extra space allocated due to /ZI, /JMC
6            lea rbp, QWORD PTR [rsp+32]
7            mov rdi, rsp
8            mov ecx, 58                 ; (= x)
9            mov eax, -858993460         ; 0xCCCCCCCC
10           rep stosd                   ; write 0xCC on stack for x DWORDs
11           lea rcx, OFFSET FLAT:__977E49D0_example@cpp
12           ; call due to /JMC
13           call __CheckForDebuggerJustMyCode
14           mov eax, 32
15           lea rsp, QWORD PTR [rbp+200]
16           pop rdi
17           pop rbp
18           ret 0
19    int foo(void) ENDP
In the assembly shown above, the /JMC and /ZI flags add a total of 232 additional bytes on the stack (line 5). This stack space is not always necessary. When combined with the /RTC1 flag, which initializes the allocated stack space (line 10), it consumes a lot of CPU cycles. In this specific example, even though the stack space we allocated is necessary for proper functioning of /JMC and /ZI, its initialization is not. We can prove at compile time that these checks are unnecessary. There are plenty of such functions in any real-world C++ codebase, and that’s where the performance benefit comes from.
Keep reading to get a deeper dive into each of these flags, their interactions with /RTC1, and how we avoid its unnecessary overhead.
/RTC1
Using /RTC1 flag is equivalent to using both /RTCs and /RTCu flags. /RTCs initializes the stack frame of functions by 0xCC to do various runtime checks namely, detecting uninitialized local variables, detecting array overrun and underruns, and stack pointer verification (for x86). You can see the code bloat with /RTCs here.
As seen in the above assembly code (line 10), the rep stosd instruction, introduced by /RTCs, is the main reason for the slowdown. The situation is exacerbated when /RTCs (or /RTC1) is used in conjunction with /JMC, /ZI, or both.
Interactions with /JMC
/JMC stands for Just My Code Debugging functionality, and during debugging, it automatically skips over functions that are not written by you (such as framework, library, and other non-user code). It works by inserting a function call in the prologue that calls into the runtime library. This helps the debugger to distinguish between user and non-user code. The problem here is that inserting a function call into the prologue of every function in your project means that there are no leaf functions anymore in your whole project. If the function doesn’t need any stack frame originally, now it will, because as per AMD64 ABI for Windows platforms, we need to have at least four stack slots available for function parameters (called Param Home area). This means all the functions that were not being initialized earlier by /RTCs, because they were leaf functions and had no stack frame, will now be initialized. It’s normal to have lots and lots of leaf functions in your program, especially if you are using a heavily templated code library like C++ STL. /JMC will happily eat some of your CPU cycles in this case. This doesn’t apply for x86 (32 bit) because we don’t have any param home area there. You can see the effects of /JMC here.
Interaction with /ZI
The next interaction we are going to talk about is with /ZI. It enables your code for Edit and Continue support, which means you don’t need to recompile the whole program during debugging for small changes.
In order to add such support, we add some padding bytes to the stack (the actual number of padding bytes depends on how big a function is). This way, all the new variables you add during your debugging session can be allocated on the padding area without changing the total stack frame size, and you can continue your debugging without having to recompile your code. See here how enabling this flag adds an extra 64 bytes to the generated code.
As you may have guessed, more stack area means more things to initialize by /RTCs, leading to more overhead.
Solution
The root of all these problems is unnecessary initialization. Do we really need to initialize the stack area every time? No. One can safely prove within the compiler when stack initialization is really needed. For example, you need it when there is at least one address-taken variable, an array declared in your function or uninitialized variables. For every other case, we can safely skip over the initialization, as we are not going to find anything useful through runtime checks anyway.
The situation gets a bit more complicated when you compile with edit-and-continue because now you may add uninitialized variables in the debugging session that can only be detected if we initialize the stack area. And we may not have done that. To solve this problem, we included the necessary bits in debugging info and exposed it via Debug Interface Access SDK. This information tells the debugger where the padding area introduced by /ZI starts and ends. It also tells the debugger if the function needed any stack initialization. If so, the debugger then unconditionally initializes the stack area in this memory range for the functions that you have edited during your debugging session. The new variables are always allocated on top of this initialized area and our runtime checks can now detect if your newly added code is safe or not.
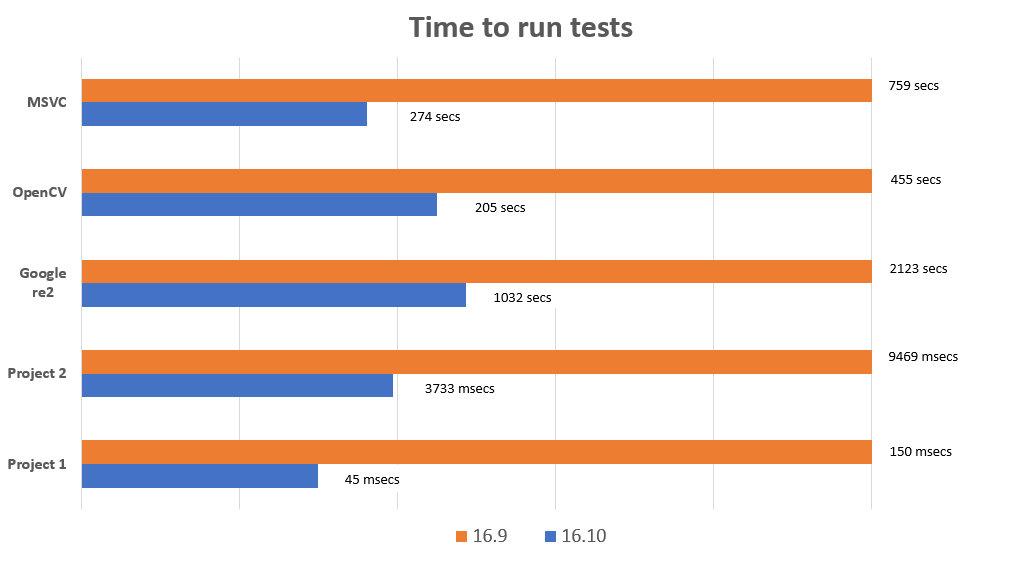
Results
We compiled following projects in default debug configuration and then used the generated executables to run tests. We noticed 2x – 3x improvements in all the projects we tried. More STL-heavy projects may see larger improvements. Let us know in the comments any improvements you noticed in your projects. Project 1 and Project 2 are customer provided samples.
Tell us what you think!
We hope this speedup makes your debugging workflow efficient and enjoyable. We are continuously listening to your feedback and working towards improving your inner loop experience. We’d love to hear about your experience in the comments below. You can also get in touch with us at Developer Community, email (visualcpp@microsoft.com), and Twitter (@VisualC).
It’s nice to see great people doing great stuff! Thanks Pranav! 🙂
JMC injecting a function call into every function call seems like a pretty drastic move. For comparison:
1. x64 exception handling works on address tables. The exception handler for a specific function can be looked up in log time. Wouldn’t it have been more practical to build such a table and have the compiler look it up whenever it needs to know whether a function is user code?
2. Stack probes on x86/x64 are implemented simply as jumps to external code, which operate on a restricted register set and jump back to the original function. This seems much more lightweight than...
Yeah, Just My Code needing to actually modify my code is undesirable. All I really ever wanted for Christmas is the ability to easily skip into the current function (F11) without stepping into all the distracting parameter calls first. So given...
<code>
...just have a keyboard shortcut that steps into `foo`, not `bar` and `baz`, regardless of whether `bar` and `baz` were my own code's helper functions or some other library code. Needing to {right click / Step Into Specific / select my function foo} every single time is obnoxious, but if a single key shortcut existed, then that would completely obviate...