

There is now a new extension from Dynatrace that provides fully app-centric Cassandra performance monitoring for Azure Managed Instance for Apache Cassandra.
Monitor your clusters with Dynatrace Prometheus Extension
Dynatrace Prometheus Extension allows you to monitor and analyze the activity of your Azure Managed Instance for Apache Cassandra clusters, from both data and infrastructure perspectives. It helps visualize your cluster’s health and shows metrics like CPU, connectivity, request latency, suspension, and garbage collection time. Additionally, with Davis, it automatically detects performance problems and provides precise root cause analysis.
Once you deploy the Dynatrace Extension to monitor your Azure Managed Instance for Apache Cassandra cluster, Dynatrace begins ingesting those metrics and correlates that data with the entire stack. In addition, the extension adds a preconfigured dashboard, topology entities and relationships and entity screens to your environment. The preconfigured dashboard named “Cassandra Prometheus Dashboard” can be used as a launch point for your Cassandra monitoring.
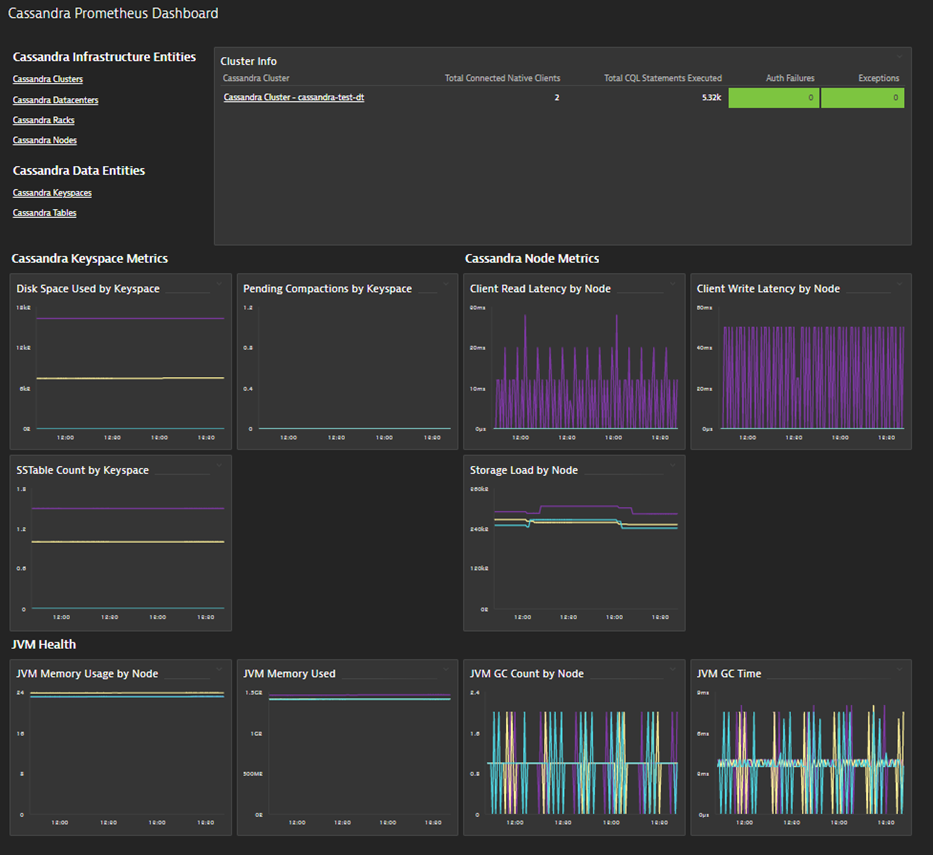
The main dashboard provides a quick snapshot of your cluster’s performance. You can easily dive deeper into both infrastructure metrics (Cluster, Datacenter, Racks, and Nodes) and Data metrics (Keyspaces and Tables).
In addition to the built-in views, Dynatrace provides data analysis tools. This greatly enhances your ability to query and chart metrics. For example, the Dynatrace Data explorer enables you to:
- Analyze multidimensional metrics, whether built into Dynatrace or ingested from other sources like Azure Monitor.
- Choose from any of seven visualizations: stacked graph, heatmap, graph, pie, single value, table, or top list.
- Add your visualization right to your dashboards for easy access and sharing.
- Provide a foundation for metric calculation in charts on dashboards.
Using the Dynatrace Data explorer, you can easily analyze metrics, such as, client read/write latency by Cassandra nodes, disk space usage by keyspaces and table metric such as cache hits and misses.
Precise AI-powered answers provided by Dynatrace Davis
Analyzing data for fast troubleshooting can be very complex due to the large amounts of data and variety of data sources. Dynatrace Davis®, the AI causation engine uses high-fidelity metrics, traces, logs, and real user data that are mapped to a unified entity model rather than processing simple time-series data. This gives operations teams specific answers to help prioritize and identify the root cause with end-to-end visibility down to the code level to resolve the problem.
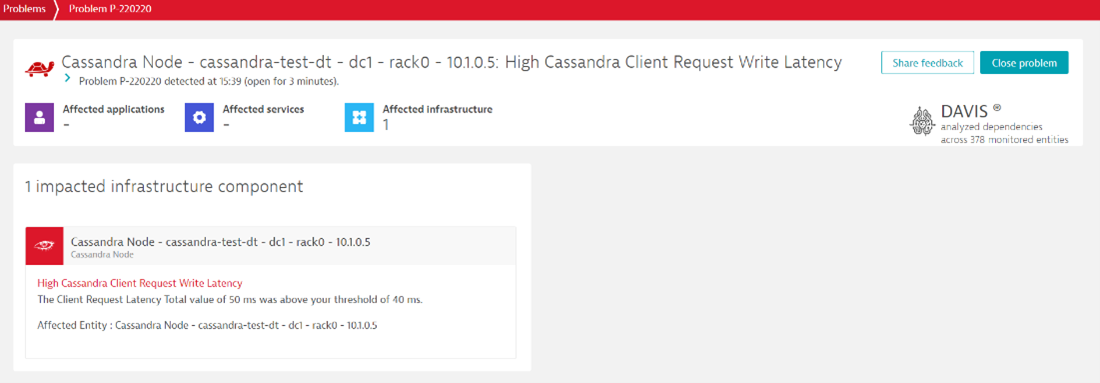
Below is an example Dynatrace problem card, which shows how spike in Cassandra Write Latency impacts your application:
Start monitoring with Dynatrace today
Dynatrace is a Microsoft Partner, that offers a platform to monitor all your Azure Managed Instance for Apache Cassandra instances. To get started with Dynatrace, review their technical documentation or sign up for a free 15-day trial.
Options to run Cassandra workloads on Azure
Azure offers two managed service for Cassandra data:
- Azure Managed Instance for Apache Cassandra provides the ability to provision managed native Apache Cassandra clusters. This comes with automated deployment and scaling operations. You can accelerate hybrid scenarios and reduce ongoing maintenance.
- The Azure Cosmos DB Cassandra API is an implementation of the Wire Protocol defined by Apache for the Cassandra database, which runs on top of Azure Cosmos DB. This allows open-source Apache Cassandra drivers and applications to target Azure Cosmos DB and use it as a cloud-native, fully managed NoSQL database service with global distribution, elastic scalability, and many other features.
You can refer to this article to understand the differences between the two offerings and also use it as a recommendation guide.
More to explore
Azure Monitor | Microsoft Docs
Excellent article. Thanks for sharing