
Executive summary
Our testing shows that Azure SQL Database can be used as a highly scalable low latency key-value store. Starting with a cost-efficient 4-core General Purpose database, we see an order of magnitude increase in workload throughput as we increase dataset size by 100x and scale across the spectrum of database SKUs to a Business Critical database with 128 cores, with read and write latency remaining in single-digit milliseconds.
Key-value store in a RDBMS
Azure SQL is a relational database, so the title of this blog may come as a surprise. But Azure SQL is also a general-purpose database. The strength of a general-purpose DBMS is in accommodating multiple data models and designs, not all of them necessarily relational, in the same physical database, and still providing robust functionality and sufficiently good performance and scale. To that end, in addition to representing data relationally using tables, columns, and rows, Azure SQL also provides multi-model capabilities, including support for JSON, XML, and Graph data. Regardless of data model, developers can continue using familiar SQL language.
One non-relational data model popular among developers is key-value store. There are many specialized key-value data stores, each with its unique capabilities and strengths. In this blog we will take a closer look at the performance and scalability of Azure SQL Database, when used as a key-value store.
To do that, we will use YCSB, or Yahoo! Cloud Serving Benchmark. To quote from the project Github page, The goal of the YCSB project is to develop a framework and common set of workloads for evaluating the performance of different “key-value” and “cloud” serving stores. YCSB is a mature benchmark. In the last 10 years, it has been used to test well-known NoSQL and key-value data stores, such as Cassandra, MongoDB, Redis, DynamoDB, and many others, over thirty in total. Notably, YCSB also supports JDBC as a generic interface to relational databases. Our YCSB tests used JDBC to talk to Azure SQL.
Test workload
YCSB provides several canned workloads. For our tests, we chose Workload A in default configuration. This is an update heavy workload with a 50/50 read/write ratio and a uniform distribution of read and write requests across the dataset.
In a relational database, YCSB uses a single table to represent the key-value dataset:
CREATE TABLE usertable (
YCSB_KEY varchar(255) NOT NULL,
FIELD0 varchar(100) NOT NULL,
FIELD1 varchar(100) NOT NULL,
FIELD2 varchar(100) NOT NULL,
FIELD3 varchar(100) NOT NULL,
FIELD4 varchar(100) NOT NULL,
FIELD5 varchar(100) NOT NULL,
FIELD6 varchar(100) NOT NULL,
FIELD7 varchar(100) NOT NULL,
FIELD8 varchar(100) NOT NULL,
FIELD9 varchar(100) NOT NULL
CONSTRAINT pk_usertable PRIMARY KEY (YCSB_KEY)
);
We kept the default YCSB schema with a key column and ten value columns, but used the varchar(100) data type for value columns instead of the default text, which is deprecated in SQL Server.
As the first step before running each test, we used YCSB to load this table with a configurable number of rows. In the generated dataset, each FIELD[N] column contains a string of random 100 characters. With the default workload configuration, each read request is a SELECT query returning one row matching a given YCSB_KEY value, with all columns included in the result set, and each write request is an UPDATE query updating one of FIELD[N] columns for a given YCSB_KEY value. Each test runs as many total operations (requests) as there are rows in the table. With a 50/50 read/write ratio, these total requests are split about equally between SELECT and UPDATE queries.
Single-row requests are common in key-value stores. On one hand, such queries are simple for the query processing engine of a relational database to optimize and execute. Query execution plans we observed were trivial. On the other hand, using single-row queries creates a very chatty workload, with respect to both network and storage traffic. For chatty workloads, higher (when compared to typical latencies in on-premises data centers) network and storage latencies in public cloud may create a performance challenge.
YCSB supports many configuration options for its core workloads, and supports building custom workloads as well. In our testing, we intentionally chose to focus on a more challenging update heavy workload and larger datasets (10 million – 1 billion rows) to determine performance and scalability across the range of Azure SQL Database SKUs.
Running YCSB against Azure SQL
Our testing started with a relatively small and cost-efficient database, and then tested two increasingly larger SKUs from the spectrum of Azure SQL Database offerings. Our testing environment is described in the Appendix.
Entry level database
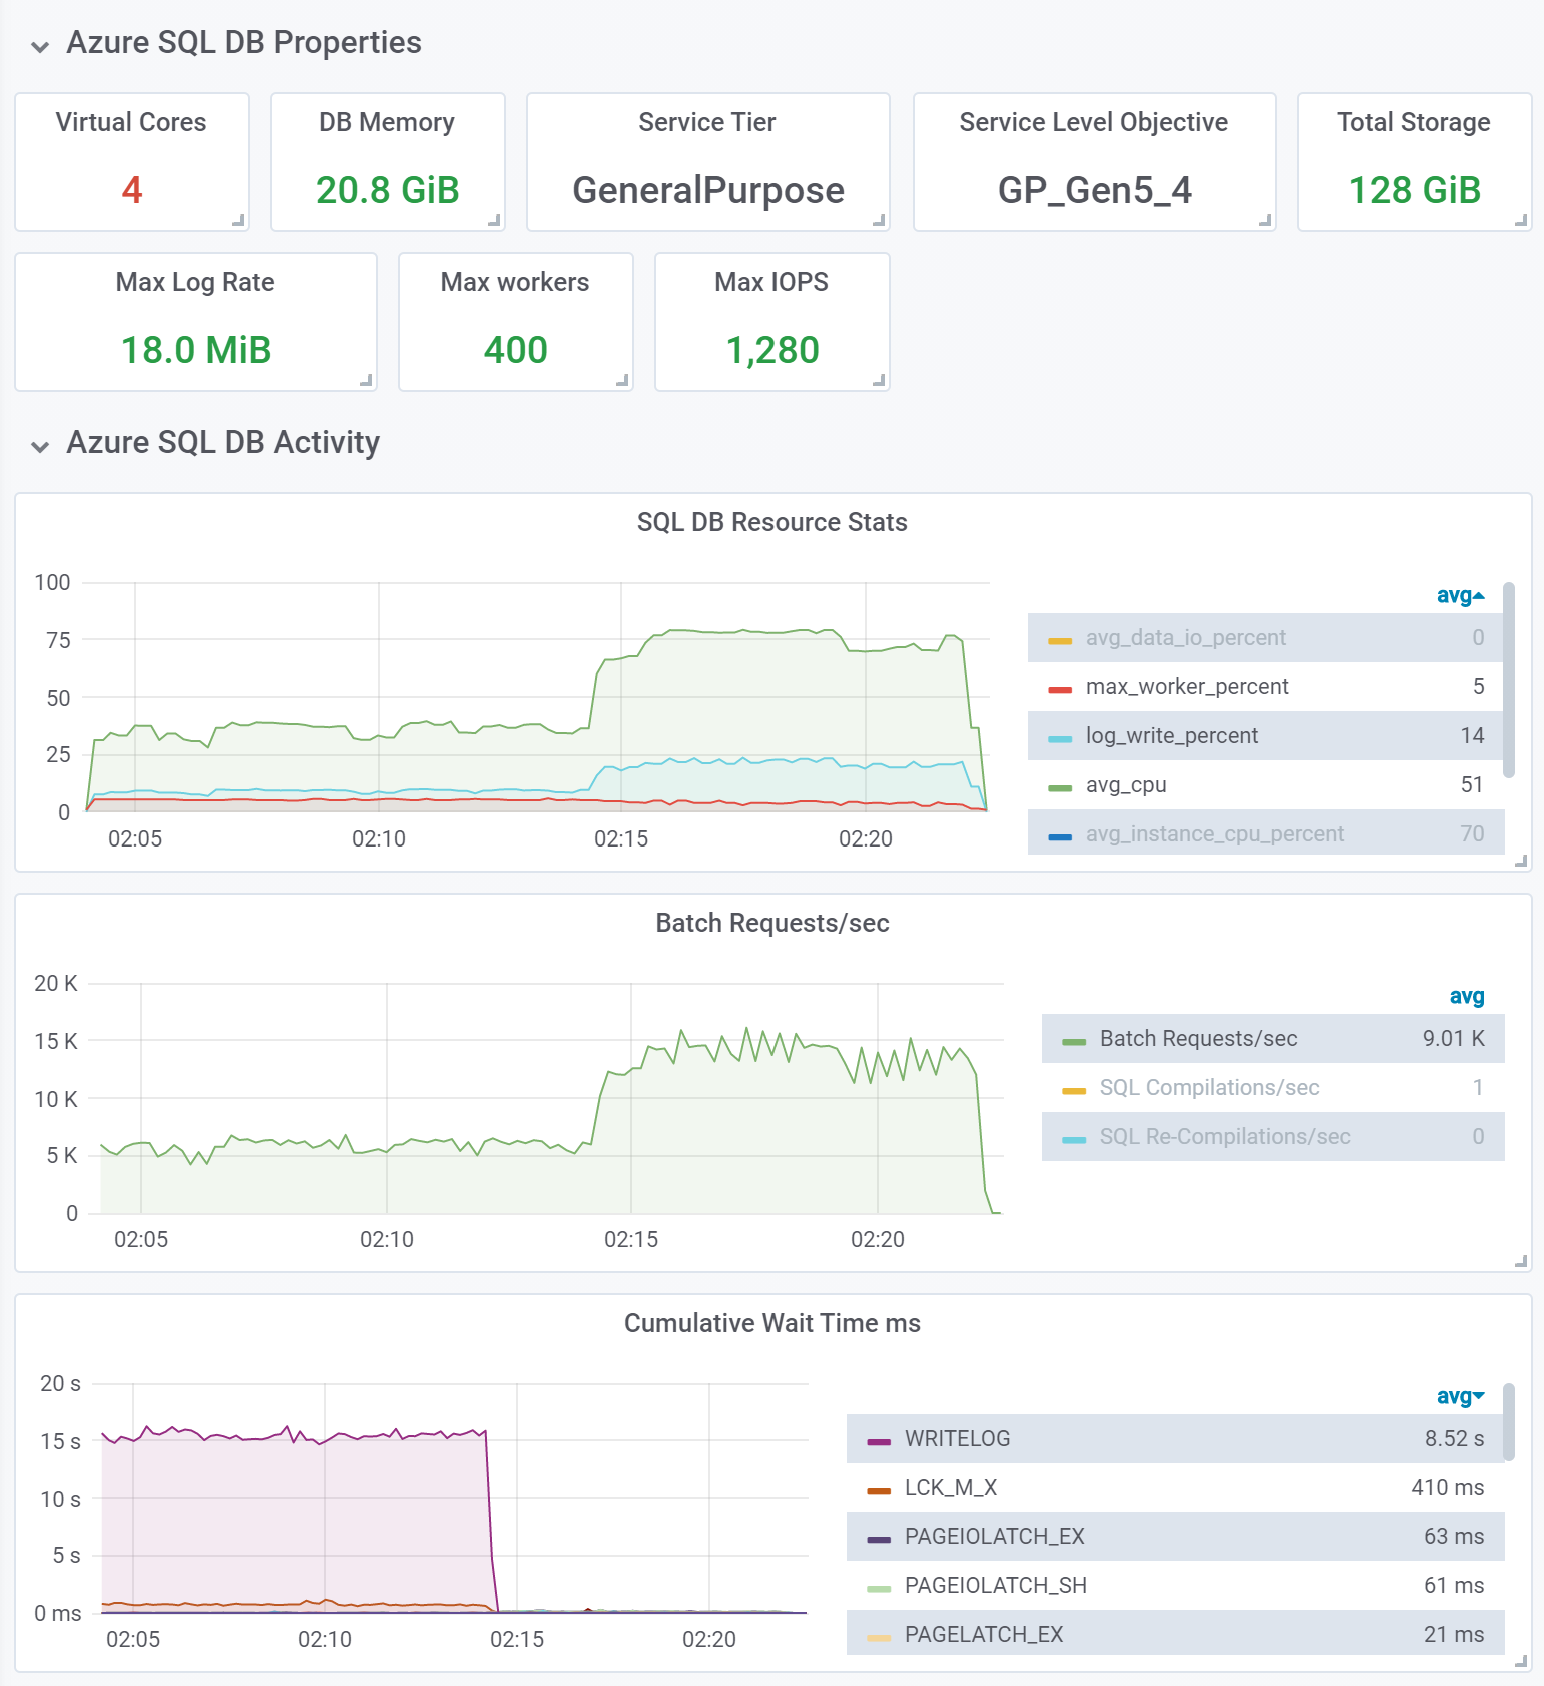
Our first test was on a General Purpose database with 4 CPU cores and 20 GB of memory, using Gen5 hardware. General Purpose databases use Azure Premium storage, which is remote (network attached) with respect to the machine running the database engine.
With a 10 million row dataset, and using 20 concurrent threads issuing requests against the database, we observed the following results (here and below we show abbreviated output from YCSB at the end of a test run):
YCSB output:
[OVERALL], RunTime(ms), 1089898
[OVERALL], Throughput(ops/sec), 9175.170520544125
[READ], Operations, 4999607
[READ], AverageLatency(us), 1106.8701749957547
[READ], MinLatency(us), 183
[READ], MaxLatency(us), 311807
[READ], 95thPercentileLatency(us), 2265
[READ], 99thPercentileLatency(us), 4767
[READ], Return=OK, 4999607
[UPDATE], Operations, 5000393
[UPDATE], AverageLatency(us), 3176.099026216539
[UPDATE], MinLatency(us), 224
[UPDATE], MaxLatency(us), 313087
[UPDATE], 95thPercentileLatency(us), 7403
[UPDATE], 99thPercentileLatency(us), 15175
[UPDATE], Return=OK, 5000393
Observations:
- This 18-minute test started at a relatively low throughput of about 5,800 batch requests per second, or, in YCSB terms, operations per second (ops/sec). We see that the primary wait type in the database, by far, is WRITELOG. This is not surprising – as we mentioned, a General Purpose database uses remote storage, so when each single-row UPDATE statement in this write-heavy workload commits and writes to the transaction log, the database engine must wait for an acknowledgement from storage that data has been hardened. Thus, on each commit we incur the latency of a network round-trip call, and that leads to high WRITELOG waits. Performance impact of higher network and storage latency can be reduced using batching techniques, as described in this documentation article. This is the recommended approach; however, it requires application/workload changes. Another way to improve performance when storage write latency is high is to enable delayed durability. With delayed durability, transaction log writes no longer occur with every UPDATE statement. Instead, they occur when a log buffer in the database engine becomes full, which, with small transactions, happens much less frequently. Thus, the impact of high storage latency is greatly reduced.
- About half-way into this test, we enabled delayed durability on the test database. The sharp inflection point at around 02:14 demonstrates the positive performance impact. WRITELOG waits have all but disappeared, throughput sharply increases to around 14,000 batch requests per second, and there is a corresponding increase in CPU utilization and transaction log write rate. Write latency has sharply decreased as well. Important warning: Delayed durability means that data modified in recently committed transactions may be permanently lost if the database engine crashes. Despite a drastic improvement in throughput and latency, this is not an option that can be enabled indiscriminately and without considering pros and cons. Nevertheless, we wanted to show the positive performance impact this achieved, because in some scenarios, such as dev/test workloads or when processing transient data, the possibility of bounded data loss may be acceptable. In those cases, using the less expensive General Purpose service tier with delayed durability enabled, rather than a more expensive Premium or Business Critical database with low latency local storage, can achieve your performance goals. When considering delayed durability, keep in mind that it can be enabled per-transaction. That is useful if most data in the database must be fully durable, but for some transactions, higher throughput is preferred to full durability.
- Even with increased throughput in the second part of the test, the workload did not consume all available resources (CPU, log write, worker threads). Other workloads against the same database could still run using remaining resource capacity.
Mid-range database
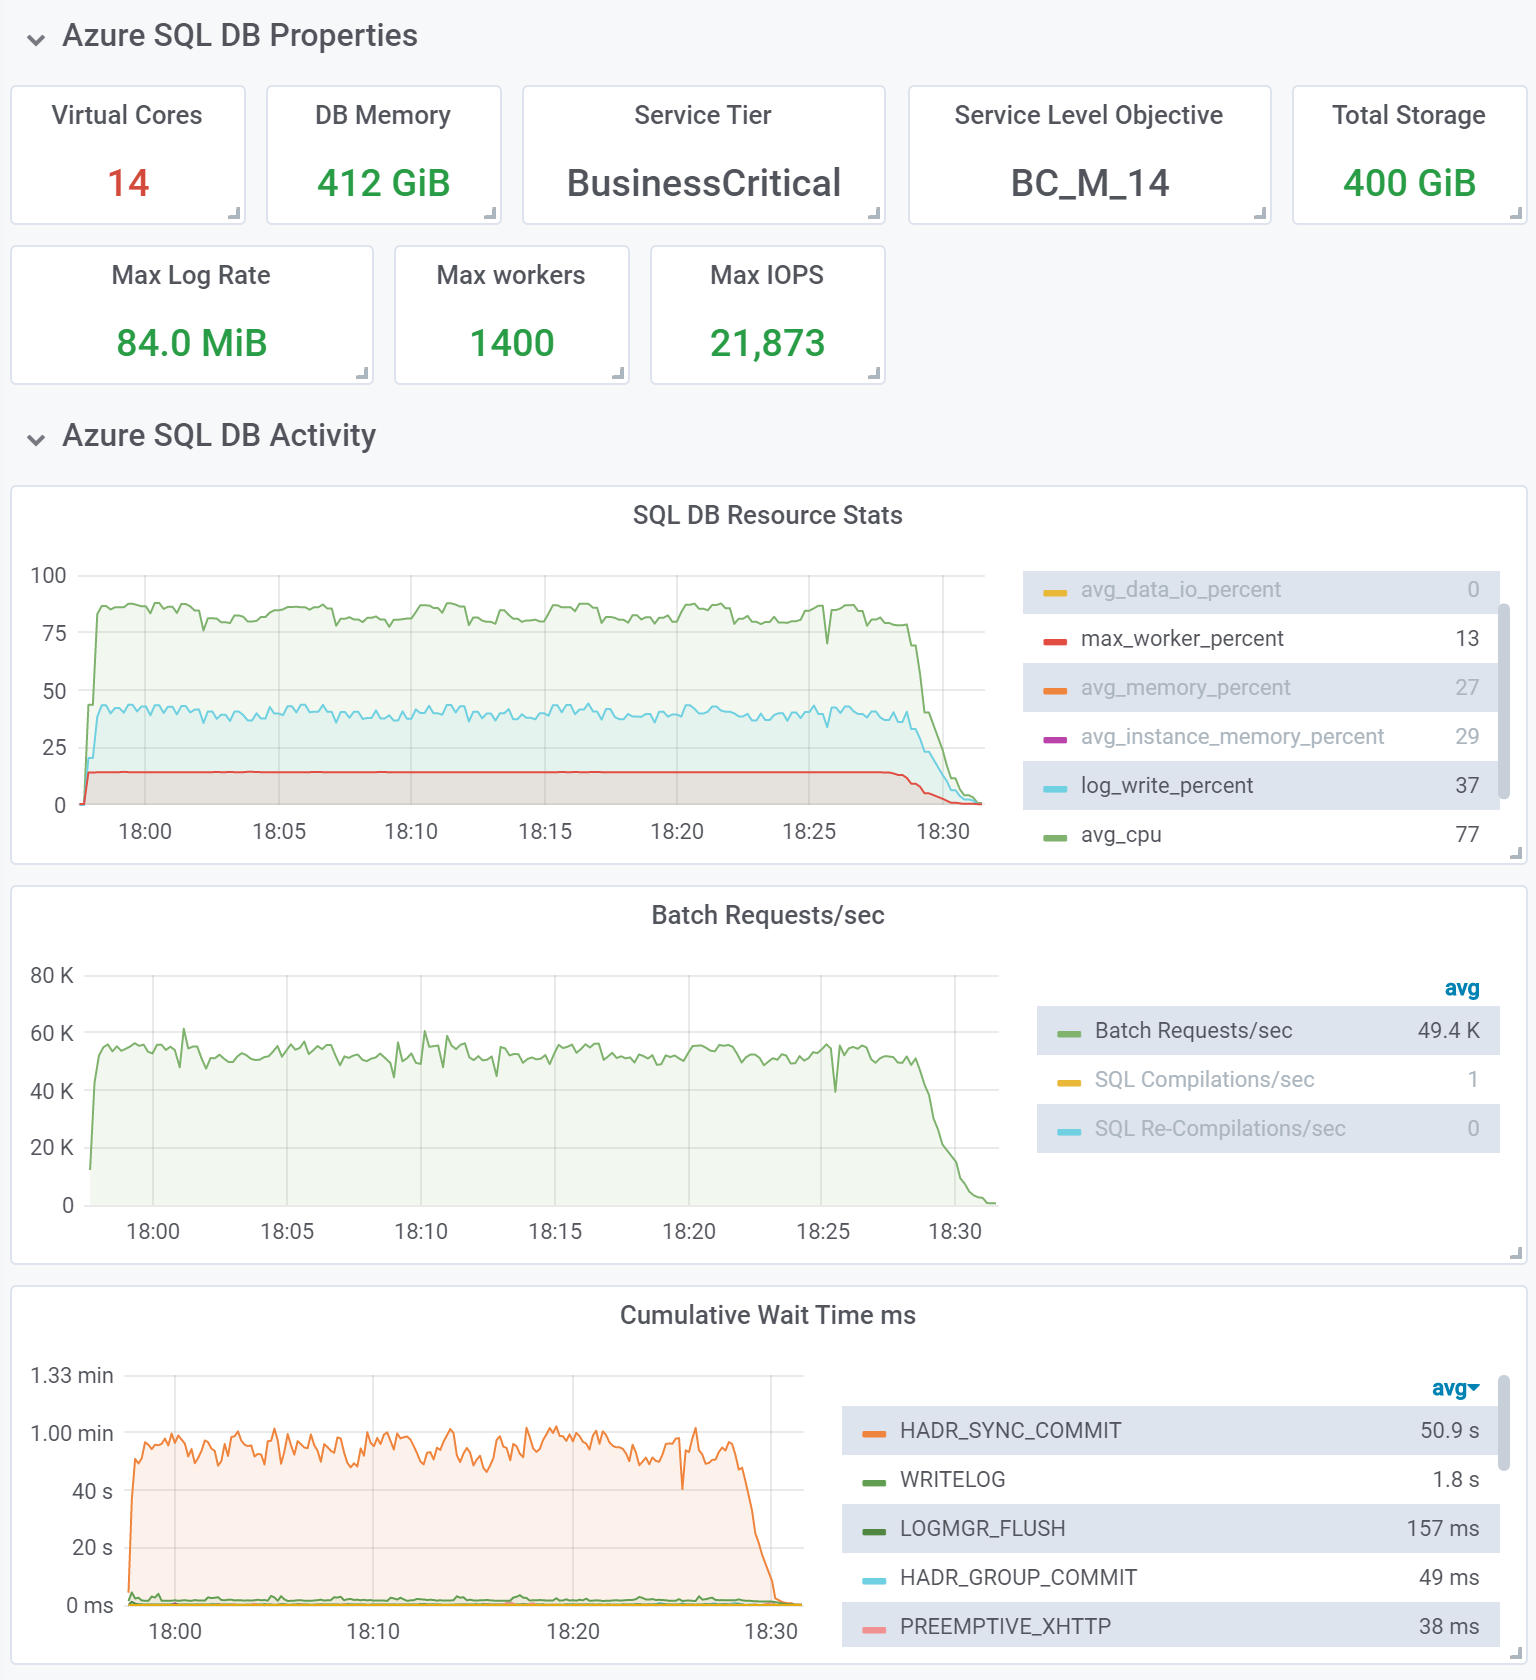
Our next test was on a Business Critical database with 14 CPU cores and 412 GB of memory, using M-series hardware. We used a 100 million row dataset, and ran the test with 200 concurrent threads issuing requests against the database. In other words, we increased dataset size and workload intensity 10x compared to the previous test. Unlike in the previous test, delayed durability was disabled.
We made one important change to the test table, making it a memory-optimized table:
CREATE TABLE usertable
(
YCSB_KEY varchar(255) NOT NULL,
FIELD0 varchar(100) NOT NULL,
FIELD1 varchar(100) NOT NULL,
FIELD2 varchar(100) NOT NULL,
FIELD3 varchar(100) NOT NULL,
FIELD4 varchar(100) NOT NULL,
FIELD5 varchar(100) NOT NULL,
FIELD6 varchar(100) NOT NULL,
FIELD7 varchar(100) NOT NULL,
FIELD8 varchar(100) NOT NULL,
FIELD9 varchar(100) NOT NULL
CONSTRAINT pk_usertable PRIMARY KEY NONCLUSTERED HASH (YCSB_KEY) WITH (BUCKET_COUNT = 100000000)
)
WITH (MEMORY_OPTIMIZED = ON);
A memory-optimized table is well suited for this workload. Not only does it eliminate reads from disk, it also supports very efficient single-row lookups in SELECT and UPDATE queries using a hash index on the YCSB_KEY column.
With a large dataset now fully resident in memory, using M-series hardware becomes very attractive, because it provides 29 GB of memory per core, compared to 5.1 GB per core on Gen5 hardware. Because Azure SQL databases are priced per core, for the same total amount of memory M-series databases are much less expensive than Gen5 databases. For example, if we had chosen Gen5 hardware for this test, we would need to use a much more expensive database with 80 cores to get the amount of memory we needed for this 100 million row dataset, instead of only needing 14 cores with M-series.
YCSB output:
[OVERALL], RunTime(ms), 2048116
[OVERALL], Throughput(ops/sec), 48825.35950112201
[READ], Operations, 50003240
[READ], AverageLatency(us), 2645.3984274019044
[READ], MinLatency(us), 1003
[READ], MaxLatency(us), 389887
[READ], 95thPercentileLatency(us), 4447
[READ], 99thPercentileLatency(us), 8055
[READ], Return=OK, 50003240
[UPDATE], Operations, 47735666
[UPDATE], AverageLatency(us), 4838.112348573915
[UPDATE], MinLatency(us), 1646
[UPDATE], MaxLatency(us), 386559
[UPDATE], 95thPercentileLatency(us), 7219
[UPDATE], 99thPercentileLatency(us), 11071
[UPDATE], Return=OK, 47735666
[UPDATE], Return=ERROR, 2261094
Observations:
- In this 35-minute test, the average throughput is 48,825 ops/sec, which is an almost 10x increase compared to the first test, despite a 10x increase in dataset size. Yet the increase in CPU capacity was only 3.5x, from 4 cores to 14 cores. The qualitative performance improvement in this test is due to using a memory-optimized table, and due to using low latency local SSD storage in this Business Critical database.
- The dominating wait type is no longer WRITELOG, it is HADR_SYNC_COMMIT. This wait type is encountered when the database engine synchronously commits each transaction to database replicas in an availability group, used to implement high availability for Business Critical databases. While transaction commits still require a network round trip between compute nodes hosting the primary and secondary replicas, the latency of writes to local SSD storage is much lower than to remote Azure Premium storage.
- As in the previous test, there is remaining headroom to sustain other workloads in the same database, in addition to the key-value store workload we are running.
- In the output from YCSB above, we see that some UPDATE calls failed with an error. The error number is 41302, and the message is The current transaction attempted to update a record that has been updated since this transaction started. The transaction was aborted. This happens because with memory-optimized tables, the database engine uses optimistic concurrency model by design. Transaction isolation and consistency are validated at commit time, and if a conflict is detected, all but one of the conflicting transactions are aborted. The application is expected to implement retry logic to deal with this, as described in Transactions with Memory-Optimized Tables. (As an aside, optimistic concurrency is a common approach in NoSQL key-value stores, where similar error handling is required.) But since YCSB is talking to the Azure SQL database via a generic JDBC interface, it has no provision for handling this kind of database engine-specific errors. That said, a relatively small number of failed UPDATEs observed in this test does not materially change the overall throughput.
High-end database
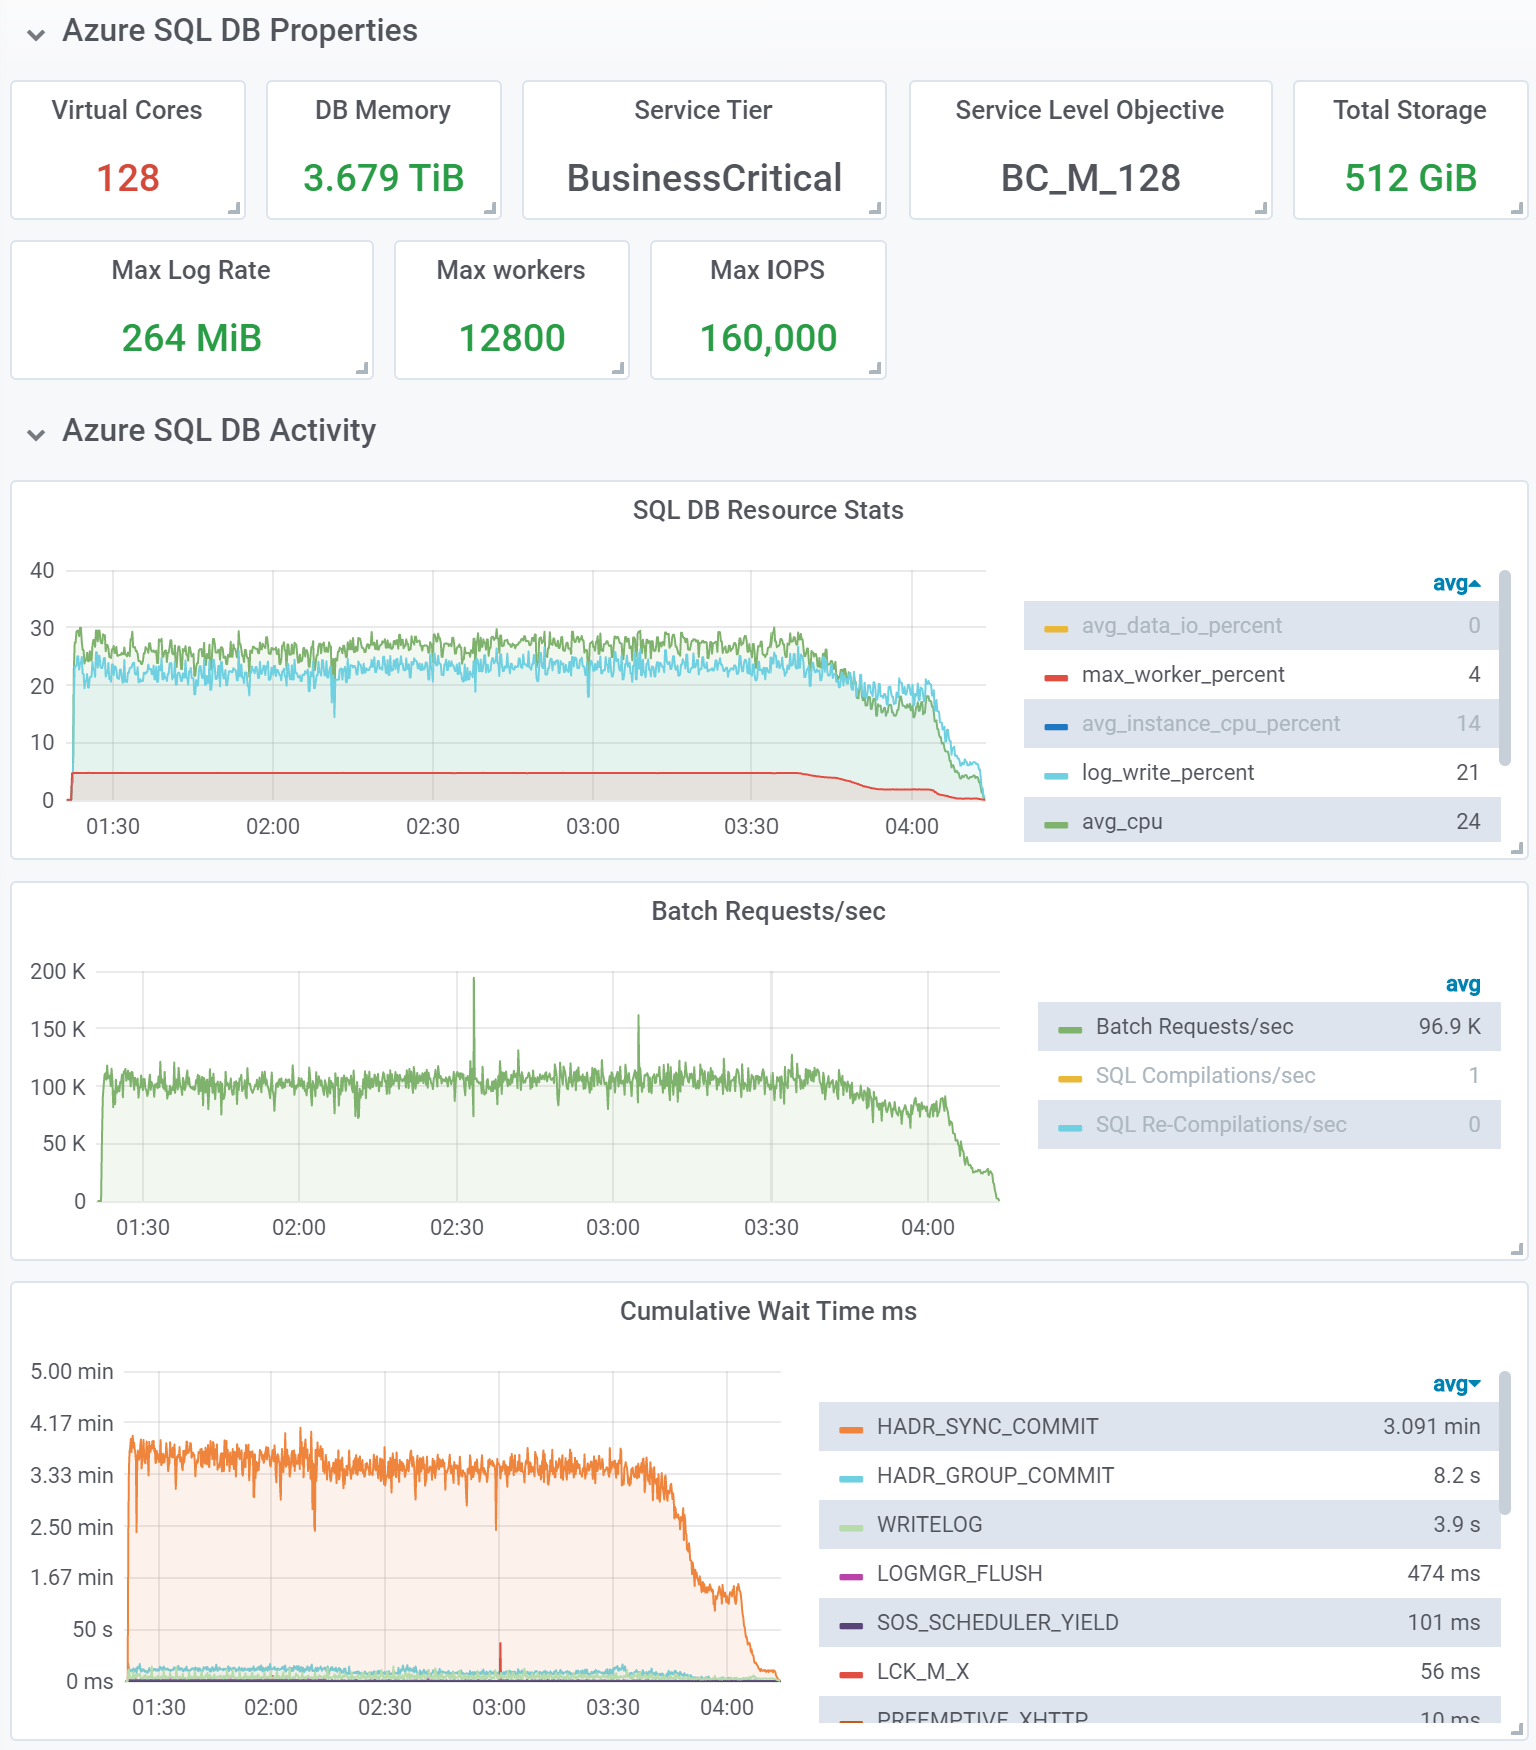
In our next and final test, we wanted to get to the far end of the scalability spectrum in Azure SQL. To that end, we used a Business Critical database with 128 CPU cores and 3.7 TB of memory on M-series hardware, which, as of this writing, is the largest available Azure SQL database in terms of CPU and memory capacity. This test was done with a 1 billion row dataset, using 600 concurrent workload threads. We continued using the same memory-optimized table, but increased the number of hash buckets tenfold to accommodate the 10x increase in dataset size.
YCSB output:
[OVERALL], RunTime(ms), 10292190
[OVERALL], Throughput(ops/sec), 97161.05124371004
[READ], Operations, 499994473
[READ], AverageLatency(us), 3254.8293574877175
[READ], MinLatency(us), 210
[READ], MaxLatency(us), 1798143
[READ], 95thPercentileLatency(us), 7011
[READ], 99thPercentileLatency(us), 22511
[READ], Return=OK, 499994473
[UPDATE], Operations, 439151009
[UPDATE], AverageLatency(us), 7248.006196554134
[UPDATE], MinLatency(us), 865
[UPDATE], MaxLatency(us), 1799167
[UPDATE], 95thPercentileLatency(us), 15071
[UPDATE], 99thPercentileLatency(us), 28783
[UPDATE], Return=OK, 439151009
[UPDATE], Return=ERROR, 60854518
Observations:
- This test achieved average workload throughout of approximately 97,000 ops/sec, doubling the throughput of the previous test. This was achieved with a 10x larger dataset, and sustained for over 2 hours until the workload began to ramp down at the tail end of the test.
- We continued seeing ample resource headroom, in terms of CPU, log write rate, and worker threads. CPU utilization was below 30%, and the 1 billion row dataset consumed only 57% of the quota for memory-optimized tables in this 128-core database.
Scaling further
Have we reached the limits in Azure SQL scalability in these tests? Not at all. To scale further, we can:
- Increase dataset size and workload threads, and/or use multiple YCSB clients to run the workload. As mentioned earlier, we haven’t exhausted compute capacity of chosen SKUs.
- Use readable secondary replicas to serve read requests, in scenarios where small data latency for read data is acceptable. This is particularly useful in the Hyperscale service tier, where multiple readable secondary replicas are supported. An application can implement a separate Get API reading from secondary replicas, to be used when appropriate.
- Shard the dataset and workload over multiple databases, to scale out both reads and writes. With simple one-table design of a key-value store in Azure SQL, sharding by key range becomes straightforward. Each shard can be scaled independently in accordance with workload demand.
- When using memory-optimized tables, also use natively compiled stored procedures for database reads and writes. While YCSB does not support calling database stored procedures over JDBC, an application using Azure SQL as a key-value store could easily implement this. A SELECT or UPDATE query in a natively compiled stored procedure (which is a C DLL loaded into the database engine process space) would be more efficient than the same query executed via interpreted T-SQL, and would provide higher throughput and lower latency.
- For some workloads, key-value data is purely transient and does not have to be durable at all. In that case, the memory-optimized table can be made non-durable. This eliminates all disk access, making the workload purely memory-resident, and further improving throughput and latency. An example of an application that achieved very high scale by implementing a key-value store using SQL Server non-durable memory-optimized tables is described in our earlier blog: How bwin is using SQL Server 2016 In-Memory OLTP to achieve unprecedented performance and scale.
Results
To recap the results, when using an entry-level General Purpose database with a 10 million row dataset, we observed the following throughput and latency:
| Service tier | General Purpose | General Purpose |
| CPU cores | 4 | 4 |
| Hardware generation | Gen5 | Gen5 |
| Table type | Disk | Disk |
| Durability | Full | Delayed |
| Dataset size (rows) | 10,000,000 | 10,000,000 |
| Workload threads | 20 | 20 |
| Average ops/sec | 5,860 | 13,640 |
| Average read latency (ms) | 0.6 | 1.4 |
| Average write latency (ms) | 6.5 | 1.4 |
We see a major improvement in throughput and write latency when delayed durability is used, but do heed the warning about potential data loss earlier in the article.
Switching to Business Critical databases and memory-optimized tables, we started with a 10x larger dataset, compared to earlier tests on General Purpose. We then increased the dataset by another 10x, to 1 billion rows. Despite these order of magnitude increases in dataset size, we saw 2-3x increases in throughput in each test, while keeping read and write latency in single-digit milliseconds.
| Service tier | Business Critical | Business Critical |
| CPU cores | 14 | 128 |
| Hardware generation | M | M |
| Table type | Memory-optimized | Memory-optimized |
| Durability | Full | Full |
| Dataset size (rows) | 100,000,000 | 1,000,000,000 |
| Workload threads | 200 | 600 |
| Average ops/sec | 48,825 | 97,161 |
| Average read latency (ms) | 2.7 | 3.3 |
| Average write latency (ms) | 3.2 | 7.3 |
Appendix
In this appendix we describe the details of testing environment we used.
The latest YCSB version as of this writing is v0.17.0. We weren’t able to use that version because of a YCSB configuration issue we ran into. As a workaround, we used the bits for the previous release, v0.16.0.
To run YCSB, we used an F16s_v2 Azure VM with 16 cores and 32 GB of memory, running Ubuntu 18.04. A smaller VM could be used for all but the last test, which required higher compute to sustain YCSB client load.
We set up YCSB using the steps in Getting Started, but downloading YCSB v0.16.0 as noted above.
After downloading and extracting YCSB bits to ycsb-0.16.0 directory, we modified the jdbc-binding/conf/db.properties file as follows:
db.driver=com.microsoft.sqlserver.jdbc.SQLServerDriver
db.url=jdbc:sqlserver://server-name-here.database.windows.net:1433;databaseName=database-name-here;sendStringParametersAsUnicode=false;disableStatementPooling=false;statementPoolingCacheSize=10;responseBuffering=full
db.user=ycsb
db.passwd=strong-password-here
db.batchsize=5000
jdbc.batchupdateapi=true
The JDBC driver parameters in the db.url configuration after the databaseName parameter are optional. We found that performance of the YCSB workload was slightly improved with this driver configuration.
We downloaded the latest Microsoft JDBC driver for SQL Server, v8.4.1. After extracting the bits, we copied the mssql-jdbc-8.4.1.jre11.jar file from sqljdbc_8.4/enu to jdbc-binding/conf/lib directory.
We installed JRE v11 using sudo apt install openjdk-11-jre-headless
We created a ycsb user with password in the test database, and granted this user SELECT, INSERT, and UPDATE permissions on the usertable table.
To load data, we used a command similar to the following:
bin/ycsb load jdbc -P workloads/workloada -p recordcount=10000000 -P jdbc-binding/conf/db.properties -cp mssql-jdbc-8.4.1.jre11.jar -threads 200 -s
This example loads 10 million rows into the database referenced in the db.properties file, using 200 concurrent threads. Note that data loading performance is greatly improved by setting jdbc.batchupdateapi to true, and specifying a sufficiently large value for db.batchsize. With this configuration, multiple rows will be committed to the database in the same transaction, reducing storage latency impact.
To run a test, we used a command similar to the following:
bin/ycsb run jdbc -P workloads/workloada -p operationcount=10000000 -P jdbc-binding/conf/db.properties -cp mssql-jdbc-8.4.1.jre11.jar -threads 200 -s
This example runs a test with 10 million operations. Note that the number of operations should be equal or less than the number of rows in the usertable table.
For tests using memory-optimized tables, we modified a database option as follows:
ALTER DATABASE CURRENT SET memory_optimized_elevate_to_snapshot ON;
We used a monitoring solution based on telegraf, InfluxDB, and Grafana to monitor database metrics during tests.
it says you used uniform distribution in your test though I do not see that in your workload command. The default distribution for YCSB is Zipfian and I’m curious what the difference in performance it may yield comparing both distribution algorithms.
(apologies for delayed response)
My assumption was that uniform distribution is the default. From https://github.com/brianfrankcooper/YCSB/wiki/Core-Properties#core-workload-package-properties:
requestdistribution: what distribution should be used to select the records to operate on – uniform, zipfian, hotspot, sequential, exponential or latest (default: uniform)
Perhaps I have misinterpreted that. Do you have a reference showing that zipfian is the default?
Yes, comparing performance with different distributions would be interesting, but we had to draw the line in how much we test simply for time reasons. The test environment wouldn't be too hard to set up if anyone wanted to expand these tests :).
This was a really cool test. Congrats!
Incidentally I am evaluating Kusto/ADX as a telemetry store and was wondering what special needs drove you away from using the default metrics engine and Log Analytics visualizations Azure already has built in? I’m not sure when the ADX to Grafana connector came online, maybe that’s it.
(apologies for delayed response)
In this context, no strong reason to prefer the monitoring solution we used over Azure native monitoring and visualizations. We used it simply because it is our de-facto monitoring solution for in-depth SQL performance investigations. Some of the advanced SQL metrics we need for those aren’t available in Azure Monitor today, but for the high-level resource usage and such it would probably be sufficient.