As developers, we want to build mobile apps that are not only beautiful and feature-rich, but also high-performance. We often think about ways we can optimize our network calls and background operations to be speedy, but users typically equate performance with the main component of a mobile app they interact with: the user interface. When it comes to UI performance, a smooth experience can often be defined as a consistent 60 frames per second (fps), meaning we have to render a frame every 16 ms. In this blog post, you’ll learn some tips and tricks for identifying and debugging your app’s user interface for maximum performance.
Why 60 fps?
App animations and transitions are just a series of still images, or frames. The trick is to display these individual frames fast enough to trick the human brain into thinking a fluid motion is occurring. 60 frames per second is the sweet spot for smooth motion, but drops in framerates will be obvious to the human eye, which is explained more by Colt McAnlis in this video. This gives our whole frame process a little less than 16 ms to fully draw a frame on the screen. Now that we know what we want to achieve, how do we go about ensuring our app meets this performance requirement?
Identifying the Problem
Have you ever experienced anything like this with your application?
 Credit: Doug Sillars for the great example.Scrolling is extremely choppy and, as a result, the user interface doesn’t seem responsive to the user. During the time that the application is unresponsive and choppy, if the user attempts to interact with the application and it takes longer than 5000 ms (5 seconds) for the application to respond, the Android OS will give us this lovely message:

Or maybe you’ve seen the following in your logs:
I/Choreographer(1200): Skipped 60 frames! The application may be doing too much work on its main thread.
This is the Android Choreographer warning you in advance that your application is not performing with the buttery smooth experience we’re aiming for. In fact, it’s telling you that you’re skipping frames and not providing your users a 60 FPS experience. We can do better! Here’s the basic process for identifying and fixing UI performance issues:
- Measure overall UI performance with Systrace to get a baseline.
- Use Hierarchy Viewer to identify and flatten view hierarchies.
- Reduce overdraw by flattening layouts and drawing less pixels on screen.
- Enable StrictMode to identify and make fewer potentially blocking calls on the main UI thread.
Getting Started
Counting Skipped Frames
Android refers to these skipped or delayed frames as janky frames. After your application has been running and interacted with to reproduce janky frames, run the following command:
adb shell dumpsys gfxinfo [PACKAGE_NAME]
This command will output something similar to the following:
Stats since: 524615985046231ns
Total frames rendered: 8325
Janky frames: 729 (8.76%)
90th percentile: 13ms
95th percentile: 20ms
99th percentile: 73ms
Number Missed Vsync: 294
Number High input latency: 47
Number Slow UI thread: 502
Number Slow bitmap uploads: 44
Number Slow issue draw commands: 135
Numbers never lie, so it’s apparent we have some janky frames (~9%). Let’s dig in further with the Systrace tool.
Using the Systrace Tool
Systrace gives you an overview of the whole Android system and tells you what’s going on at specific intervals of time.
Getting Started
Let’s start a Systrace on our device. First open Android Device Monitor to get started. Once inside, we see the option to start a Systrace:

We’re then prompted with a request for what we would like to trace. Selecting all of the Commonly Used Tags and leaving the Advanced Options deselected will generate a trace.html file for the Trace Duration that you specify.
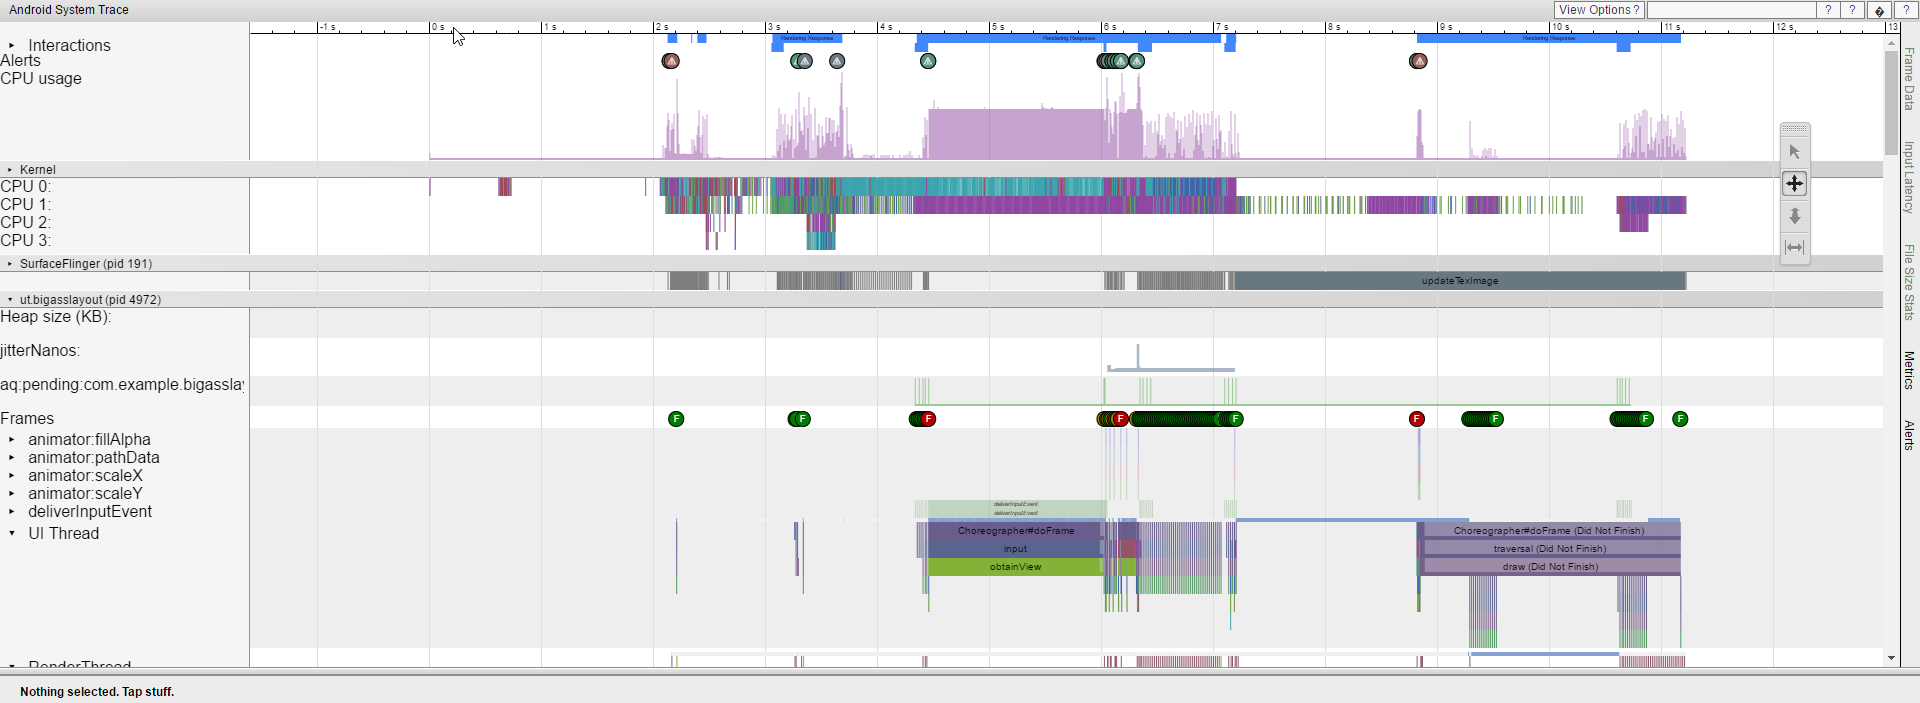
Here’s an example of a Systrace over 30 seconds:

Okay great! But what does this all mean? Let’s take it a step at a time.
We can see that we have a number of alerts identified by the circular warning signs in our Alerts row. Taking a look at our process, we can see a row of frames. Frames colored yellow or red are those that exceed our 16 ms render time.
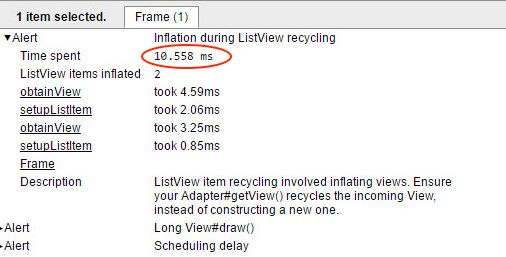
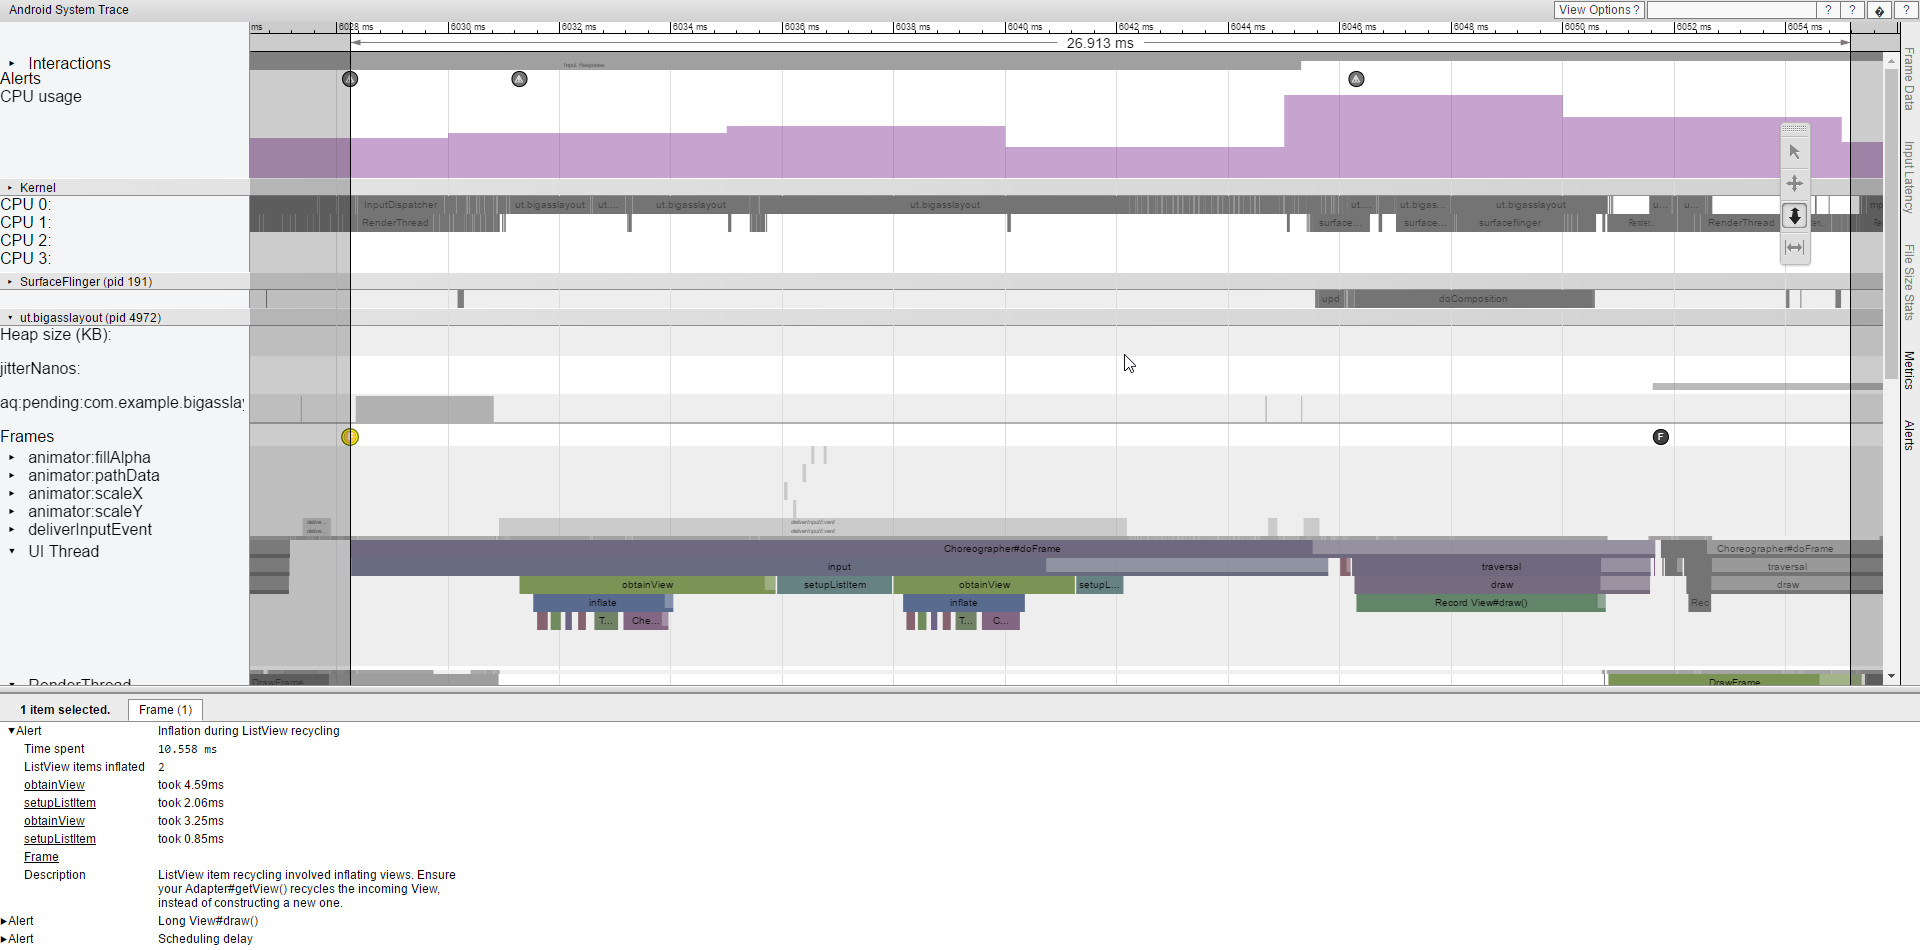
Clicking on the alert will show us an overview of the issue at the bottom of our trace window. We can drill down to the specific frame(s) in question by clicking on the correlating frame icon in the process, or by simply clicking Frame in the alert description. This will show us the amount of time spent during this step:

Finally, you can mark that frame using the m hotkey and zoom in to the affected frame to see what work is being done on various threads, such as CPU Threads, the UI Thread, and the RenderThread.

This example is showing a yellow frame, but we can get a general idea of what a performant frame might look like.
From our Alert, we can see that we might want to avoid significant work in View.OnDraw() or Drawable.Draw(), especially allocations or drawing to Bitmaps. Google gives us a tip to watch in this video.
For our Frame, we can see that our Adapter.GetView() should recycle the incoming View instead of creating a new one.
Systrace Terms
Frame Color
- Green: Great performance
- Yellow: Less than ideal performance
- Red: Bad performance
Scheduling Delay
Scheduling delays happen when the thread that is processing a specific slice wasn’t scheduled on the CPU for a long amount of time. Thus it takes longer for this thread to fire up and complete.
Wall Duration
The amount of time that passed from the moment a slice is started until it’s finished.
CPU Duration
The amount of time the CPU spent processing that slice.
Overdraw
Overdraw is excessive redraw of our user interface, resulting in a slow user interface experience (for layout inflation, animations, etc.). Debugging overdraw is fairly easy; we can enable diagnostics for this in your Android device’s settings by going to Settings -> Developer Options -> Debug GPU overdraw -> Show overdraw areas.
Once enabled, you will see many different colors on your layouts.
- White: No overdraw
- Blue: Pixels that are 1x overdrawn
- Green: Pixels that are 2x overdrawn
- Pink: Pixels that are 3x overdrawn
- Red: Pixels that are 4x overdrawn
Bad Layout Performance: Good Layout Performance:


You can then identify why this layout might be overdrawing so much via a tool such as Hierarchy Viewer.
Hierarchy Viewer
The first thing we want to know regarding our View Hierarchy is how deep or nested our layouts are. The more nested layouts are, the more GPU overdraw we’ll typically have.
Let’s take the previous example of bad layout performance:

We can see that we are four layers deep, which is less than ideal for our ListView. We really need to flatten this user interface out.

Okay that’s a little better! We’re only three layers deep now. However, UI performance still isn’t great. Let’s try to remove one more layer.

Much better! We just optimized our whole view hierarchy and will reap the performance benefits. Let’s take a look at the overall Layout and Draw timings for proof.
- Bad Layout: 31 views / Layout: 0.754 ms / Draw: 7.273 ms
- Better Layout: 26 views / Layout: 0.474 ms / Draw: 6.191 ms
- Good Layout: 17 views / Layout: 0.474 ms / Draw: 1.888 ms
StrictMode
StrictMode is a very useful tool for battle testing your application. Enabling StrictMode ensures you’re not putting extra work in certain places in your application, such as disk reads, disk writes, and network calls, to help you deliver a great user experience. In a nutshell, StrictMode does the following:
- Logs a message to
LogCatunder theStrictModetag. - Displays a dialog (If
PenaltyLog()is enabled). - Crashes your application (If
PenaltyDeath()is enabled).
This can help you determine what type of policies you’d like to battle test your application against.
You can enable StrictMode in your Android application by adding something like the following to your Activity:
protected override void OnCreate(Bundle bundle)
{
    StrictMode.SetThreadPolicy(new StrictMode.ThreadPolicy.Builder().DetectAll().PenaltyLog().Build());
    StrictMode.SetVmPolicy(new StrictMode.VmPolicy.Builder().DetectLeakedSqlLiteObjects().DetectLeakedClosableObjects().PenaltyLog().PenaltyDeath().Build());
    base.OnCreate(bundle);
}
Wrapping Up
In this blog post, we covered tools including Systrace, GPU overdraw, Hierarchy Viewer, and StrictMode to pinpoint performance related issues in your application and fix them. By using these tools, we can help ensure we’re delivering Android applications to our users with excellent rendering performance that achieves a buttery-smooth 60fps.
