A new Xamarin Profiler preview is available for download today. This release focuses on boosting performance and improving usability. Here’s a rundown of some of our favorite features:
Time Range Selection
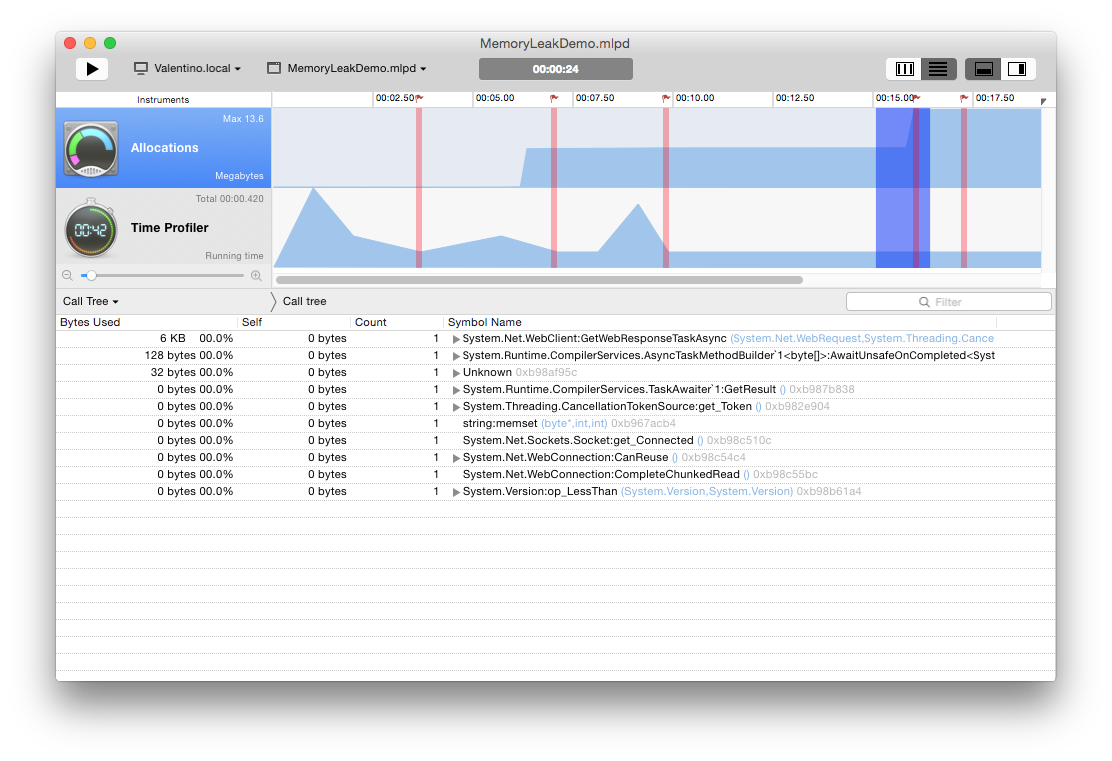
Time range selection lets you highlight an interesting area in the instrument chart and limit the profiling data to a specific time period. Use it to explore a sudden peak in memory usage, keep tabs on performance while your app is running a particular task, or just limit your scope to a manageable amount of data.
Better Snapshots
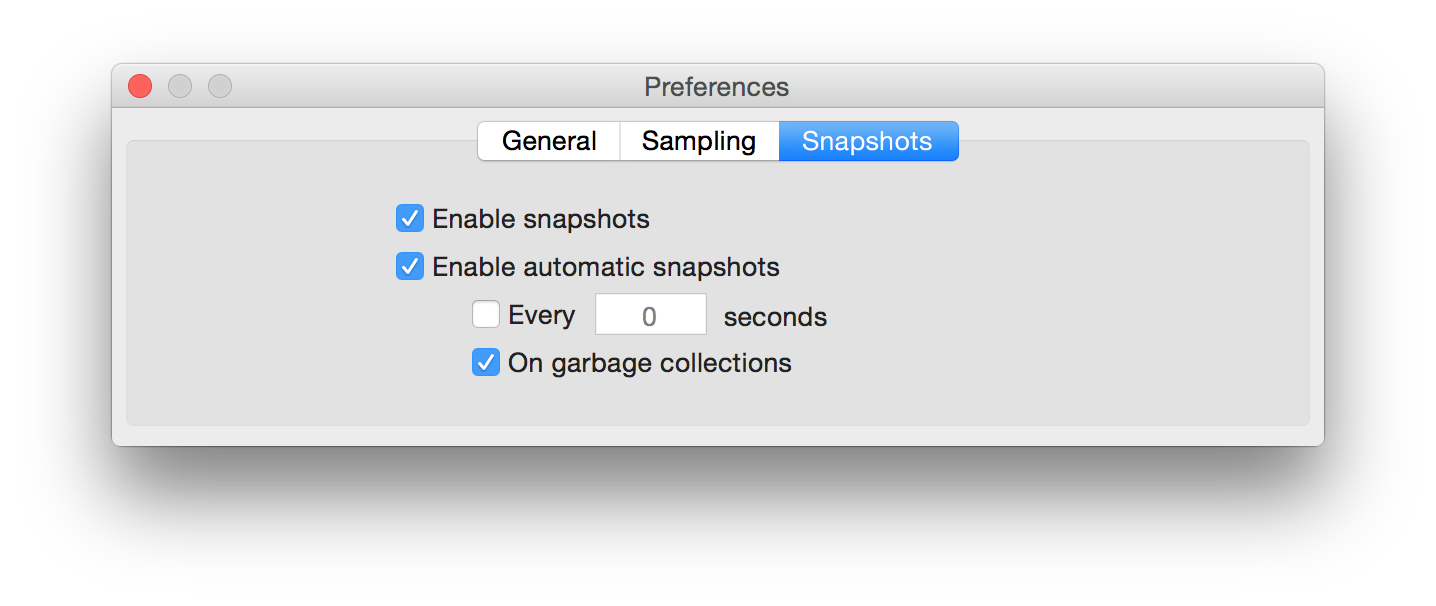
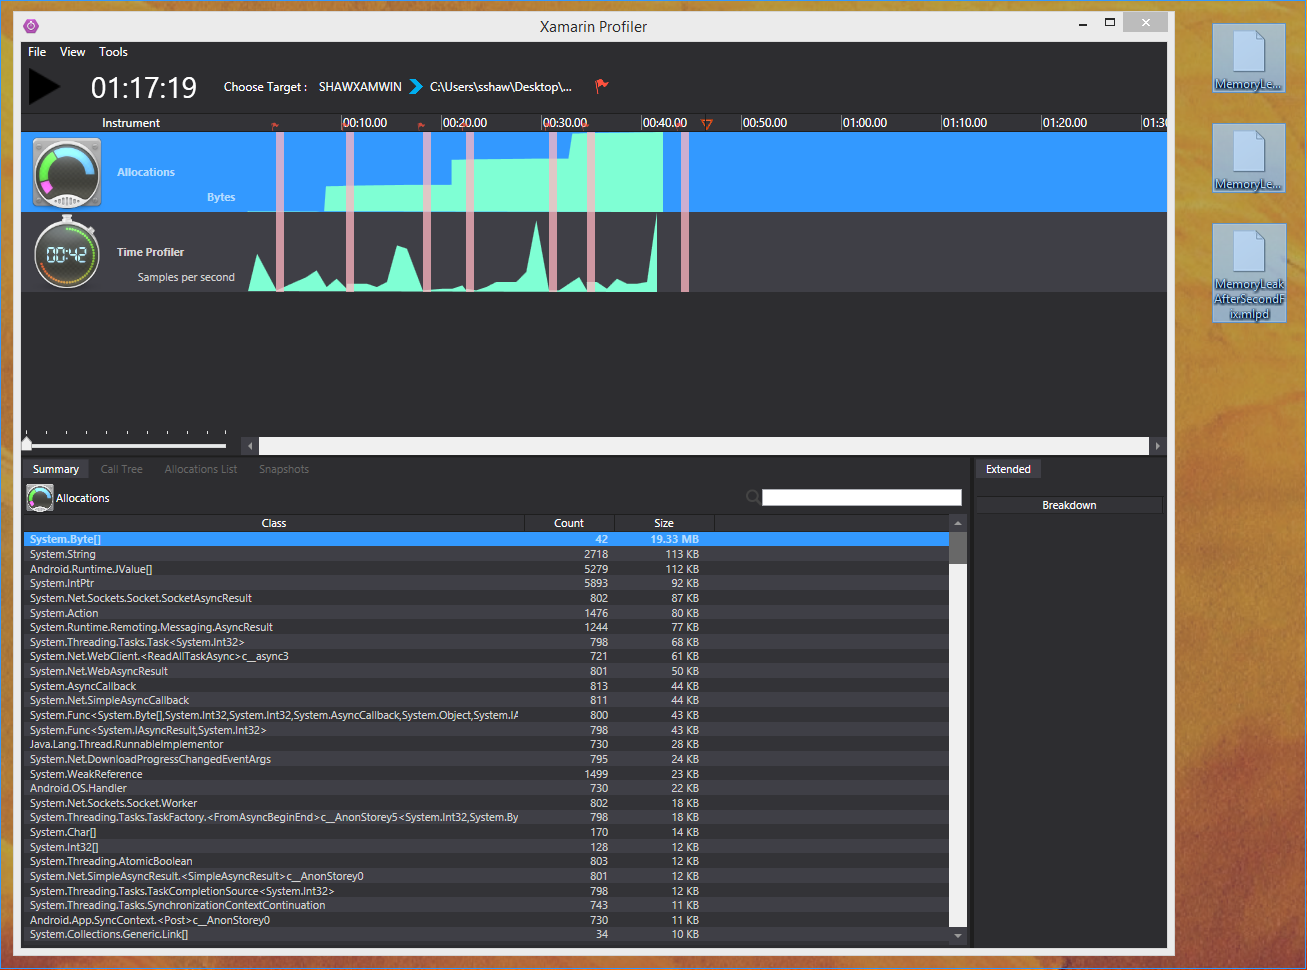
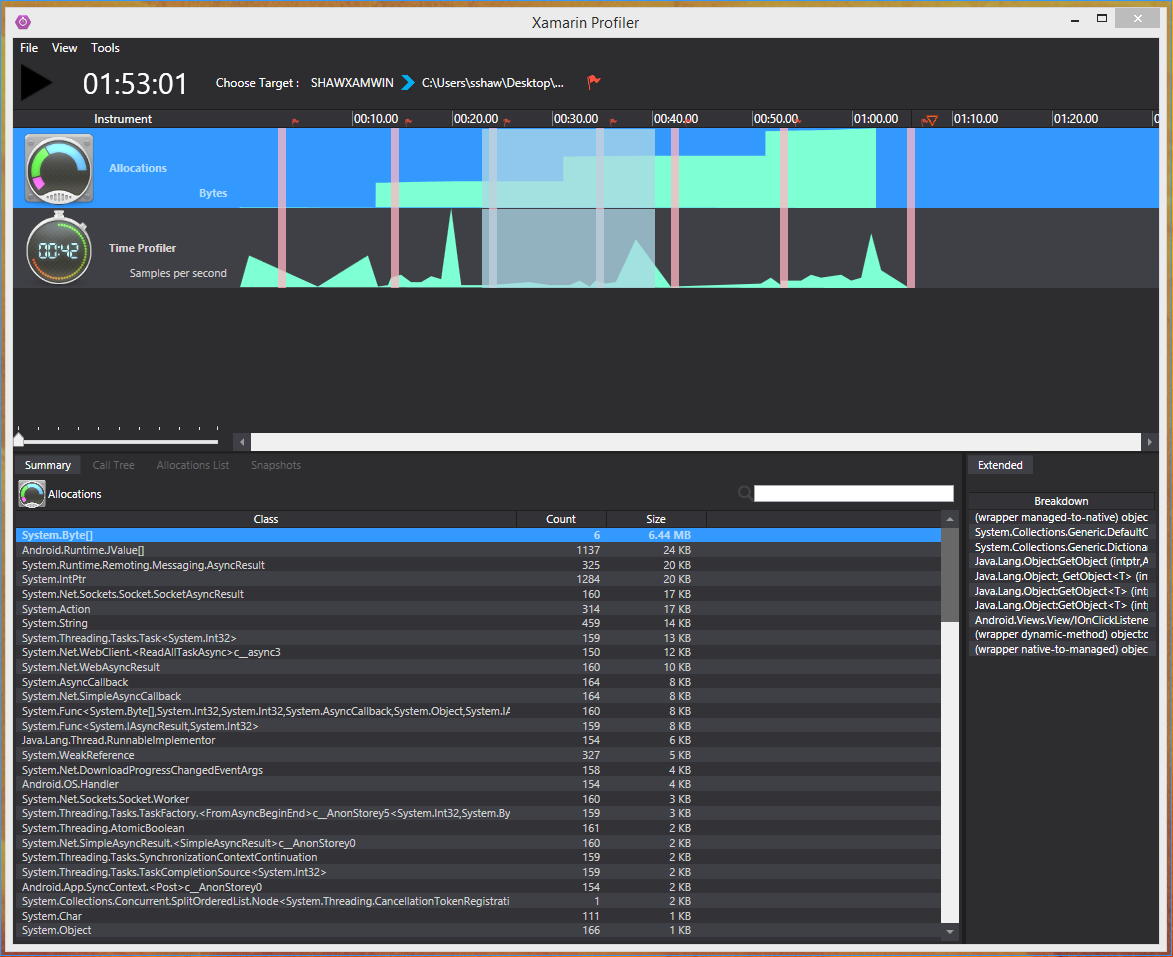
Snapshot automation allows you to set the profiler to take snapshots at regular intervals during your profiling session. The snapshots panel also supports rough snapshot comparison, so you can see when memory usage dropped between snapshots (marked in red).
Before memory fix:

After memory fix:

And More!
Xamarin.Mac Support – We’ve added initial support for profiling desktop applications built with Xamarin.Mac. Now, your Mac desktop apps can be just as polished as your mobile apps!
Preferences Panel – You can set all your preferences for sampling, snapshots, and more in one place.

Drag & Drop for Windows – One of our favorite new features is the addition of drag & drop to the Windows version of the Xamarin Profiler. You can load saved files of previous runs by simply dragging and dropping them into the Profiler interface.

Get it Now
The new Profiler preview is available for download from the Profiler landing page. In addition to the new features, we’ve addressed many customer-reported bugs, issues, and requests. A full list of improvements is captured in the release notes.
Get in touch with our team on the Xamarin Forums and let us know what you think of the new features!


