We’re happy to share the highlights of the latest Visual Studio 2017 preview, which is now available for download, including:
- Emulator and Designer improvements when developing mobile Android apps, and Xamarin.Android support of Android P Developer Preview 1
- C++ development improvements
- Ability to fine-tune solution load configuration settings to maximize performance
- Significant new functionality in the CPU Usage tool to help you profile your applications’ performance
- Improvements to make it easier to build and debug extensions
This Preview builds upon the features that debuted in Visual Studio version 15.8 Preview 1, which was released at Microsoft Build 2018 earlier this month. As always, you can drill into the details of all of these features by exploring the Visual Studio 2017 version 15.8 Preview release notes.
We hope that you will install and use this Preview, and most importantly, share your feedback with us. To acquire the Preview, you can either install it fresh from here, update your bits directly from the Preview IDE, or if you have an Azure subscription, you can simply provision a virtual machine with this latest Preview. We appreciate your early adoption, engagement, and feedback as it helps us ship the most high-quality tools to everyone in the Visual Studio community.
And now, without further ado, I’d like to introduce the new features to you.
Mobile Development for Android
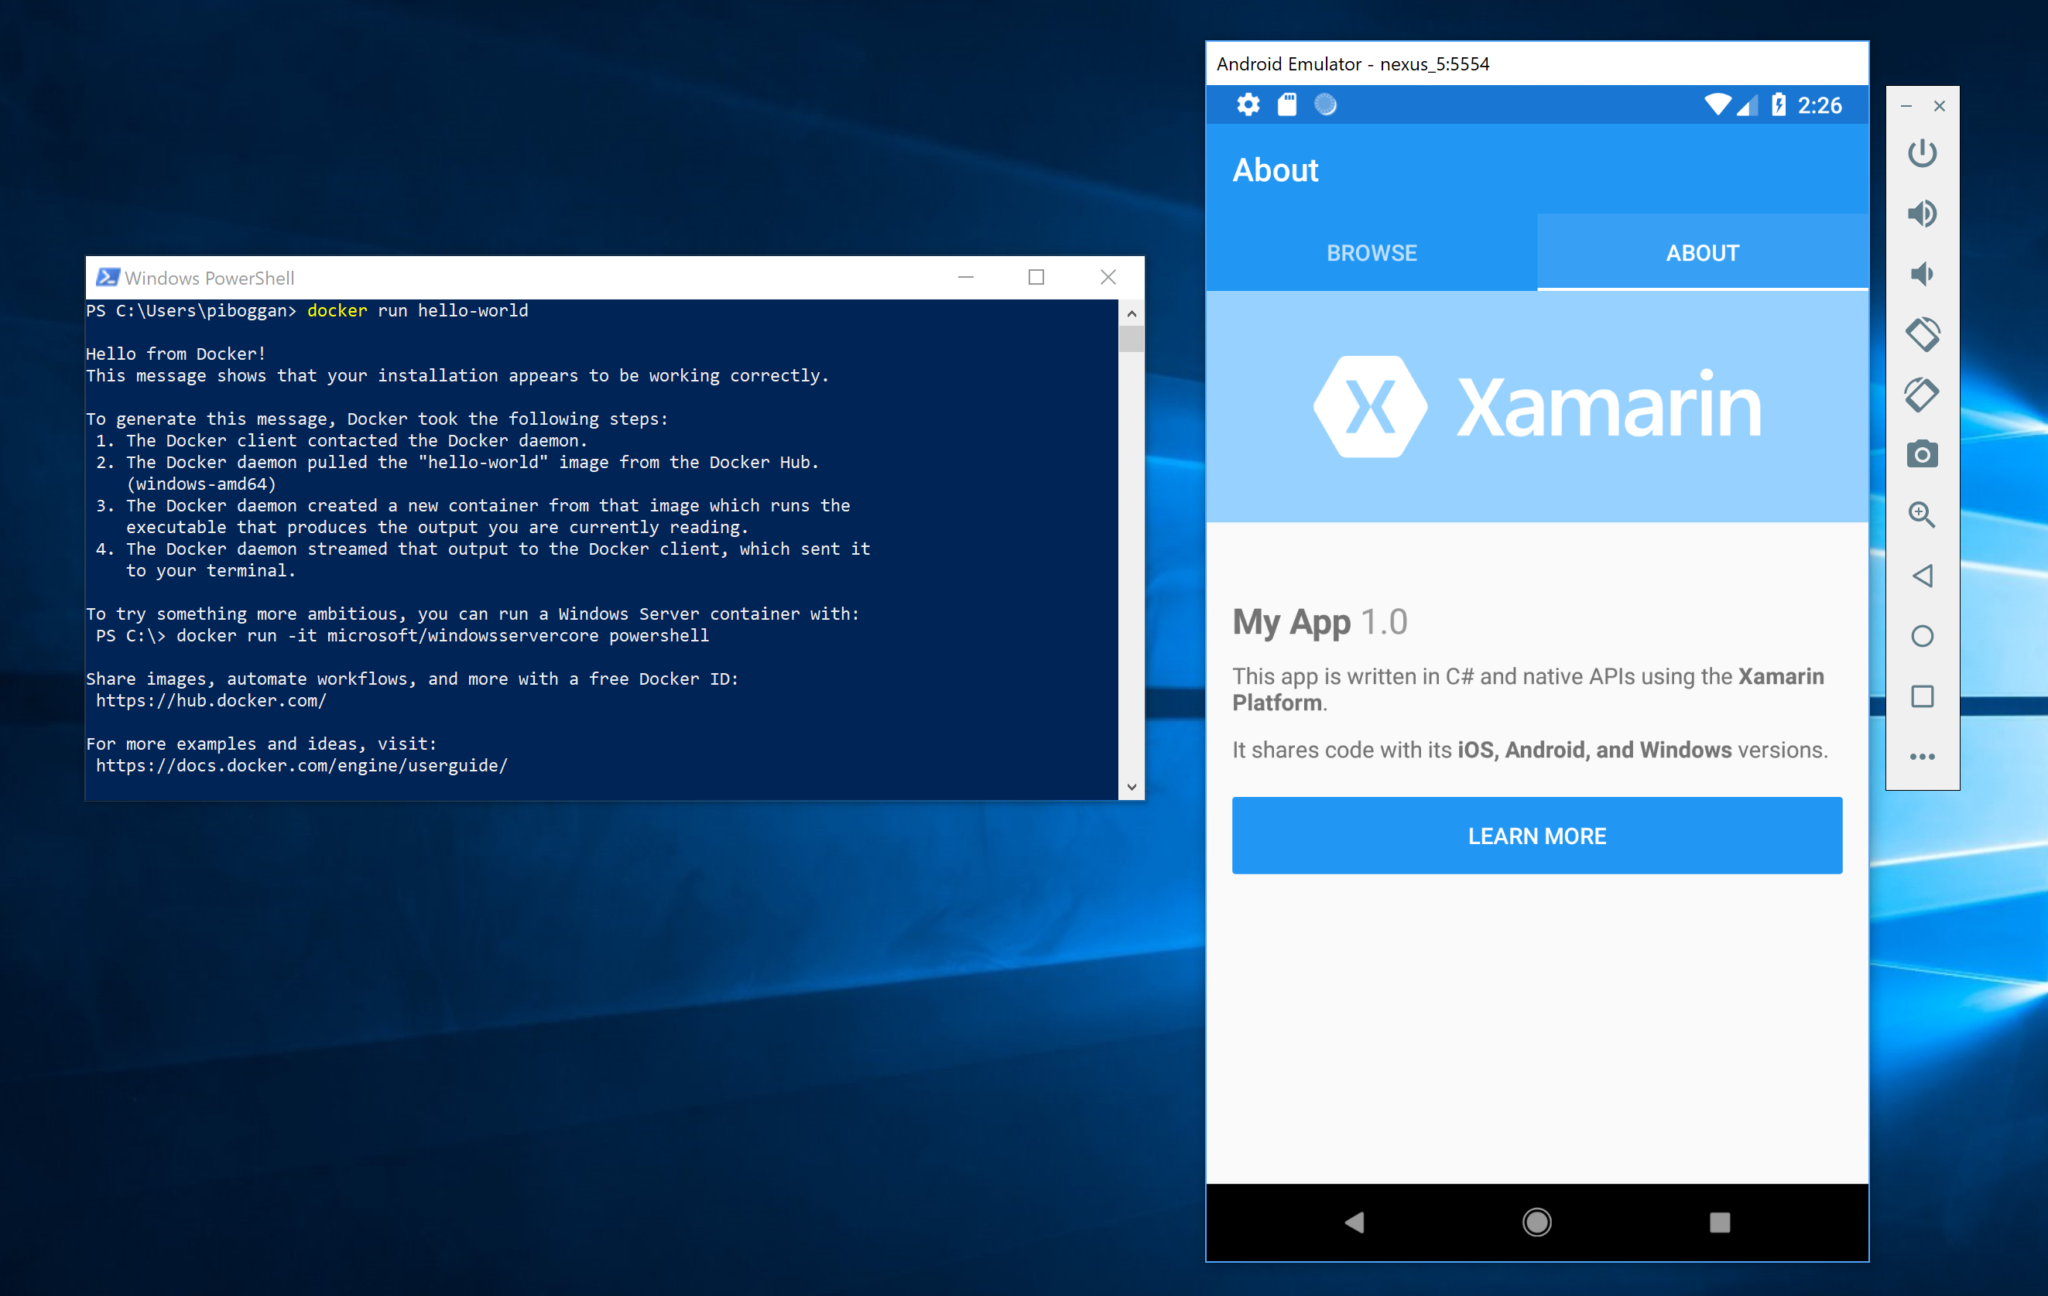
Android Emulator: This release contains a preview of the Google Android emulator that is compatible with Hyper-V, which is available in the Windows 10 April 2018 Update. This means you can use Google’s Android emulator side-by-side with other Hyper-V based technologies, including Hyper-V VMs, Docker tooling, the HoloLens emulator, and more. Developers who use Hyper-V now have access to a fast Android emulator that will always support the latest Android APIs, works with Google Play Services out of the box, and has all features of the Android emulator, including camera, geolocation, and Quick Boot.
This Visual Studio 2017 version 15.8 Preview release adds support for launching, deploying, and debugging Android apps from within Visual Studio with the new Hyper-V based emulator. For more information, visit the documentation on enabling Hyper-V based hardware acceleration in the Android emulator.
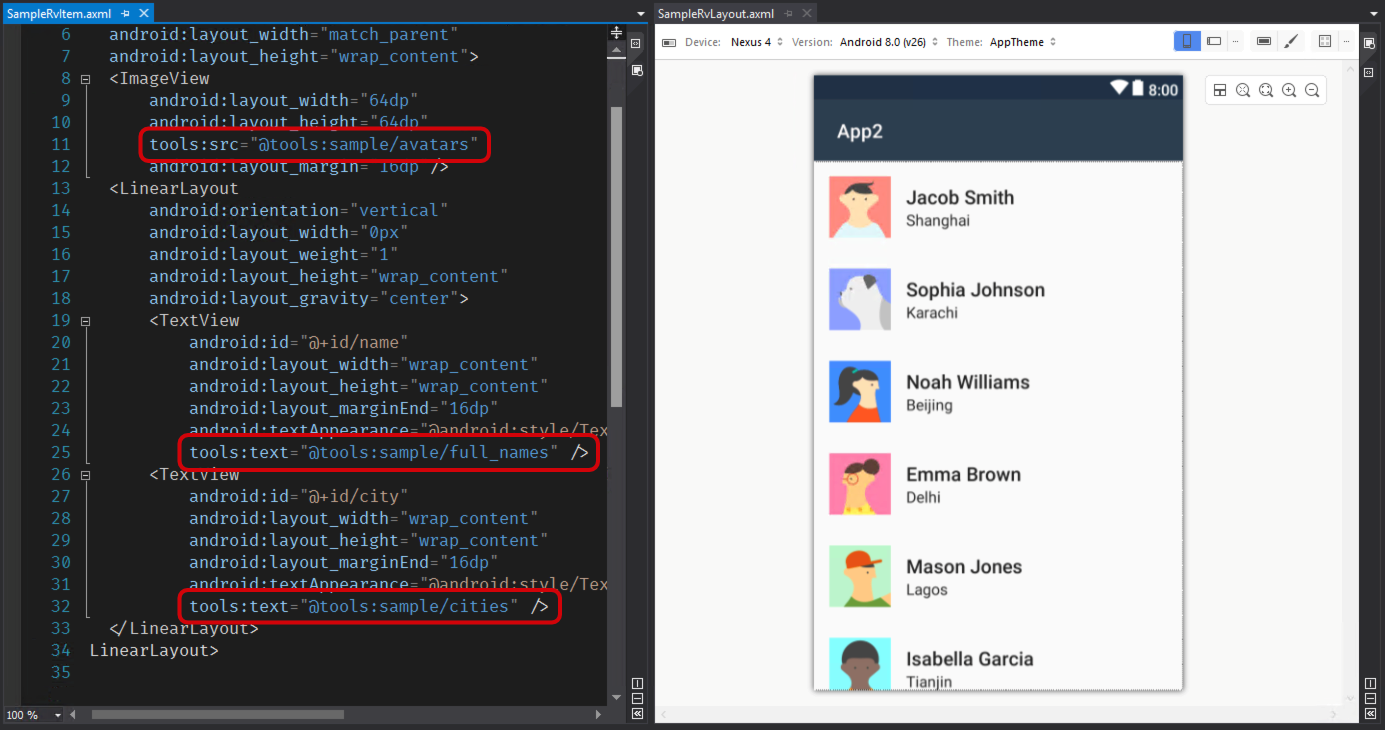
Android Designer: We’d like to call your attention to a couple of improvements to the Android development experience. First, we’ve enabled the split-view editor, which allows you to create, edit, and preview your layouts at the same time.
Second, you can now inject sample placeholder data or images into your views so that you can preview how the layout would behave. Refer to the Preview release notes for additional configuration details. Both of these improvements will make you more productive as you iterate on your UI design.
Xamarin.Android SDK: We’re excited to announce Xamarin.Android support for Android P Developer Preview 1. Android P introduces new features including display cutout support, notification enhancements, multi-camera support, AnimatedImageDrawable and much more. Be on the look-out in future Visual Studio Previews for Xamarin.Android support of Android P Developer Preview 2 and Developer Preview 3. For more information about the release cycle of Android P Preview, read about the Android P Preview Program Overview.
C++ Development
ClangFormat: In Visual Studio 2017 version 15.8 Preview 2, we added the Add > New Item template for generating a .clang-format file following the coding convention specified for ClangFormat in Tools > Options. If the Visual Studio convention is selected, the generated file will match the user’s current Visual Studio formatting configuration from Tools > Options. In addition, we updated the shipped clang-format.exe version to 6.0.0.
Open Folder: Adding configurations to CppProperties.json is now as simple as selecting a template. Use the configuration dropdown and select the option to create a CppProperties.json from a template, or right click in the editor of CppProperties.json to add templates to existing CppProperties.json files.
Performance – Loading Solutions
By default, loading solutions automatically re-opens documents that were opened in the previous session. Sometimes, opening all of these files can cause solution loads to take a long time to complete. In Visual Studio 2017 version 15.8 Preview 2, we’ve introduced a Project and Solution config setting checkbox to give you the ability to change the default behavior regarding opening documents generated during the prior session. More information can be found here.
Performance – Profiling with the CPU Usage tool
In Visual Studio version 15.8 Preview 2 we’ve released several new features of the CPU Usage tool in the Performance Profiler.
First, the CPU Usage tool now displays asynchronous code in the Call Tree view with logical call stack stitching on by default. The feature can be controlled via the “Stitch Async Code” option in the Filter dropdown of the CPU Usage tools main view (to turn it off & on). Displaying logical call stacks for asynchronous code is helpful because asynchronous code is written with context surrounding the code, even if the actual execution is performed independently of that logical context (on its own thread, for example). Below is a screen shot of deeply nested asynchronous functions displayed with their parent context (note the ‘[Async]’ tag prepending asynchronous functions).
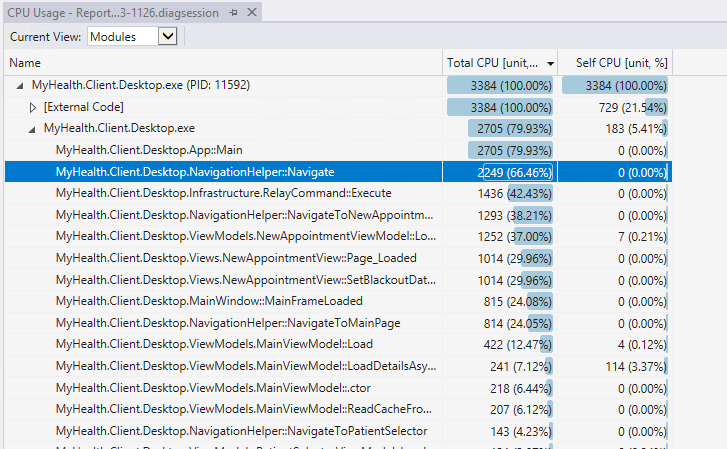
The CPU Usage tool now also includes a Modules/Functions view. This view will display execution cost (sample count) by module (dll) and by function within a module. This is useful when you need to determine how much a module contributed to CPU usage in total during a profiling session. You can expand a module to see a flat list of functions from the module breaking down the usage by individual function. This can be helpful to determine where to focus attention when investigating bugs or changes that impact performance. You can display the Modules view by selecting the “View in Modules” menu command from the context menu of a function in the list of the CPU Usage tool’s main view or by selecting “Modules” from the Current View dropdown when displaying the Call Tree or Caller/Callee views of the CPU Usage tool. Below is a screen shot of the Modules view with a module expanded.
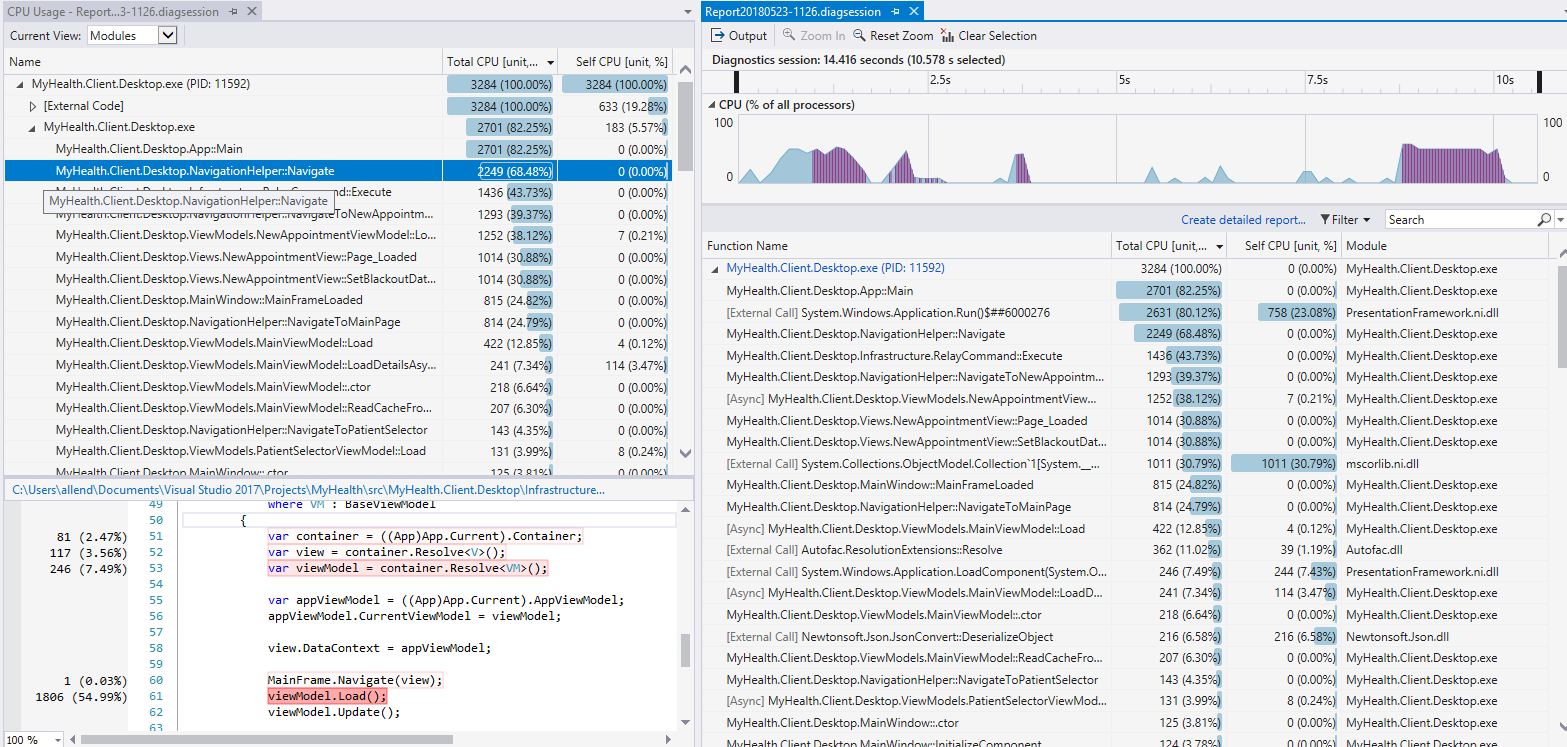
Finally, the CPU Usage tool now has instance indication in the CPU Usage graph displayed in the main view. Instance indication is useful to know when a function was executing during a profiling session. This makes is very easy to determine if a function was executing in a single block of time or multiple times during a profiling session. Instances are indicated via a dark (purple) line over the CPU utilization % graph in the ruler at the top of the CPU Usage tool’s main view. To view instances in the CPU Usage graph, simply double-click a function in any of the views offered by the CPU Usage tool. Below is a screen shot of the instances of a selected method when it was on the stack during the profiling session.
Note: The below screen shot displays the main view (on the right) and the Modules view (on the left) side-by-side; this configuration is most useful to avoid having to switch the views to see the instance indication when working with a child view (Modules, Call Tree, or Caller/Callee). This configuration is available by click-dragging one of the window titles out of the title bar at the top of the document area and dropping it on the desired drop target.
Extension Development
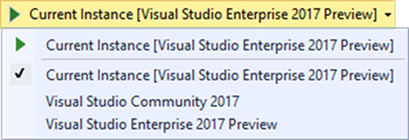
We’ve added some components and features to the Build Tools SKU, which means that you can now build Visual Studio extension (VSIX) projects using only the Build Tools for Visual Studio 2017. Additionally, if you have more than one instance of Visual Studio 2017 installed (like, for example, you’re using the 15.8 Preview 2 version as well as the 15.7 side-by-side Release version), then you can now select which instance to deploy your extension to when debugging. This means that you can develop your extension using the released version while debugging using the preview one.
Try out the Preview today!
If you’re not familiar with Visual Studio Previews, take a moment to read the Visual Studio 2017 Release Rhythm. Remember that Visual Studio 2017 Previews can be installed side-by-side with other versions of Visual Studio and other installs of Visual Studio 2017 without adversely affecting either your machine or your productivity. Previews provide an opportunity for you to receive fixes faster and try out upcoming functionality before they become mainstream. Similarly, the Previews enable the Visual Studio engineering team to validate usage, incorporate suggestions, and detect flaws earlier in the development process. We are highly responsive to feedback coming in through the Previews and look forward to hearing from you.
Please get the Visual Studio Preview today, exercise your favorite workloads, and tell us what you think. If you have an Azure subscription, you can provision a virtual machine of this preview. You can report issues to us via the Report a Problem tool in Visual Studio or you can share a suggestion on UserVoice. You’ll be able to track your issues in the Visual Studio Developer Community where you can ask questions and find answers. You can also engage with us and other Visual Studio developers through our Visual Studio conversation in the Gitter community (requires GitHub account). Thank you for using the Visual Studio Previews.



0 comments