Welcome back to the 3rd and final part of the Visual Studio 11 Beta Performance series. This week’s topic is Debugging. As I mentioned in the 1st post debugging is a key component in your continuous interaction with Visual Studio and we heard from you that the compile, edit and debug cycle had hiccups and was sluggish. I would like to introduce Tim Wagner, from the Visual Studio Ultimate Team, whose information below describes the work done to improve the Debugging experience for you.
Visual Studio provides an array of features across the entire application lifecycle, but it’s still the core “compile-edit-debug” loop that tends to dominate a developer’s workday. Our goal is to ensure that these central experiences work well so that a developer can stay in the zone, focused on coding and debugging in a tight cycle. In this post I’ll describe some investments we’ve made in the build and debug part of that cycle (collectively referred to as “F5”).
First, the punch line: We’ve made significant performance improvements in the Beta release! Take a look at this video comparing //BUILD and Beta C++ F5 experience side by side:
When we shipped the Visual Studio toolset at //BUILD, we focused initially on getting a functionally complete F5 experience in Visual Studio for Metro style apps, knowing that we still had work to do on this scenario to improve its performance. Between //BUILD and Beta we pulled together people from across many teams at Microsoft – Windows, C++, C#/VB, debugger, Project & Build, XAML, and others – to create a virtual team focused on making this scenario perform as quickly as possible. In this post I’ll take you inside the work we did, illustrate our progress between the //BUILD and Beta releases, and shed light on the kinds of changes and tradeoffs we made to improve your experience with the tools. Although we’ve made performance, memory, and responsiveness improvements in other areas (and other application types) with respect to building and debugging, this post is specifically focused on the F5 experience for Metro style apps on Windows 8.
Let’s start with some background on exactly what F5 entails. We usually think of the F5 key informally as a shorthand for “start debugging”, but depending on the state of your application, it can involve an entire range of activities:
- Build (compiling for managed and native code and linking for native code, plus pre- and post-build steps for all languages)
- Deploy (get the application into a state where the operating system can launch it; this can include remote transfer when doing remote deploys or simulator start up if simulation has been selected)
- Register (the first time a given application is launched it has to be registered with Windows 8)
- Activate (actually launching the process inside the application container)
- Change UI mode (switch Visual Studio from the editing window layout to the debugging window layout)
- Start and attach the debugger (including loading symbols for the executable)
- Execute the process (until a breakpoint, exception, or other stopping condition is encountered)
The breakdown of time among these activities depends on several factors; registration, for example, only needs to be done once unless the application’s manifest changes. The language (JavaScript, C#, VB, or C++) has an obvious impact as well, as does the “temperature” of the scenario – whether a build has been performed, whether code has changed, and so forth. We defined four different scenarios across the four languages to come up with the following matrix for performance analysis:
| Full | 1 Line | No Change | F4 (Refresh) | |
| C++ | X | X | X | |
| VB | X | X | X | |
| C# | X | X | X | |
| JavaScript | X | X | X | X |
Note that the F4 scenario only applies to the JavaScript case; more on this below.
We defined the three temperatures as follows:
Cold – The first F5 of an app, including its registration. This will include a full build and deploy.
Warm – A one-line change after the cold F5 has completed. Warm is faster than cold because builds are incremental rather than full, the app is registered, various caches are primed, and so forth. Warm is the “sweet spot” where we expect most F5’s to occur as people iterate in tight compile/edit/debug iterations, and so it’s the most important of the three scenarios.
Hot – Hitting F5 again with no intervening change. Hot is typically faster than warm because a fast up-to-date check is performed that bypasses build entirely for native and managed code (and in a future release, JavaScript).
To test the languages, we used the Grid template that ships with Visual Studio to find the first level of performance issues. Using a small example like this has two primary advantages in the initial testing phases: It’s small enough to capture and view the sampling traces easily, and fixed overhead tends to dominate (the rendering of the UI mode shift in Visual Studio is a good example; animated transitions, which were present in //BUILD and then removed for Beta, is another). On the downside, small examples like this fail to uncover breadth, end-to-end, and scalability issues. To catch those, we also look at larger test cases with both synthetic and real world apps, including the Zune and Bing apps you can download from the Beta app store. Real apps are the best proxies for actual developer experience, and synthetic load testing helps us find non-linear problems of scale – for example, we found an issue where we were accidentally turning warm cases cold by deploying more than what actually changed, behavior that stands out with larger apps and especially by plotting deployment times against app sizes.
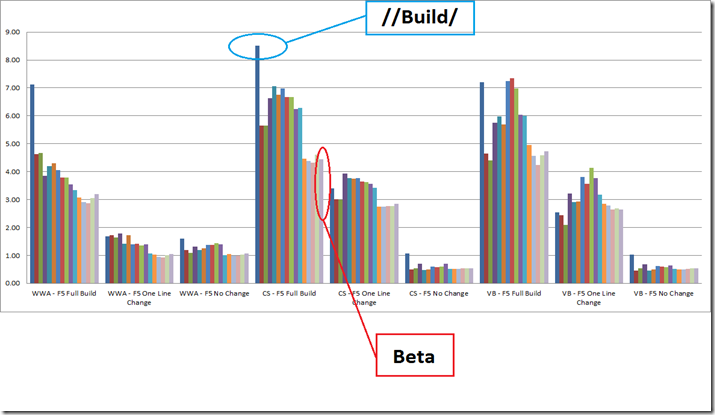
As you’ve heard in previous posts, we use several methods to do the actual performance measurements, including an automated bank of performance analysis machines that we call “RPS” (Regression Prevention System) which can track detailed performance results over time for scenarios like the table shown above. We also use this lab for manual performance testing to “compare apples with apples” when we look at changes or want to compare detailed perf traces for different approaches. Here’s a graph of trends over time between //BUILD and Beta for the matrix above, minus the “F4” case, using our lab machines:
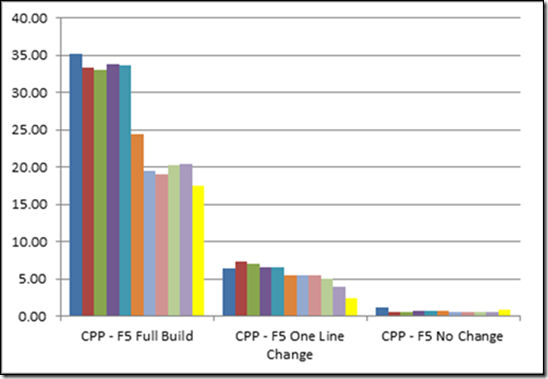
C++ has the longest F5 times of the four languages, due in part to its nature (include files, link step), so I’ve broken it out to keep the graph above more readable. The yellow bars represent performance targets for the native case.
One thing you can notice from both graphs is that the trend over time is towards improved performance, with occasional regressions. Some of the regressions are intentional – for instance, we fixed several functionality (correctness) bugs where more time was consumed in order to get all the cases correct. Temporary regressions are usually the result of integration issues, when two more pieces of code reach a common branch but have unintended interactions with one another.
Deep Dive into C++
In this section I’d like to provide more insight into the C++ case, how we approached improving its //BUILD-era performance to arrive at Beta, and what we’re continuing to do to improve.
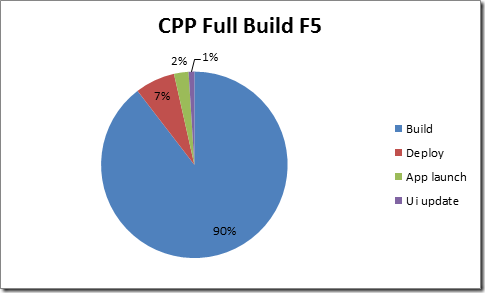
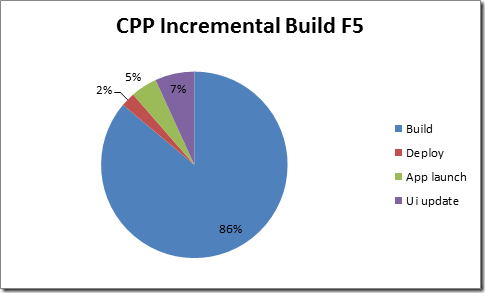
When we released //BUILD, we knew that we had some low-hanging fruit in terms of performance improvements. We used Windows ETW sampling (which will be the basis for all profiler sampling in Visual Studio 11) to collect traces and formulate a coarse grained breakdown of the time. Here’s an example of the cold and warm breakdowns for C++ as they ended in Beta:
Using diagrams like this, you can quickly apply some Amdahl’s Law analysis – cold C++ F5 is dominated by the full build time. In the //BUILD version of this graph that was even more true. As a result, improving other elements won’t have much of an effect until/unless building gets faster, so this is where we’ve focused our improvements.
Between //BUILD and Beta we improved the C++ build by pre-compiling headers for C++ templates and – most significantly – by switching to “lazy” wrapper generation. At //BUILD, wrapper functions were generated for all methods of a WinMD type in every file in which that type was referenced, leading to redundant code generation, larger object files, and longer link times. For Beta, we changed the generation policy to only do work if a method is actually referenced, greatly reducing the number of generated wrappers and resulting in faster builds and smaller PDBs. We’re continuing to look at compiler improvements here that could make this even faster, such as generating wrappers only for the first reference.
XAML Compiler Changes
Compiling the XAML UI language and its interaction with the host language’s type system (either managed or native) is a significant part of the overall build pipeline. For both managed and native, one of the changes that improved performance was reducing the amount of up-front type information loaded by the XAML compiler. In fact, of all the system assemblies, our traces showed that only four contained types that are typically referenced by Metro style apps. Loading the remaining assemblies only when required (a type lookup fails) reduced startup time for the compiler without changing the semantics of type referencing. In addition, XAML files refer repeatedly to the same types; we took advantage of this fact by adding some additional caching to make subsequent references faster and to reuse type information between compiler passes.
Managed Metro style projects benefited from an additional change to the XAML compiler: change detection. The output of the first pass of the compiler (*.g.i.cs or *.g.i.vb files) is used by VS for IntelliSense and does not need to be generated unless the XAML files are modified. To exploit this, a quick “up to date” check was implemented that skips this step entirely whenever possible. This change also speeds up other scenarios, such as repeatedly tabbing to/from an unchanged XAML file.
Even with these improvements, XAML compilation in the Beta release still dominates small and UI-intensive Metro style native and managed app builds. To make further improvements (especially for native, where the compilation times are slower), we’re currently investigating ways to checksum user types, so that we can skip the XAML codegen step entirely when the surface area of the user’s code is unchanged (i.e., the user’s changes affect the bodies of methods, not the shape of types). We’re also continuously looking at the quality of the T4-generated code for XAML, and welcome feedback on its layout and implementation.
F4
One of the performance issues we needed to tackle for Metro style app development was making targeted changes to JavaScript apps and seeing those changes reflected immediately: Web developers rely on the browser’s refresh functionality when making changes to their apps, and we wanted a similar experience while working on JavaScript-based Metro style apps for Windows 8. In particular, we received feedback from //BUILD (and from our internal users) that the stop debugging / edit / build / launch / attach cycle was too heavyweight, especially by comparison to the typical Web experience. We wanted to focus on making sure that cycle was as fast as possible, but we also wanted a model that mapped more closely to the browser – thus the Refresh Windows app feature (“F4”) was born. The following video shows F4 in action:
The Refresh feature is available on the Debug menu in Beta builds and is bound to the keyboard shortcut Ctrl+Shift+R. (We expect to change this to F4 in future releases depending on settings selection, hence its nickname.) F4 speeds up the edit/debug cycle by removing the need to shut down the application whenever changes are made to HTML, CSS or JavaScript. The easiest way to think about the feature is as a ‘fast restart’ where the app will be reloaded and then reactivated, without Visual Studio exiting the debugger; this prevents the window layout changes that generally happen when the debugger restarted, along with removing the need to re-launch the host process and reattach the debugger. In most cases F4 will only take a few hundred milliseconds to complete vs. around a second for a full restart of the debugger (in other words, this is about half the time of our current warm F5).
You may be wondering why you would ever not use F4. The answer is that you should use it whenever possible since it’s generally faster, but there are certain situations in which F4 is not available. You can change HTML, CSS, or JavaScript content, but adding new files, changing the manifest, modifying resources, or adding new references (along with some other, less common, cases) are not supported. When these situations occur, attempting F4 will bring up a dialog indicating that the pending changes prevent F4 and a conventional F5 is needed.
We’re very excited about introducing F4 with the Beta release and look forward to hearing your feedback! Note that there are a few cases in Beta, which will be fixed before we release, where F4 may not activate the app – the workaround is to use F5, which is always available.
Deployment Types – Remote and Simulator
The default deployment in Visual Studio is to launch the application on the same machine that Visual Studio itself is running on. (We refer to this as “local” deployment.) There are two additional debugger targets: remote, which is useful if you want to deploy to specialized hardware for testing (such as ARM devices, where you cannot run Visual Studio), and simulator, which can be used to test rotation/resolution options, location, and other settings that are difficult or impossible to vary on the host machine when deploying locally.
Remote and simulator deployments share the bulk of the F5 steps with local deployment, so whenever we make build (or register or activate) faster, we improve remote and simulator deployments as well. These deployments also have unique performance issues: remote can be dominated by file copying “over the wire, while simulator involves a large amount of startup activity, including logging in the current user for a domain joined host machine. This can lead to a long overall F5 the first time the simulator is used, even if the rest of Visual Studio is “warm” with respect to the F5. While we were unable to eliminate all of the simulator overhead outright (its implementation is based on remote login), we were able to parallelize simulator start with the build step; on most hardware, this has the effect of hiding much of its startup time. Ironically, languages with longer build times (e.g., C++) therefore seem to have faster simulator startup than languages with faster build times (e.g., JavaScript), because a greater percentage of the simulator’s cold start time can be done while the build is happening. The following table illustrates the differences between local and simulator-based deployment for the test matrix; you can see that warm and hot scenarios (where the simulator is already running) have sub-second overhead for the simulator deployment, while cold scenarios (where the simulator is being started) vary by language depending on the length of the full build step.
| Scenario | Local | Simulator | Difference |
| cpp Full | 23.9 | 25.8 | 1.8 |
| cpp 1 line | 4.6 | 5.3 | 0.7 |
| cpp no change | 0.5 | 0.8 | 0.3 |
| cs Full | 4.4 | 6.0 | 1.6 |
| cs 1 line | 2.7 | 3.2 | 0.5 |
| cs no change | 0.5 | 0.8 | 0.3 |
| js Full | 2.9 | 6.4 | 3.5 |
| js 1 line | 0.9 | 1.4 | 0.5 |
| js no change | 1.0 | 1.4 | 0.4 |
| vb Full | 4.6 | 6.3 | 1.8 |
| vb 1 line | 2.8 | 3.3 | 0.5 |
| vb no change | 0.5 | 1.0 | 0.5 |
Telemetry
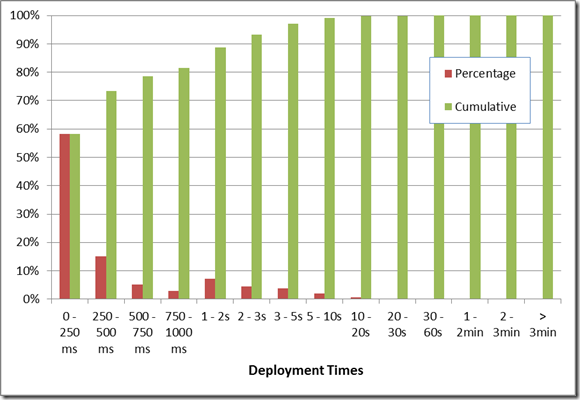
Internal performance testing, even with real apps, is ultimately a proxy for the experience of real developers. Telemetry helps us understand what happens after we ship. While the Windows 8 Consumer Preview / Visual Studio 11 Beta is still in its early days, we already have some data flowing back. For F5, one of the best indicators is the data that tracks overall deployment times; this doesn’t capture all of the F5 user experience, but it includes many of the expensive portions (build, deploy) and it helps us discover if we’ve missed any cases. The chart below shows the data we’ve received to date, showing the distribution and cumulative population for bucketed deployment time. Around 89% of deployments take 2 seconds or less. The data also confirms that the warm and hot paths are working as intended, since the majority of deployments are sub-second (and hence not cold). Of course this is still early data, from a population likely dominated by smaller apps and examples, so we will continue tracking this along with your feedback.
We hope these and other improvements we’ve made in Beta are providing you additional productivity gains and making the experience of developing Windows 8 Metro style applications a great one. Please help us continue to improve through your feedback and suggestions!
 Tim Wagner – Director of Development, Visual Studio Ultimate Team
Short Bio: Tim Wagner has been on the Visual Studio team since 2007, working on a variety of areas, including project, build, shell, editor, debugger, profiler, and – most recently – ALM and productivity areas like code review, diagramming, and IntelliTrace. Tim has been involved in performance improvement crews for the past two releases and continues to look for ways to make Visual Studio a better user experience. Prior to joining Microsoft he ran the Web Tools Project in Eclipse while at BEA Systems, and has been involved in several startups and research organizations over the years.
The Last Word
As mentioned above this brings to a conclusion the Performance Series on the Beta of the Visual Studio 11. I greatly appreciate you taking the time to read and comment on these posts. Even though this is the last of the series let me reiterate that we are always open for feedback as hearing from you is critical in knowing where you feel we still need improvement. As always I appreciate your continued support of Visual Studio.
Thanks, Larry Sullivan Director of Engineering

0 comments