We know that many developers choose Visual Studio because of its powerful, yet natural, productivity features that help you stay “in the zone”. Visual Studio 2017 RC brings many improvements in this regard, helping you stay even more focused on your program rather than on the tools you use to build it. Download it now to see how you can save time and effort on the tasks that you do day-in, day-out.
We’ve focused our improvements in three main areas where we know most developers spend their time: code editing, navigation and debugging. In this post I’ll go into details highlighting features in each area.
Code Editing
IntelliSense filtering
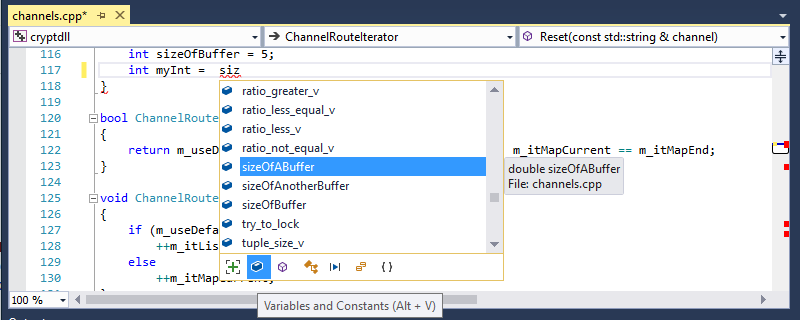
IntelliSense makes exploring a new API faster by allowing you to narrow down the set of values by category. This means if it’s a variable you need, you don’t need to wade through lots of types to get to it. As an example, the screenshot below shows using the filter to just show variables and constants in the IntelliSense results for a C++ code file:
All the filters have convenient keyboard shortcuts as you’d expect. For example as you’re typing C# code you can quickly press Alt+P to filter down to Properties, or Alt+M to filter out extension methods. Just hover the filter bar to discover all the shortcuts that are relevant to your current situation.
Match highlighting
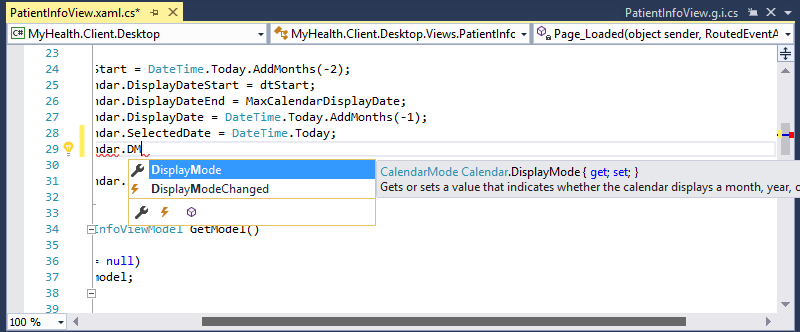
When you use techniques like camel case matching to home in on a result faster, it can sometimes be hard to tell why an item is matching. That’s why IntelliSense in C#,VB, JavaScript and TypeScript now lets you see why an item is matching your search by bolding the matching letters as shown below. Match highlighting is an extensibility point, so any language can add support for this; you can expect to see more languages supporting this over time.
If you don’t like the filtering or match highlighting features, you can easily turn them off in the IntelliSense settings for your language. Look in Tools-Options-Text Editor, under the language you are using. For instance Tools-Options-Text Editor- C# – IntelliSense will let you control these features for C#.
Better IntelliSense behaviors
Many Visual Studio languages have made big strides this release in getting you better results when using IntelliSense. For instance:
- C# and VB have “smart preselection”. This determines the target type you are likely to need, and preselects the items in the IntelliSense list that match that type, speeding your typing flow and removing the burden of figuring out what type you need. It’s applied without hitting any special keystroke on your part. Check out this video for an overview of all the new C# and VB productivity features.
- XAML now has IntelliSense for namespace completion, lightbulb quick fix for missing namespace, sorting and removing unnecessary namespaces, and rename refactoring support for namespace prefixes. In addition, XAML IntelliSense has been improved to help you bind quickly and correctly when binding events, paths and functions with x:Bind; better filtering so that you see only relevant information; and camel case matching support (for example, “RTB” will complete as “RichTextBox”). Watch these features in action in this video.
- C++ has an experimental Predictive IntelliSense feature that shows a filtered list of IntelliSense results. This means you don’t have to scroll through a long list of irrelevant matches. Only items of the expected type are listed based on need-based probability. You can turn on this feature in Tools > Options > Text Editor > C/C++ > Experimental. See this article on the C++ blog for more details on how this works.
- The JavaScript language service has been completely revamped to improve its IntelliSense. Previously, as you typed, a JavaScript engine continuously executed your code to provide runtime-like completion lists and signature help. This was great for dynamic JavaScript code, however it often provided an inconsistent editing experience. The new language service uses static analysis powered by TypeScript to provide more detailed IntelliSense, full ES6/ES7 coverage, and a more consistent editing experience. See more details in this post by Bowden Kelly on more productive JavaScript in VS 2017 RC.
Coding Convention Support via .editorconfig
You’ve told us that keeping consistent coding standards in your codebases is a boon to team productivity. It makes it easier to read code written by all team members, but it’s hard work to enforce these standards. To help you achieve consistent formatting on your projects, we’ve introduced built-in support for the public editorconfig convention file format. This lets you define formatting rules that travel with your codebase wherever it goes. This means the code that gets checked in follows the codebase’s conventions and preferences rather than the individual developer’s. You can even supply different conventions for different parts of your codebase, such as when you have some legacy code that follows a different formatting style that you might not wish to change. The format is a standard recognized by a wide range of other editors and IDEs. To get started, just add an editor config file (.editorconfig) to your project. See more details in the documentation here.
Code Analysis for C# and Visual Basic
In C# and Visual Basic, we have gone a step further in coding convention support. We’ve expanded the reach of live code analysis to include code style enforcement—empowering developers to enforce consistent code style and naming conventions across their repo or team. We also are continuously working to help you clean up and move your code forward with new refactorings and code fixes. The coolest ones added in the RC are: Move Type to Matching File, Sync File and Type Name, and Convert to Interpolated String. Check out Kasey Uhlenhuth’s article on C# and Visual Basic Productivity Improvements to learn more.
Live Editing experiences
Improving code quality as early as possible in the development process matters – finding issues sooner is better. Visual Studio 2017 RC makes useful data available at the time of editing, instead of much later in the process, so you can code with even more confidence. Live Unit Testing (a new feature available for C# and VB users on the .NET Framework) gives you the ability to instantly tell whether your unit tests are still passing as you write your code! Check out Joe Morris’s article on Live Unit Testing to get lots more details.
Navigation
Many of you tell us that you spend much of your time working with large existing bodies of code. Having the ability to quickly and easily navigate your code is immensely powerful and can dramatically improve productivity . Whether you’re drilling into a bug, finding the implications of a refactoring, or just figuring out an unfamiliar codebase, tools that get you around quickly and confidently, and help you know where you are will make a big difference. That’s why we’ve added several new navigation features to help:
Go To
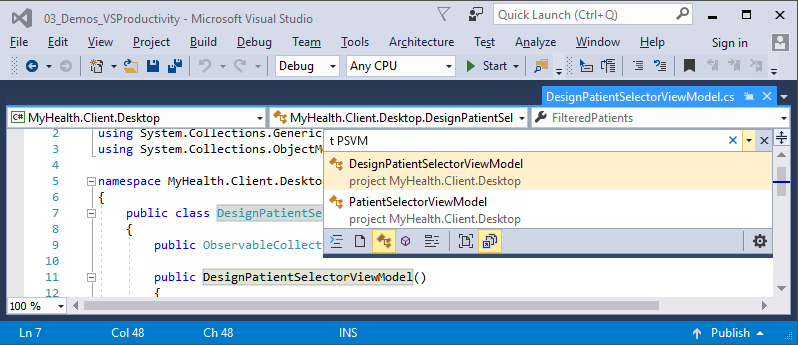
Go To (Ctrl + , or Ctrl + T) is a fast, complete search that lets you quickly find files, types, methods, and other kinds of symbols in your code. It gives you a one-stop way to go to any kind of item you need, which is a particular benefit when working in larger code bases.
The new GoTo feature also lets you filter down easily, and choose to look just for one kind of item. You can do this via keyboard shortcut (check out the Edit-GoTo menu to find those shortcuts), mouse clicking on the filter icons in the Go To panel, or by using the speedy query syntax as shown in the example here. Notice the “t” before the search term which tells the search to filter down to just types. So it’s easy to change filter mid-flow as you figure out what you’re looking for.
As you move through your search list, you’ll see a preview of the selected location in a temporary pane. You can riffle through the results quickly to get to just the one you need without leaving a lot of clutter in your wake, as shown below.
GoTo is customizable too – hit the gear icon in the toolbar to change the preview behavior for instance.
Find All References
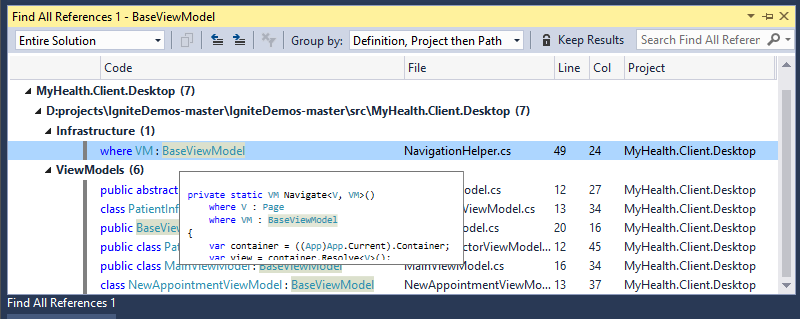
Find all references (Shift+F12) now helps you get around fast even in really complex codebases. It does so by providing advanced grouping, filtering, sorting, and searching within your results. For some languages, such as C#, the results are colorized just like they are in the editor. C++ lets you see which references are read and which are write. All this gets you a clear understanding of your references and gets you to that line of code you need with confidence.
For an example of how this can speed you to the right code, take a look below. Here I’m looking to understand the consumers of my BaseViewModel class. I can see structural detail on where those dependencies lie because I’ve selected a grouping that includes the path. This means I can quickly see that I have six viewmodels and one helper class that refer to it, and I can hover to see exactly what code is making that helper reference.
The “Group By” dropdown provides useful preset groupings, and you can even create your own by right clicking within the FAR results and using the Grouping context menu. You can also see multiple reference search result sets. This is great for those times when you’re in the middle of using a reference list to check code before refactoring, but find you need to drill on a different reference as you go. Just hit “Keep Results” to freeze the results you have and you’ll get a brand new references window to work with when you next find references.
Structure Visualizer
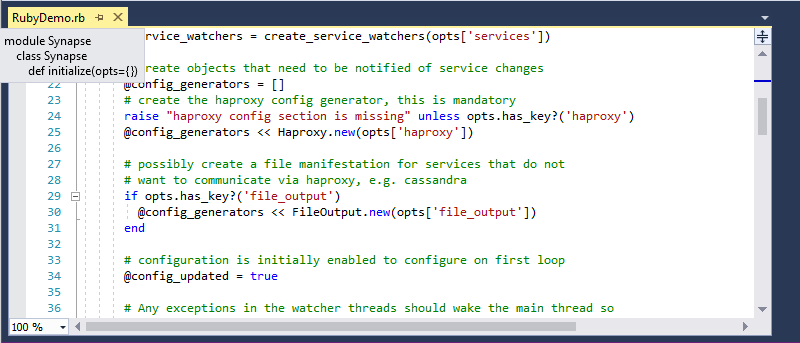
It’s important to have a clear sense of where you are structurally in your code when reading. To that end, we’ve added a favorite feature from the Productivity Power Tools extension into Visual Studio: Structure Visualizer. This draws structure guide lines (aka indent guides) on your code so you can easily visualize and discover what block of code you’re in at any time without needing to scroll. Hovering the lines shows tooltips that let you see the opening of that block and its parents. This is particularly useful when those blocks are scrolled off-screen. The guides are also handy for checking whether your code is at the right indent level!
In Visual Studio 2017 RC, Structure Visualizer works for XAML, C# and VB files, and for all the languages supported via TextMate grammars, as shown in the screenshot below of a Ruby file. You can expect to see more languages add support later. For some languages (like C#, VB), the tooltips are colorized just like the code they reflect too.
If you prefer not to see the lines, you can easily turn them off in Tools-Options-Text Editor-General-“Show structure guide lines”. You can also alter their color via the Text Editor “Block Structure Adornments” display item in Fonts and Colors.
Debugging
Run to Click
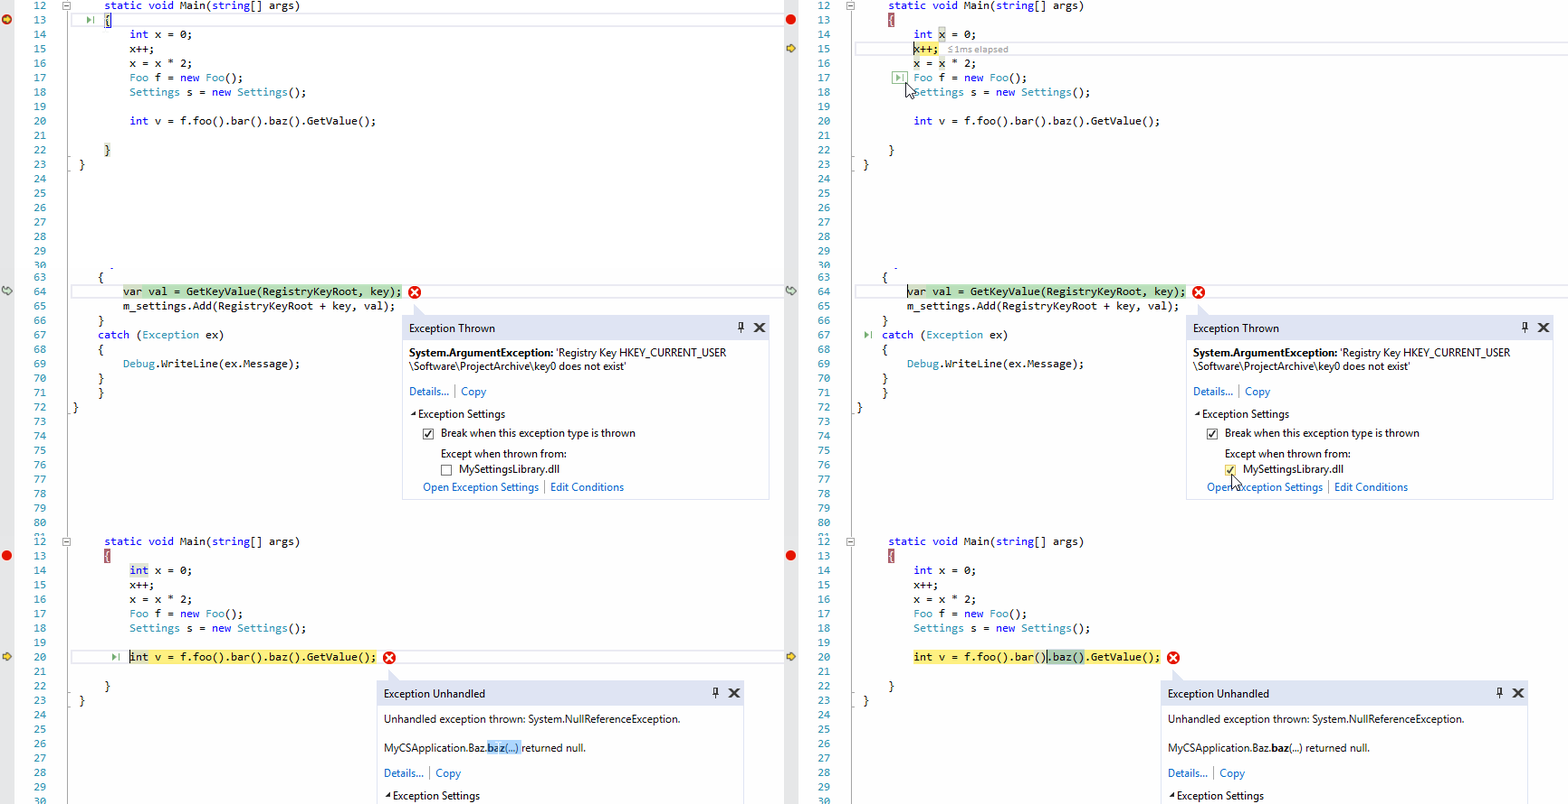
You can now more easily skip ahead without setting a breakpoint to stop on the line you desire. When stopped in the debugger, simply click the icon that appears next to the line of code your mouse is over. Your code will run and stop on that line the next time it is hit in your code path.
New Exception Helper
Use the new Exception Helper to view your exception information at a glance in a compact non-modal dialog with instant access to important information:
- See what is null: Quickly see what is null right inside the Exception Helper when diagnosing your NullReferenceException in C# and access violation in C++. When you break on a line of code caused by a null value, read the message and look at the bolded variable in the Exception Helper to clue you in to what was actually null.
- See Inner Exceptions: If the exception you break on has any inner exceptions, you can immediately see their details in the Exception Helper and use the arrows to navigate through the tree of inner exceptions.
- Ignore exceptions from certain modules: In the Exception Settings section of the Exception Helper, you can now check a box to ignore that exception type when thrown from that current module. That way, the next time you debug that code path, you won’t break on that exception. You can reset these conditions from the Debug > Exception Settings window.
Attach to Process Filter and Reattach
Easily search in the “Attach to Process” dialog to quickly find the process you want to attach the debugger to. After you have attached to a process and stopped debugging or detached from it, you can use the new “Reattach to Process… (Shift + Alt +P)” command in the Debug menu to attach again. Use this feature to save you time and the hassle of always needing to open the “Attach to Process…” dialog when you are debugging a similar process repeatedly.
Keyboard Shortcuts
Power users of Visual Studio tell us that they feel more productive when they use keyboard shortcuts; you can get a useful concise guide to the shortcuts you’ll want to know for many of the features above here.
Send Us Feedback
I hope this has given you a flavor of how Visual Studio 2017 will help you get even more productive in your everyday development work. If you want to learn more about the full set of new features in the product, check out the overview on visualstudio.com, and of course the release notes.
Please try the Visual Studio 2017 Release Candidate today, and send us your feedback; we’d love to hear how the new features are working for you. If you see issues, please be sure to report them using the Report-a-problem tool in the upper right corner either in the IDE or the installer. Track your feedback on the developer community portal. And if you have suggestions, let us know through UserVoice. Thanks!

0 comments