In Visual Studio 2012 Update 1, we introduced a JavaScript memory analysis tool for Windows Store apps to help developers, you, build apps that do not leak memory, so that these apps are more reliable, potentially more responsive and therefore have the potential to be more highly rated by customers. You will find the memory analysis tool applicable to Visual Studio for Windows 8 – Express, Visual Studio 2012 Professional, Premium and Ultimate on Windows 8.
Our goal was to provide a way for you to identify unintentionally retained memory within stateful JavaScript applications, so that you can more:
- Easily understand the memory usage at any given time, and over time
- Quickly identify the value of an object, as well as what is keeping it alive
Analysis of projects or previously installed Windows Store applications
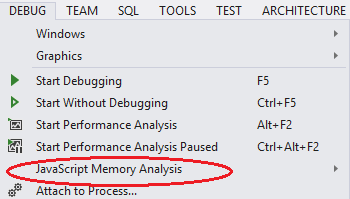
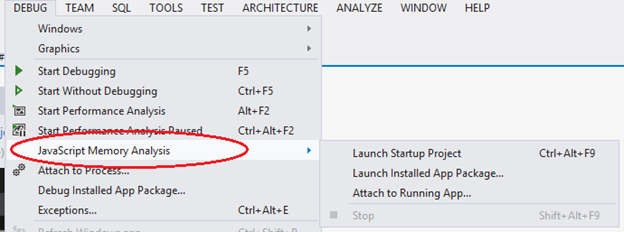
There are 3 options when launching the tool:
- “Launch startup project”: which will start analyzing the startup project in the current Visual Studio instance.
- “Launch installed App Package…”: which will prompt for the installed app to analyze, the Windows Store app will be launched and Visual Studio will start the diagnostic session.
- “Attach to running app…”: which will prompt to attach to the already running apps and Visual Studio will start the diagnostic session.
Note: For all three options a Windows developer license is required.
It’s also possible to deploy a Windows Store application locally, to the simulator or to a remote machine/device, in the same way as it’s available for debugging. At this point in time, remote target for JavaScript memory analysis is only supported when launching the tool through the startup project.
Working with an Intuitive and Simple UI
JavaScript memory analysis is complex for several reasons; firstly, everything is an object which leads to large numbers of objects on the heap at any given time. Secondly, the host dynamically injects numerous objects of its own, such as the DOM and the JavaScript built-ins which can make it hard to narrow down issues to only objects contributed solely by the app. Finally, objects in JavaScript don’t necessarily have canonical names that allow them to be easily identified.
Given this complexity, we set our goal to simplify the process as much as possible by providing visual indications of the most important data in order to identify memory consumption issues.
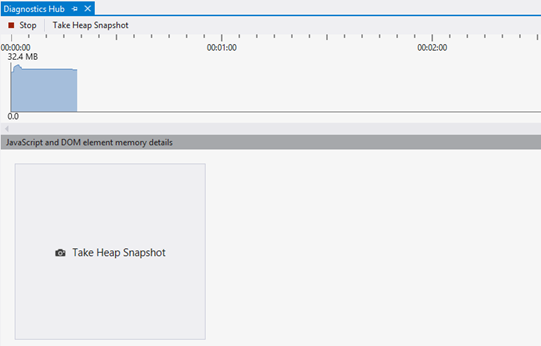
When you start the JavaScript memory tool, as shown above, you will see a process memory graph that allows you to observe the overall private working set (the amount of memory consumed by the app) over time. The graph gives you an indication of the memory trend for the app which enables you to judge when it is appropriate to take a heap snapshot for later comparison. There may be cases where unexpected retention of large DOM elements or WinRT objects occurs in your app, and the private working set will capture this (both DOM elements and WinRT objects can allocate native memory outside of the JavaScript heap).
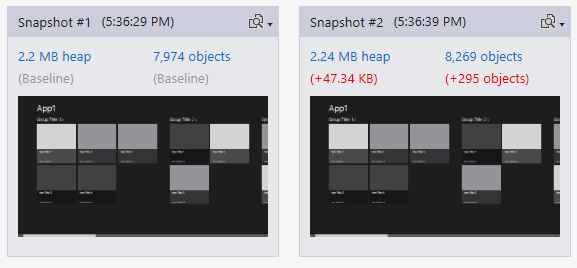
The first action that’s usually taken for inspecting JavaScript memory is to “Take a Snapshot”, which can be done through the menu item and also the large button in the memory tool, as shown above. This generates a summary tile that indicates the size of the JavaScript heap at the time the snapshot was taken, along with the number of objects allocated and a screenshot of the application.
While running through your app’s scenario that needs analysis and transitioning to different points in the app, you can continue to take snapshots at any time. The snapshots generate additional tiles, each of which indicates the difference in JavaScript memory from the previous snapshot.
The goal of the tiles is to provide a summary of the most immediately actionable information in an easy-to-read way. We chose the information that we display on the tiles very carefully as we wanted to maintain a balance between keeping it simple to consume yet powerful to analyze. We’d love to get your feedback on the usefulness of this summary view.
Clicking on any of the values in the summary tile opens the details of the snapshot data and the comparison. There is also a drop-down menu at the top right of the tile that allows comparison with any other snapshot, though we have consistently seen that comparing against the previous snapshot is the most common case.
Cleaner details view
There’s a lot of data in the JavaScript heap so this data is pre-filtered (we found that when presented without any sorting or filtering, it quickly becomes overwhelming). We decided to reduce the amount of data by filtering JavaScript built-ins and ‘object ids’ (unique identifier for the objects), by default. The object ID is useful if there are multiple anonymous objects which need to be differentiated. The view is focused on showing only the objects that the application contributes along with any memory allocated by JavaScript frameworks you may be consuming.
Showing built-ins and objects IDs in the details table can be turned on by using the drop down at the top right corner of the details view.
Fast detection of objects allocations
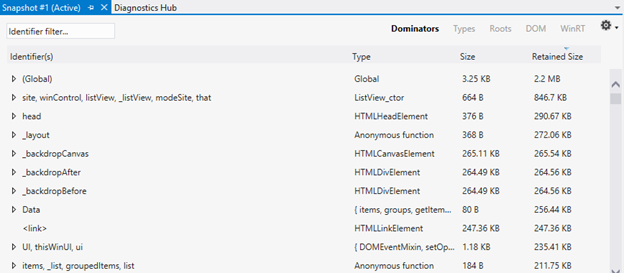
The details can show either the dominators or types view by default depending on which hyperlink is chosen on the summary tile.
- The dominators view shows a sorted list of the objects by retained size, which means the objects consuming the most memory that are potentially easiest to free would be listed at the top.
- The retained size of an object is the amount of memory that the object is preventing the garbage collector from reclaiming, which includes the size of the object and also all the objects it references (and any objects they reference) that are not referenced by any other object such that this object is their only ancestor. To be clear, retained size can be thought of as the amount of memory that will be reclaimed if all of the references to the current object are removed.
Drilling down into an object in the Dominators view allows inspection of the objects it references. At the bottom of the tool window there’s a Reference graph, which displays which objects are referencing the selected object in the top table.
Right-clicking on an object allows “Show in roots view”. The Roots view is a different pivot on the memory presented in a hierarchical tree which shows the relationships of what is keeping an object alive (in a sense, what is the ultimate GC root of an object). In this view the top level objects are things like ‘(global object)’, which equates to doing something like ‘var someObject = new Something()’. At this point, someObject is ‘rooted’ to the global object.
Memory inspection at specific points during application execution
It’s sometimes important to be able to take snapshots at very specific points in time, such as immediately before a large mutation of the DOM. This can be difficult to do via the buttons in the tool, particularly if the tool is used, changes are made, and then the same scenario is run again. To alleviate these issues you can take snapshots programmatically.
- console.takeHeapSnapshot – takes a snapshot that appears on the tool
- console.profileMark – displays a profile mark in the memory graph while the diagnostic session is running.
In addition, there are often interesting sync points that might contribute to memory churn that are useful to be able to identify over the course of an analysis session. For this you can annotate the graph with custom ‘marks’.
It’s important to check for existence of the commands before usage, since they are only available in the context of the memory analyzer, example:
if (console && console.takeHeapSnapshot) {
console.takeHeapSnapshot();
}
Sharing memory analysis sessions
Working on teams or having someone with more experience take a look at analysis data is often helpful. When you stop a diagnostic session (after walking through a scenario under memory analysis and having taken at least one snapshot), the collection of snapshots is saved to disk.
A Diagnostic Sessions folder appears under the opened Solution in Visual Studio (or in Miscellaneous Files if no solution is open), which contains “.diagsession” files.
The .diagsession files can be renamed and shared and later re-opened in compatible versions of Visual Studio. When opening the file you can see the snapshot tiles and inspect the detail views.
Summary
The JavaScript memory analyzer tool for Windows Store applications in Visual Studio enables you to easily identify how much memory is being consumed by a JavaScript-based Windows Store app. In particular, it supports quickly identifying what’s keeping objects alive such that memory issues can be addressed. It provides a simple UI, clean details view for investigations and views for fast detection of JavaScript memory allocations.
Related links:
- //BUILD talk: Diagnosing performance and memory issues in JavaScript-based Diagnosing performance and memory issues in JavaScript-based Diagnosing performance and memory issues in JavaScript-based Windows Store apps
- Dev Center documentation: Analyzing memory usage in Windows Store apps (JavaScript)
We hope that you will find this an invaluable tool! Please provide us with your feedback!
Thanks,
The JavaScript Language Tooling Team

0 comments