One of the top requests from developers (reiterated at //BUILD last year) has been tools for inspecting the XAML at runtime. With Visual Studio 2015 CTP6 we’re pleased to introduce the new UI debugging tools for XAML. These tools enable you to inspect the visual tree of your running WPF application as well as the properties on any element in the tree, turning the difficult challenge of picking apart how properties override each other and figuring out winning behavior into a straightforward task that’s done at runtime, when everything is taken into account. Visual Studio integrates these UI debugging tools directly into the debugging experience so they fit seamlessly into the development cycle.
Today’s announcement brings support for WPF; we’ll release support for Windows Store apps in a future update.
Let’s take a closer look.
Meet the Live Visual Tree
The Live Visual Tree is the first of the two key pieces of the UI debugging tools:
You can use the Live Visual Tree to:
- See an “up-to-date” view of the application. As elements are added or removed from the visual tree, the Live Visual Tree updates in real time.
- Jump to the document and line of the definition with either the “Preview Source” command or in a context menu on appropriate elements when the XAML defines elements (as denoted by the source icon after many of the elements above).
- View descendant count, so you can understand complex UI structures and locate those nasty performance issues.
The Live Property Explorer
Clicking the properties button in the Live Visual Tree or selecting “Show Properties” in the context menu of any element brings up the Live Property Explorer.
The Live Property Explorer:
- Shows every property set on the currently selected elements, even property setters that are overridden elsewhere.
- Breaks properties into scopes so you can quickly see if a property is being set by the element itself, a style or elsewhere.
- Enables you to change properties and push those changes to the running application, so you can see the effect immediately.
In-App selection
Selecting elements in the Visual Tree is easy when you know the structure of the app. When you don’t know the minutia of the layout, the Live Visual Tree also provides an in-app element selection tool. When enabled, mouse events are intercepted by the UI debugging tools, allowing direct selection of any element simply by clicking on them.
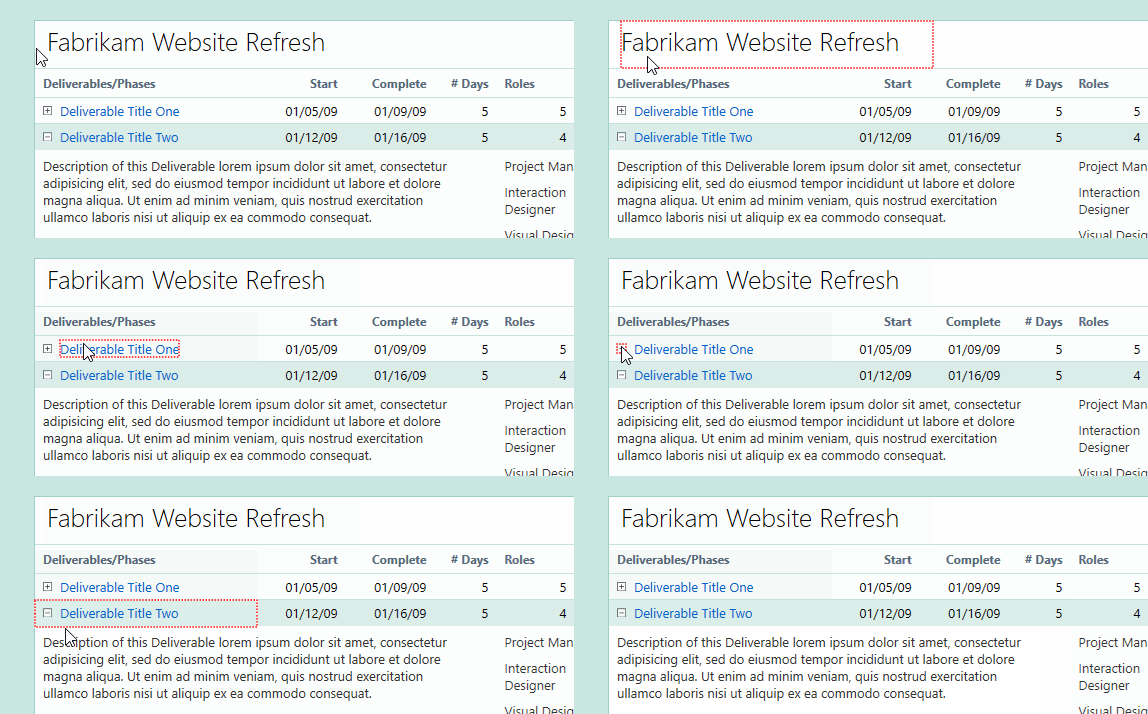
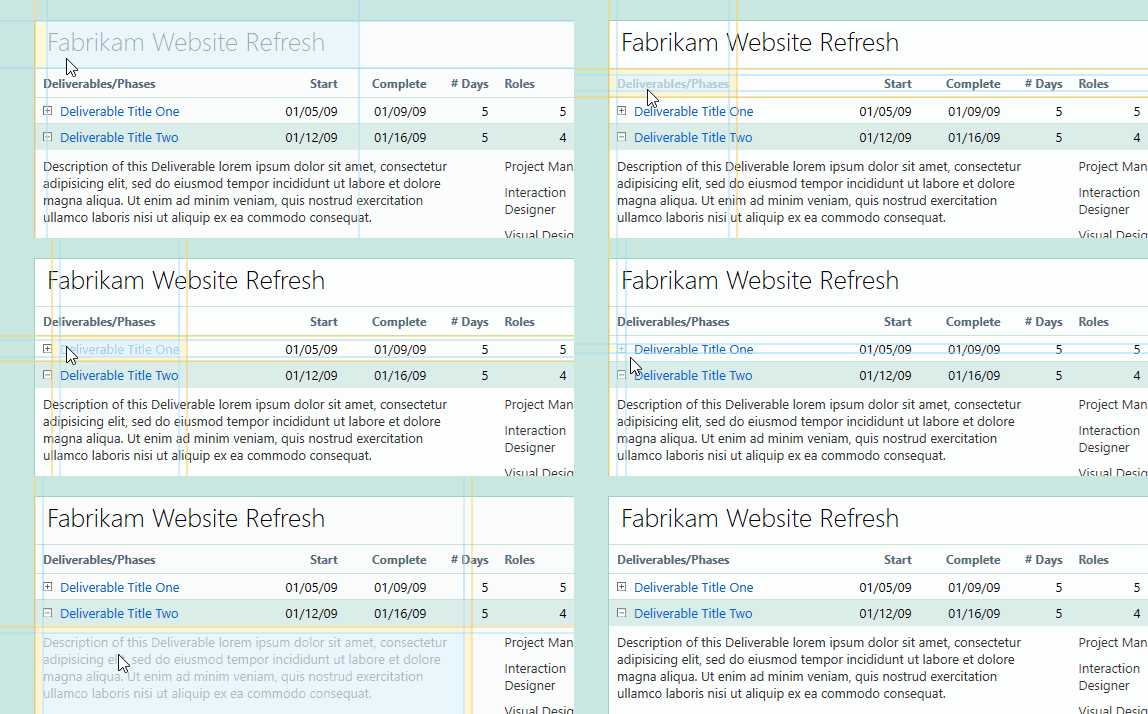
The In-App selection provides two feedback modes for selecting elements:
- Basic selection mode shows a red dotted outline around the element that is about to be selected when you hover over it. Then, on a click, the Live Visual Tree selects the element, loads its properties into the Live Property Explorer and, if you enabled the Preview Source option, locates and opens the XAML for the selected element.
- Layout adorner selection mode includes additional adorners that illustrate margins and the parent to which the margins are applied.
These tools, as part of Visual Studio 2015 CTP 6, give you an early glimpse into our new XAML debugging experience, but they’re not finished yet. Here’s a few things we’re hoping to add as development continues:
- Support for Windows Store apps.
- Source code persistence — allowing users to change properties at debug time and push those changes into the source code.
Additionally, there are some known limitations in the CTP, including the lack of CLR properties and support for editing collections, but the team is working on including these in the RTM update. If you’re interested in the specifics about how these tools work, as well as the ways we’ve extended WPF to support the UI Debugging tools, you may find this article on Expanding WPF for UI Debugging interesting.
We’d love for folks to try these tools out. Tell us what you like, what you don’t like and what you think is missing. The product team is still eager to hear your feedback and we’re grateful for any comments that folks are willing to share. If you have feedback on the UI debugging tools, you can comment here, post suggestions on UserVoice, and report bugs on the Connect site. From here, it’s all up to you.


0 comments