In my previous post, I showed how to enable the hidden Visual Studio debugger for MSBuild script, and demonstrated it by stepping through the evaluation of a C# project. In this post, I’ll keep debugging into the actual build of that project.
Note that this blog is rather narrow, so some of the screenshots may be hard to see – you can click on them to see the full size version.
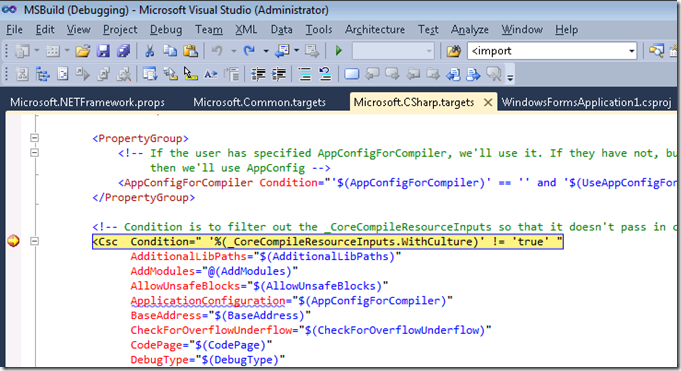
Starting from where we left off last post, I’ll set a breakpoint in Microsoft.CSharp.targets on the <Csc> task tag. That’s where the compiler will run. Then hit F5 to run to it.
Ideally, I’d be able to set a breakpoint on the enclosing <Target> tag, but unfortunately there’s a bug: you can’t. As a workaround you could inspect the values of a target’s attributes when you get to the first tag in the body of that target. If the target’s condition is false, or if its inputs and outputs are up to date so that it skips, it’s not so simple. You’d have to work around this by stepping up to the target before.
I’d like to be able to evaluate the condition on the task there, but because it’s batchable it could have multiple results: the EvaluateCondition delegate I used before won’t accept it. If this was a parameter on the task, I’d probably step into the task’s code itself to see the value. Since it’s a condition, I’d probably look through the metadata on the item list directly, or query the object model in some way.
Something like the value of Sources is easy to evaluate here, though:
Now I want to step into the task implementation.
You might think that at this point, you can simply Step In (F11). However, you can’t – it happens that MSBuild will run this task on a different thread. To know to jump threads properly here, the debugger has to support what they call "causality" for this kind of debugging, and since it doesn’t know anything about MSBuild, it doesn’t.
It’s easy to get the job done though – set a breakpoint in the task and run until it’s hit.
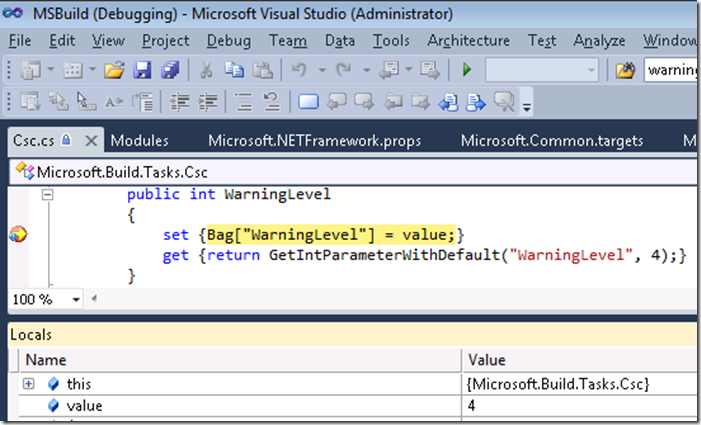
I have the source code for the Csc task, so I set a breakpoint here on the setter of the WarningLevel property, and did Continue (F5). I can see the task is getting "4" as the value of that property here. I can debug this code just like any other C# code, stepping through methods and so forth.
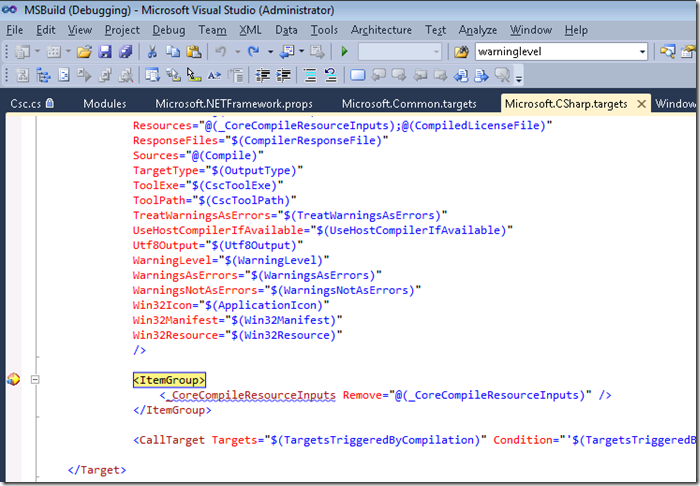
To get out to the XML, I’ll set a breakpoint in it and run – the same trick I used to get into the C#, but in reverse. Here I’m at the next tag after the task:
I used Csc as an example here, but you’ll generally be debugging a custom task (or possibly, logger). Just make sure the assembly is not optimized: since you have Just-My-Code on, it won’t be debuggable otherwise. If you only have access to an optimized one, you can switch off Just-My-Code temporarily.
There’s a CallTarget tag here: you can step into those, and like imports they’ll look like a new frame on the callstack – although unlike imports, that’s correct for their semantics.
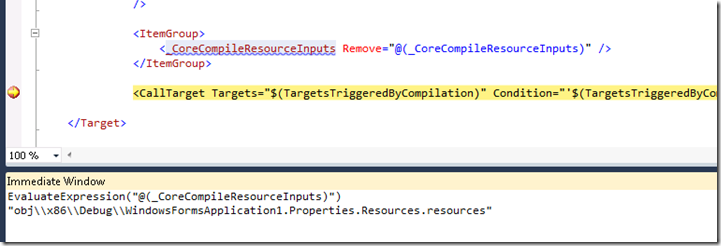
Probably the biggest limitation (bug) with the debugger right now is that you can’t see item and property changes made inside a target. For example, at this point @(_CoreCompileResourceInputs) should be empty because of the line above, but the immediate window tells me it isn’t:
When you get past that target, you can see the changes.
Scenario 2: Debugging a build with multiple projects
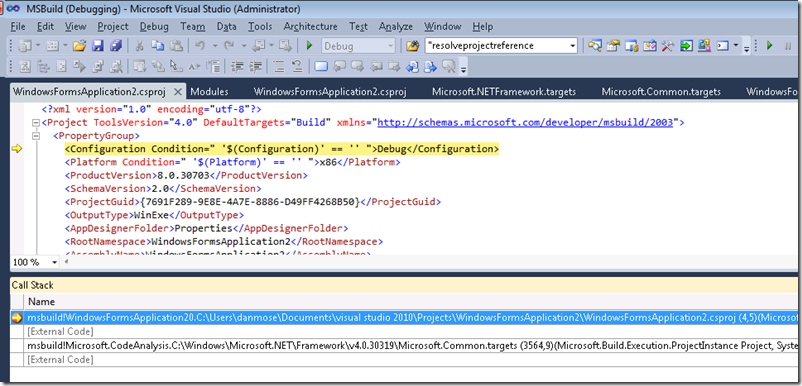
Typically there’s more than one project in a build. I’ve added a project reference from this project to another. I’ve put a breakpoint at the top of that project, and run to it:
The bottom of the callstack is the point in Microsoft.Common.targets where, early in the build of WindowsFormsApplication1, it invoked WindowsFormsApplication2.
In my next posts I’m going to cover
- Debugging a multiprocessor build
- Debugging the build of projects loaded into Visual Studio
See you then!
Dan
Visual Studio Project & Build Dev Lead


0 comments