First of all, let’s take a look at the example from one of my previous posts. It creates an expression tree for calculating the factorial of a number.
ParameterExpression value =
    Expression.Parameter(typeof(int), "value");
ParameterExpression result =
    Expression.Parameter(typeof(int), "result");
LabelTarget label = Expression.Label(typeof(int));
BlockExpression block = Expression.Block(
    new[] { result },
    Expression.Assign(result, Expression.Constant(1)),
    Expression.Loop(
        Expression.IfThenElse(
            Expression.GreaterThan(value,
                Expression.Constant(1)),
            Expression.MultiplyAssign(result,
                Expression.PostDecrementAssign(value)),
        Expression.Break(label, result)
        ),
        label
    )
);
Expression<Func<int, int>> lambda =
    Expression.Lambda<Func<int, int>>(block, value);
Console.WriteLine(lambda.Compile()(5));
Now, what if you want to see the content of this tree in debug mode? You can try lambda.ToString() but it’s not very informative. All you get is this: value => {var result; … }. Basically, it tells you only that the lambda has the result parameter.
Another option is to explore the tree structure in the Watch window. However, since this is a tree, you need to click through numerous nodes. This gives you a good understanding of the tree structure, but it might be hard to understand the actual content of the tree.
But there is a better solution: expression trees now have their own visualizer that helps you to explore their structure and content.
Copy the above code example into Visual Studio 2010, set a breakpoint at the last line, and press F5. Rest the mouse pointer over the lambda variable and you will see that it has the DebugView property. This property is private and is exposed only in the debugger, so you can’t use it in your code. But it’s used to hook up the expression trees visualizer. Click the magnifying glass icon and you will see the list of available visualizers.
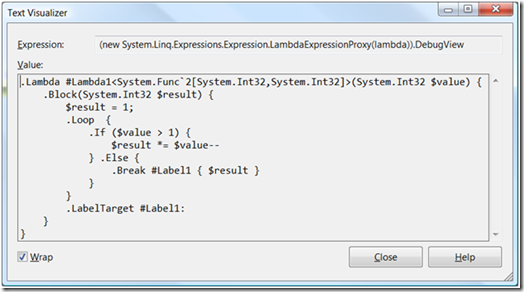
 Now click Text Visualizer and you get this.
 As you can see, the content of the expression tree is represented in some kind of metalanguage. (No, we couldn’t use C# here, because expression trees serve other languages as well.)
There are some simple rules used in this metalanguage:
- Parameters are displayed with a $ symbol at the beginning (for example, $result and $value.)
- Integer, string, and null constants are displayed “as is” (for example, $result = 1). For other numeric types that have standard suffixes, the suffix is added to the value. (For example, for decimal the value is 1M, for double 1D, etc.)
- If a parameter, label, or lambda expression does not have a name, the name is generated automatically (for example, #Label1, $var1, etc.)
- Checked operators are displayed with the # symbol preceding the operator. For example, the checked addition operator is displayed as #+.
There are some other nuances that I think are evident and don’t need additional explanation. But if you don’t understand something in this syntax, let me know and I’ll include more information in the documentation.
Update:
Documentation for this feature is now availabe on MSDN: Debugging Expression Trees.

0 comments