
As you may know, the next version of Microsoft Edge will adopt the Chromium open source project to create better web compatibility and less fragmentation of different underlying web platforms. If you haven’t already, you can try out preview builds of Microsoft Edge from https://www.microsoftedgeinsider.com which is now available on Windows 10, 8.1, 8, 7, and macOS!
With Visual Studio today, you can already debug JavaScript running in the current version of Microsoft Edge, built on top of the EdgeHTML web platform. Starting with Visual Studio 2019 version 16.2, we’ve extended support to the preview builds of Microsoft Edge, which leverage Chromium. Head to visualstudio.com/downloads/ to download the latest Visual Studio now!
Create a new ASP.NET Core Web Application
You can now debug JavaScript in Microsoft Edge for your ASP.NET Framework and ASP.NET Core applications. To try out this feature, let’s start by creating a new ASP.NET Core Web Application.

To show off support for debugging JavaScript, we’ll use the React.js template which shows you how to integrate React.js with an ASP.NET Core application. Once your project has been created, open ClientApp/src/App.js which you’ll see is a React component for our app.
Using JavaScript to calculate the Fibonacci sequence
Let’s assume that as part of this app, a user will input the term in the Fibonacci sequence they want to know and our client-side JavaScript code will be responsible for calculating it and displaying the result to the user. The Fibonacci sequence is a series of numbers where each number is the sum of the two preceding ones, starting with 0 and 1.
| Position | 1 | 2 | 3 | 4 | 5 | 6 | 7 |
| Value | 0 | 1 | 1 | 2 | 3 | 5 | 8 |
To handle this calculation, let’s create a new Fibonacci component and add it to our app. Start by modifying App.js to import our soon-to-be-created Fibonacci component and route to it:
import React, { Component } from 'react';
import { Route } from 'react-router';
import { Layout } from './components/Layout';
import { Home } from './components/Home';
import { FetchData } from './components/FetchData';
import { Counter } from './components/Counter';
import { Fibonacci } from './components/Fibonacci';

export default class App extends Component {
  displayName = App.name

  render() {
    return (
      <Layout>
        <Route exact path='/' component={Home} />
        <Route path='/counter' component={Counter} />
        <Route path='/fetchdata' component={FetchData} />
        <Route path='/fibonacci' component={Fibonacci} />
      </Layout>
    );
  }
}
Now that our app will handle routing the /fibonacci endpoint, let’s modify the NavMenu to navigate to that endpoint. Open ClientApp/src/components/NavMenu.js and add this LinkContainer component at line 36:
<LinkContainer to={'/fibonacci'}>
  <NavItem>
    <Glyphicon glyph='alert' /> Fibonacci
  </NavItem>
</LinkContainer>
before the </Nav> tag. Now, you’ll be able to easily test our new /fibonacci route from the NavMenu. Finally, let’s create our Fibonacci component. Create a new JavaScript file (Ctrl+N) and save it as Fibonacci.js in the ClientApp/src/components/ folder. Add the code below to your new component:
import React, { Component } from 'react';

export class Fibonacci extends Component {
  displayName = Fibonacci.name

  constructor(props) {
    super(props);
    this.state = {
      n: 8,
      f_n: null,
    };
    this.calculateFibonacci = this.calculateFibonacci.bind(this);
  }

  calculateFibonacci() {
    var f_0 = 0;
    var f_1 = 1;
    for (var i = 3; i < this.state.n; i++) {
      var f_2 = f_0 + f_1;
      f_0 = f_1;
      f_1 = f_2;
    };
    this.setState({
      f_n: f_2
    })
    console.log("The " + i.toString() + "th Fibonnaci number is:", f_2);
  }

  render() {
    return (
      <div>
        <h1>Fibonacci</h1>
        <p>This is a simple example of a React component.</p>
        <p>The {this.state.n}th Fibonacci number is: <strong>{this.state.f_n}</strong></p>
        <button onClick={this.calculateFibonacci}>Calculate</button>
      </div>
    );
  }
}
Eventually, we’ll add a form to the render function for the user to supply n, the variable we’re using to represent the term in the Fibonacci sequence that they want to know. For now, just to test our logic, we’ll assume that the user wants to know what the 8th term in the sequence is, which is 13. Let’s build our app in the new Microsoft Edge to see if our code is calculating the right answer.
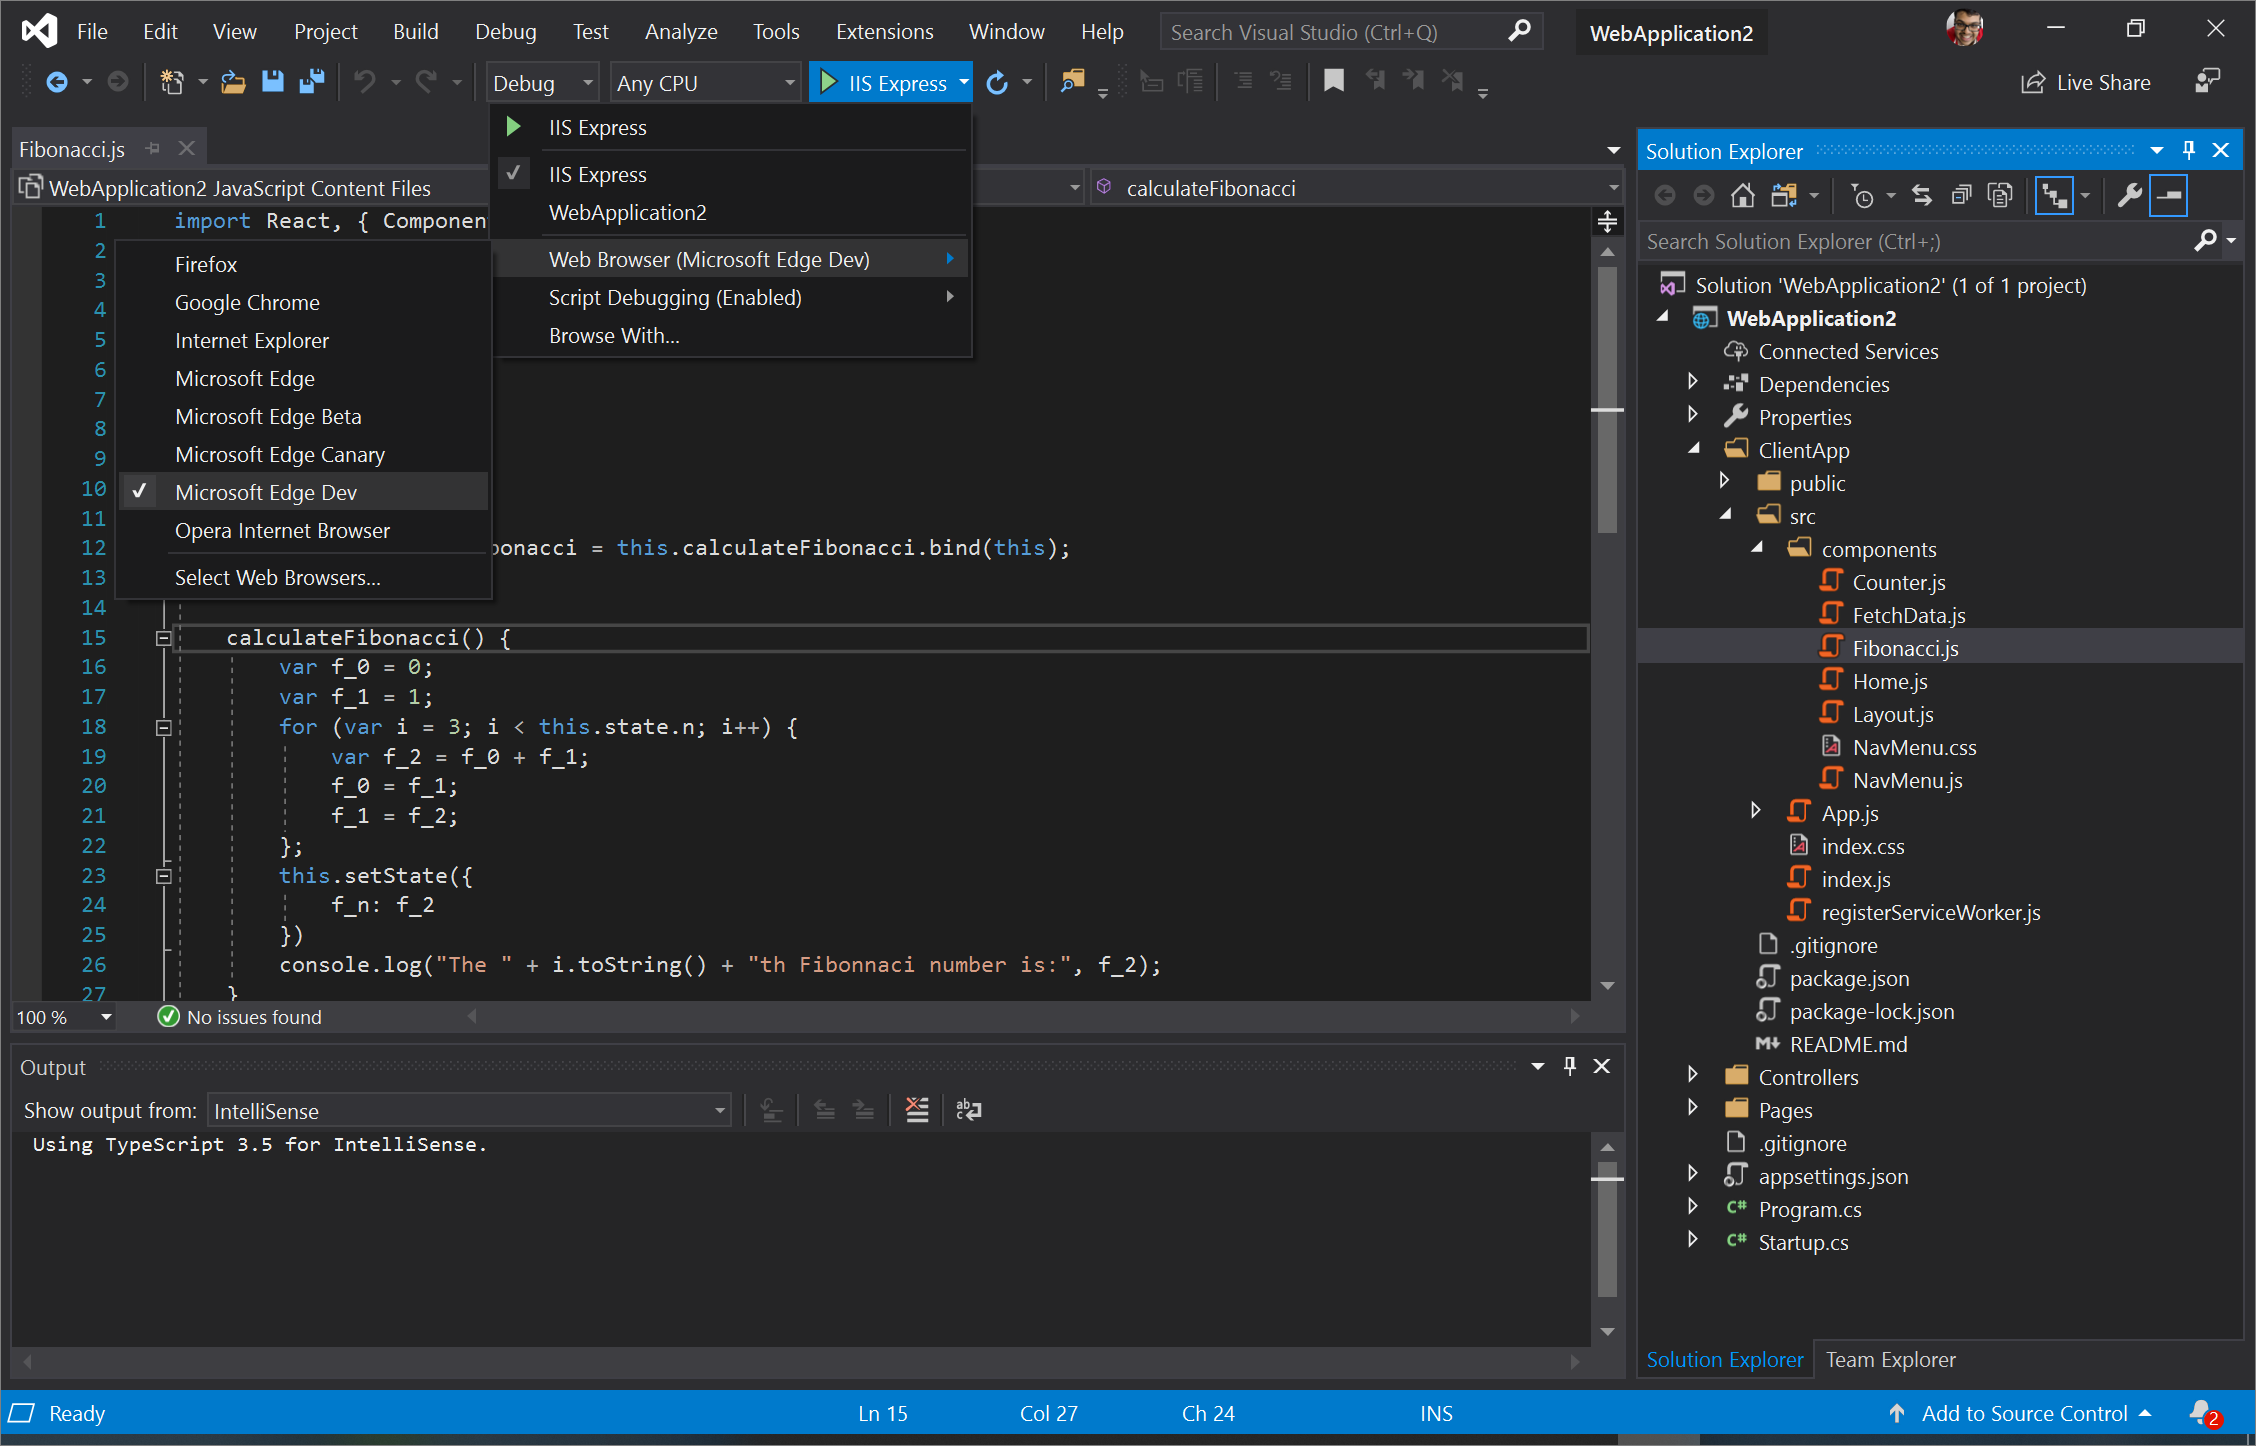
If you don’t have it installed already, head to https://www.microsoftedgeinsider.com to download the preview builds of Microsoft Edge. In Visual Studio, click the dropdown next to IIS Express and select the version of Microsoft Edge (Beta, Dev, or Canary) that you have installed. If you don’t see Microsoft Edge Beta, Dev or Canary in the dropdown, you may need to restart Visual Studio.
Now click the green Play button or press F5 on your keyboard. Visual Studio will start your web application and Microsoft Edge will automatically launch and navigate to your app.
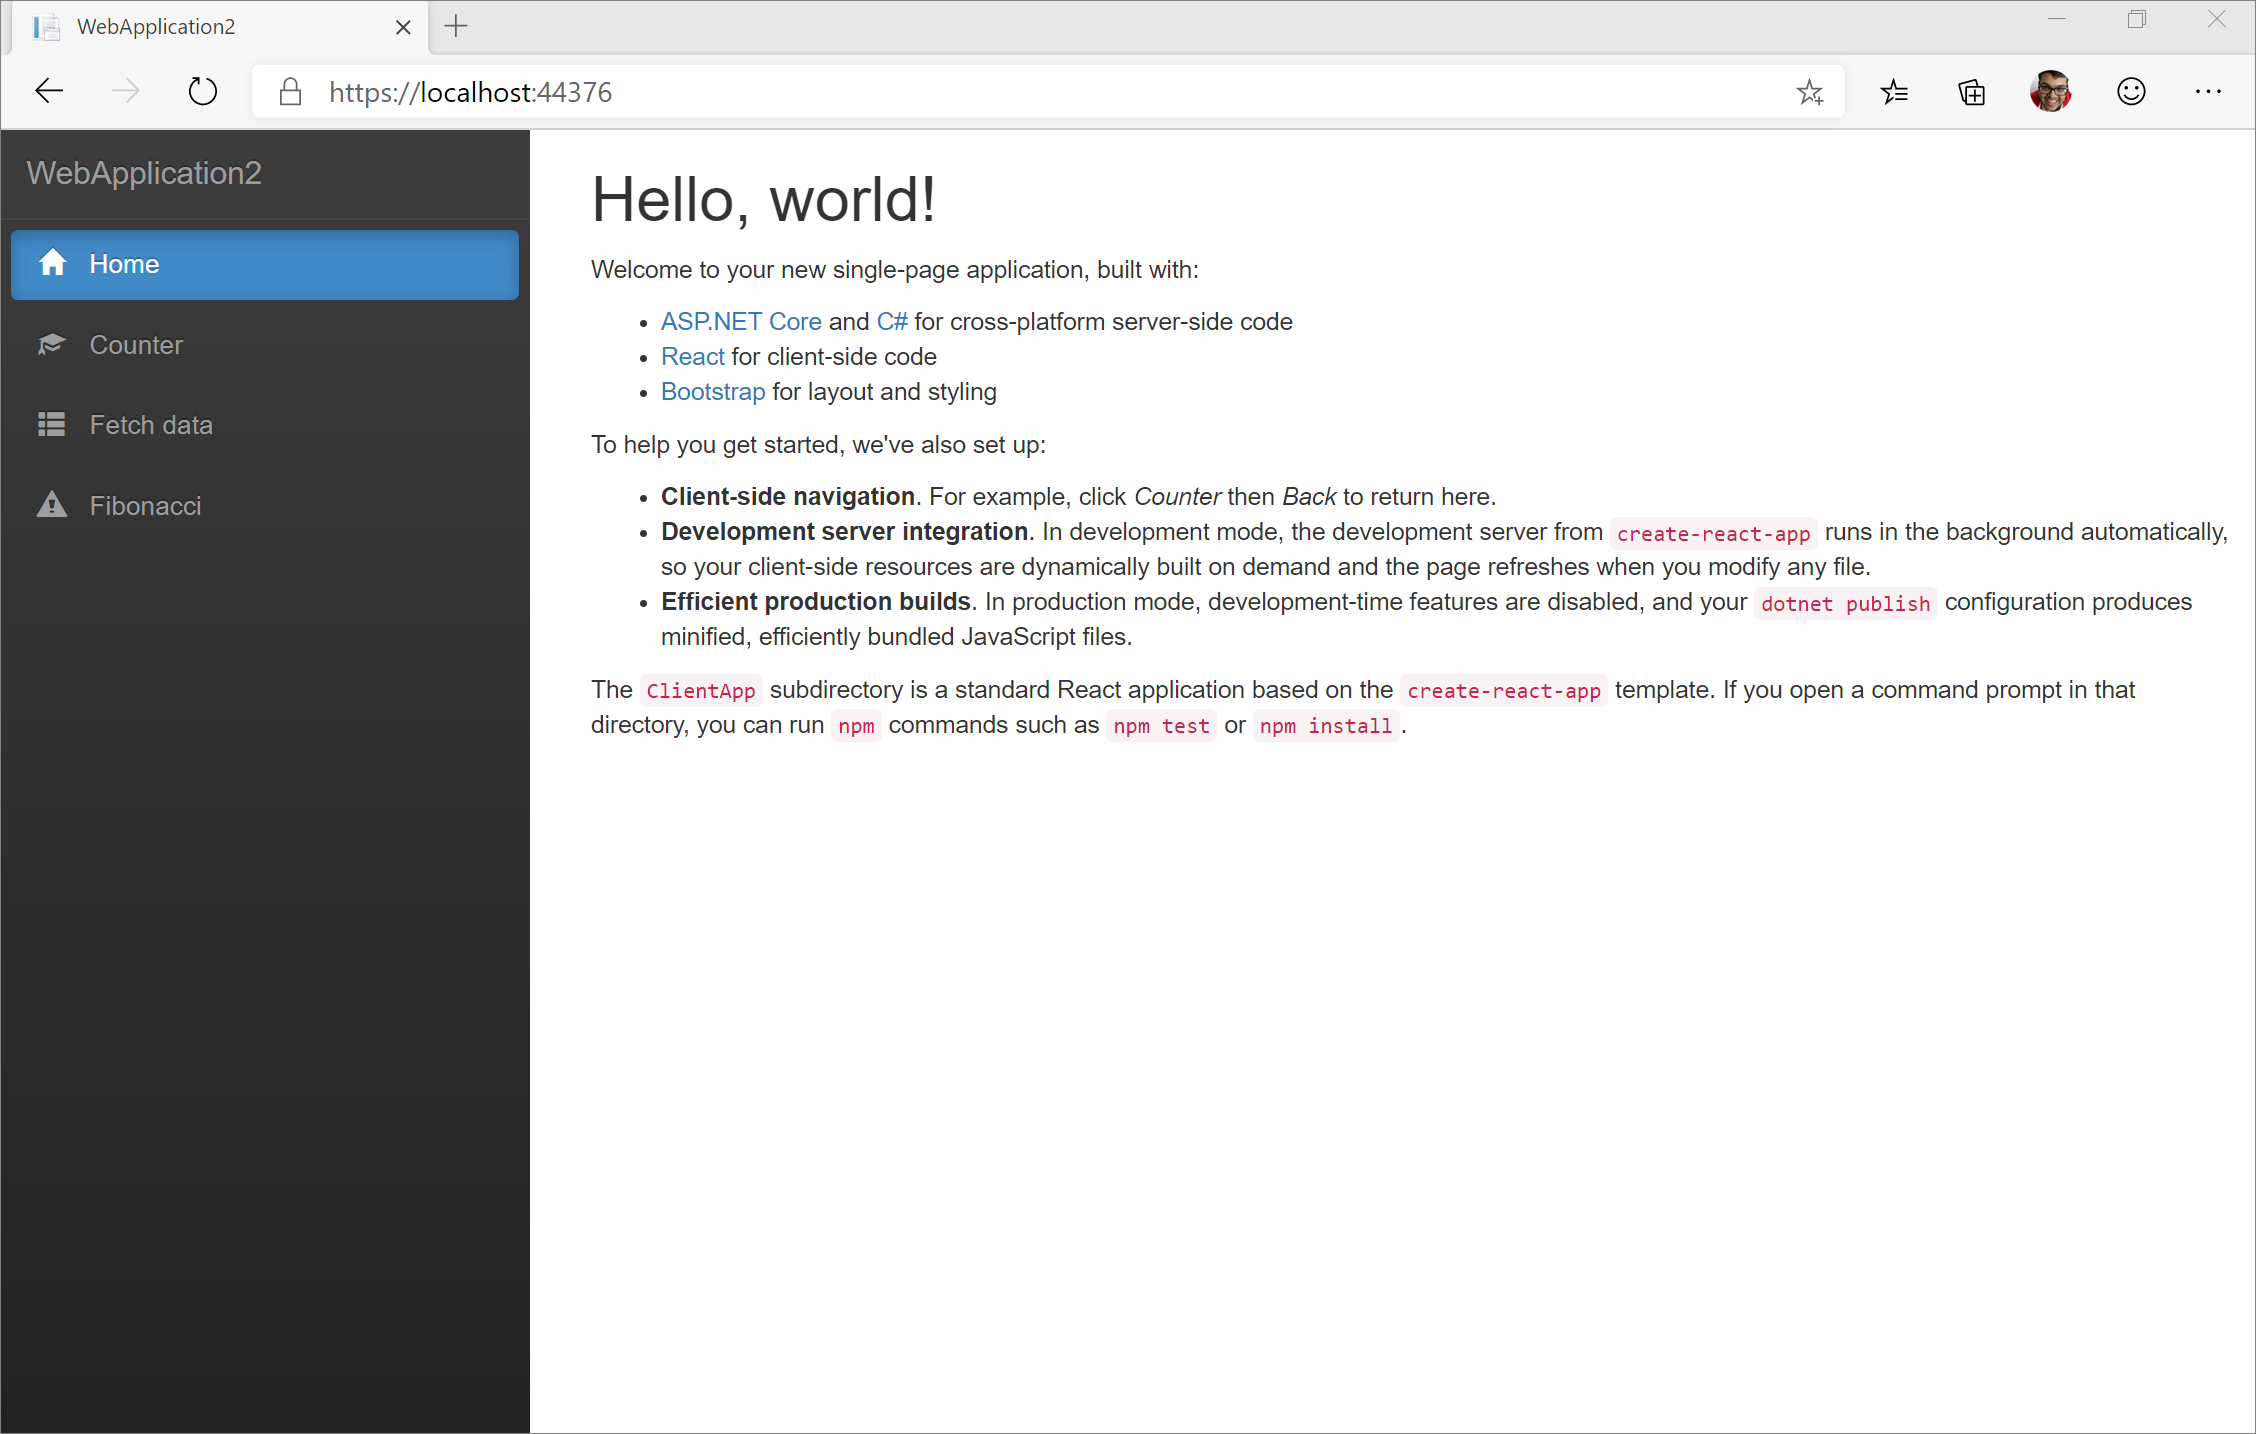
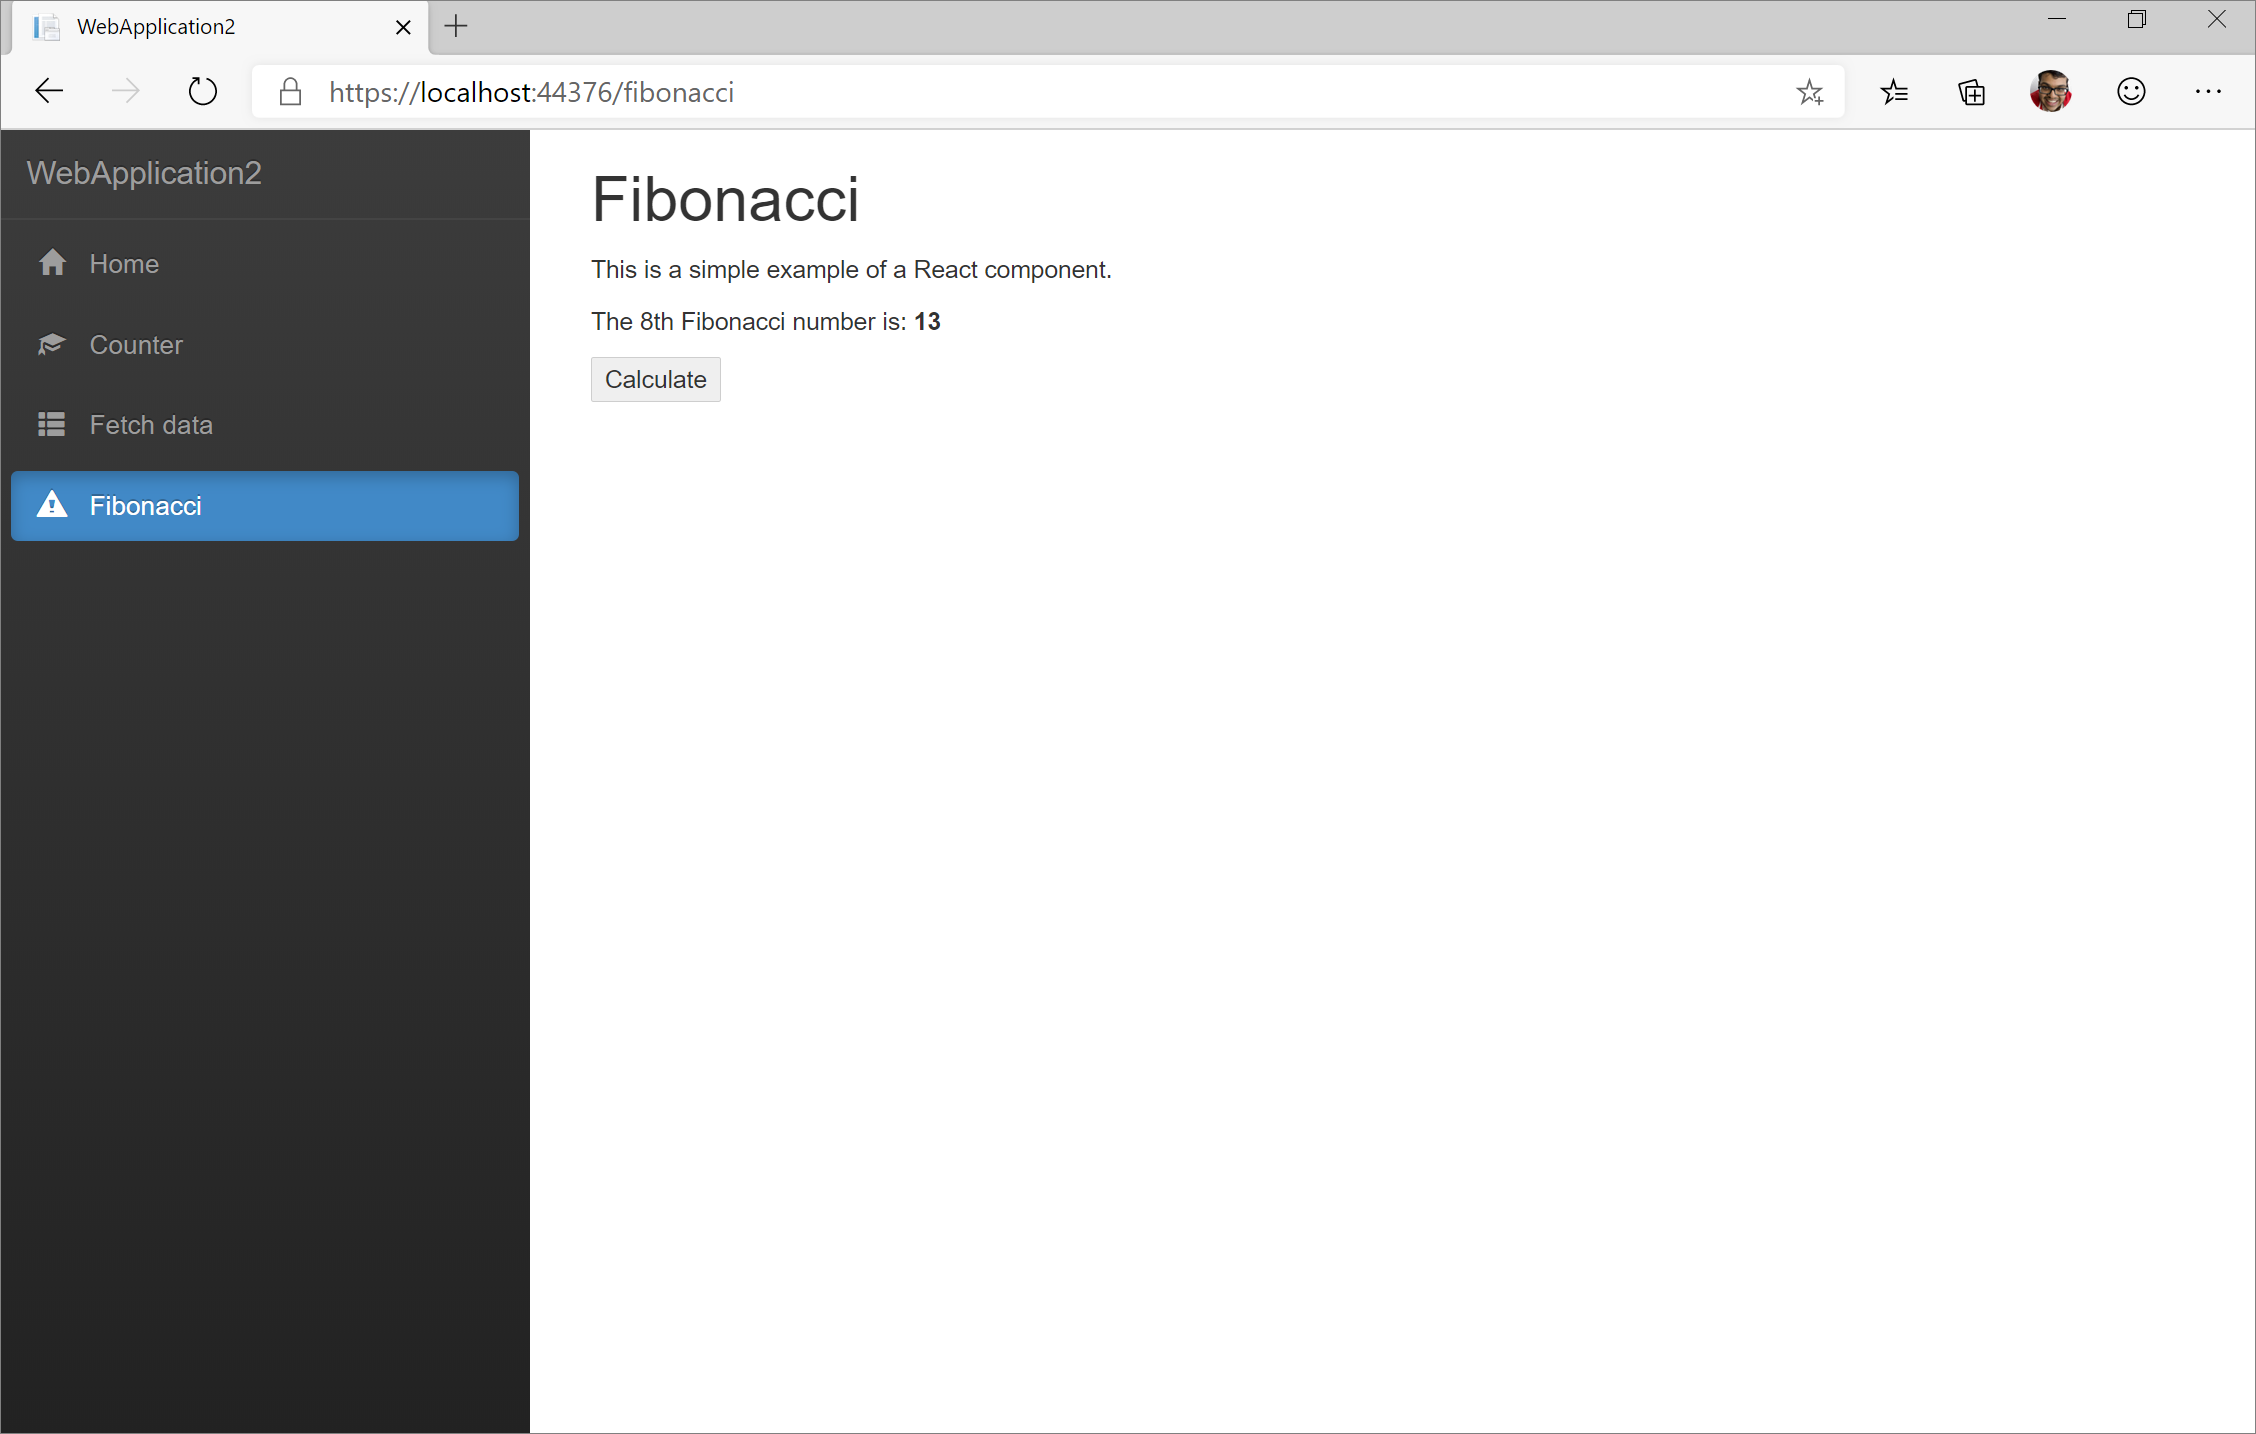
You’ll see the entry we added for our Fibonacci component in the NavMenu on the left. Click on Fibonacci.

Now click the Calculate button.

We know that the 8th term should be 13 but our code is saying that the 8th Fibonacci number is 8!
Debugging JavaScript in Visual Studio
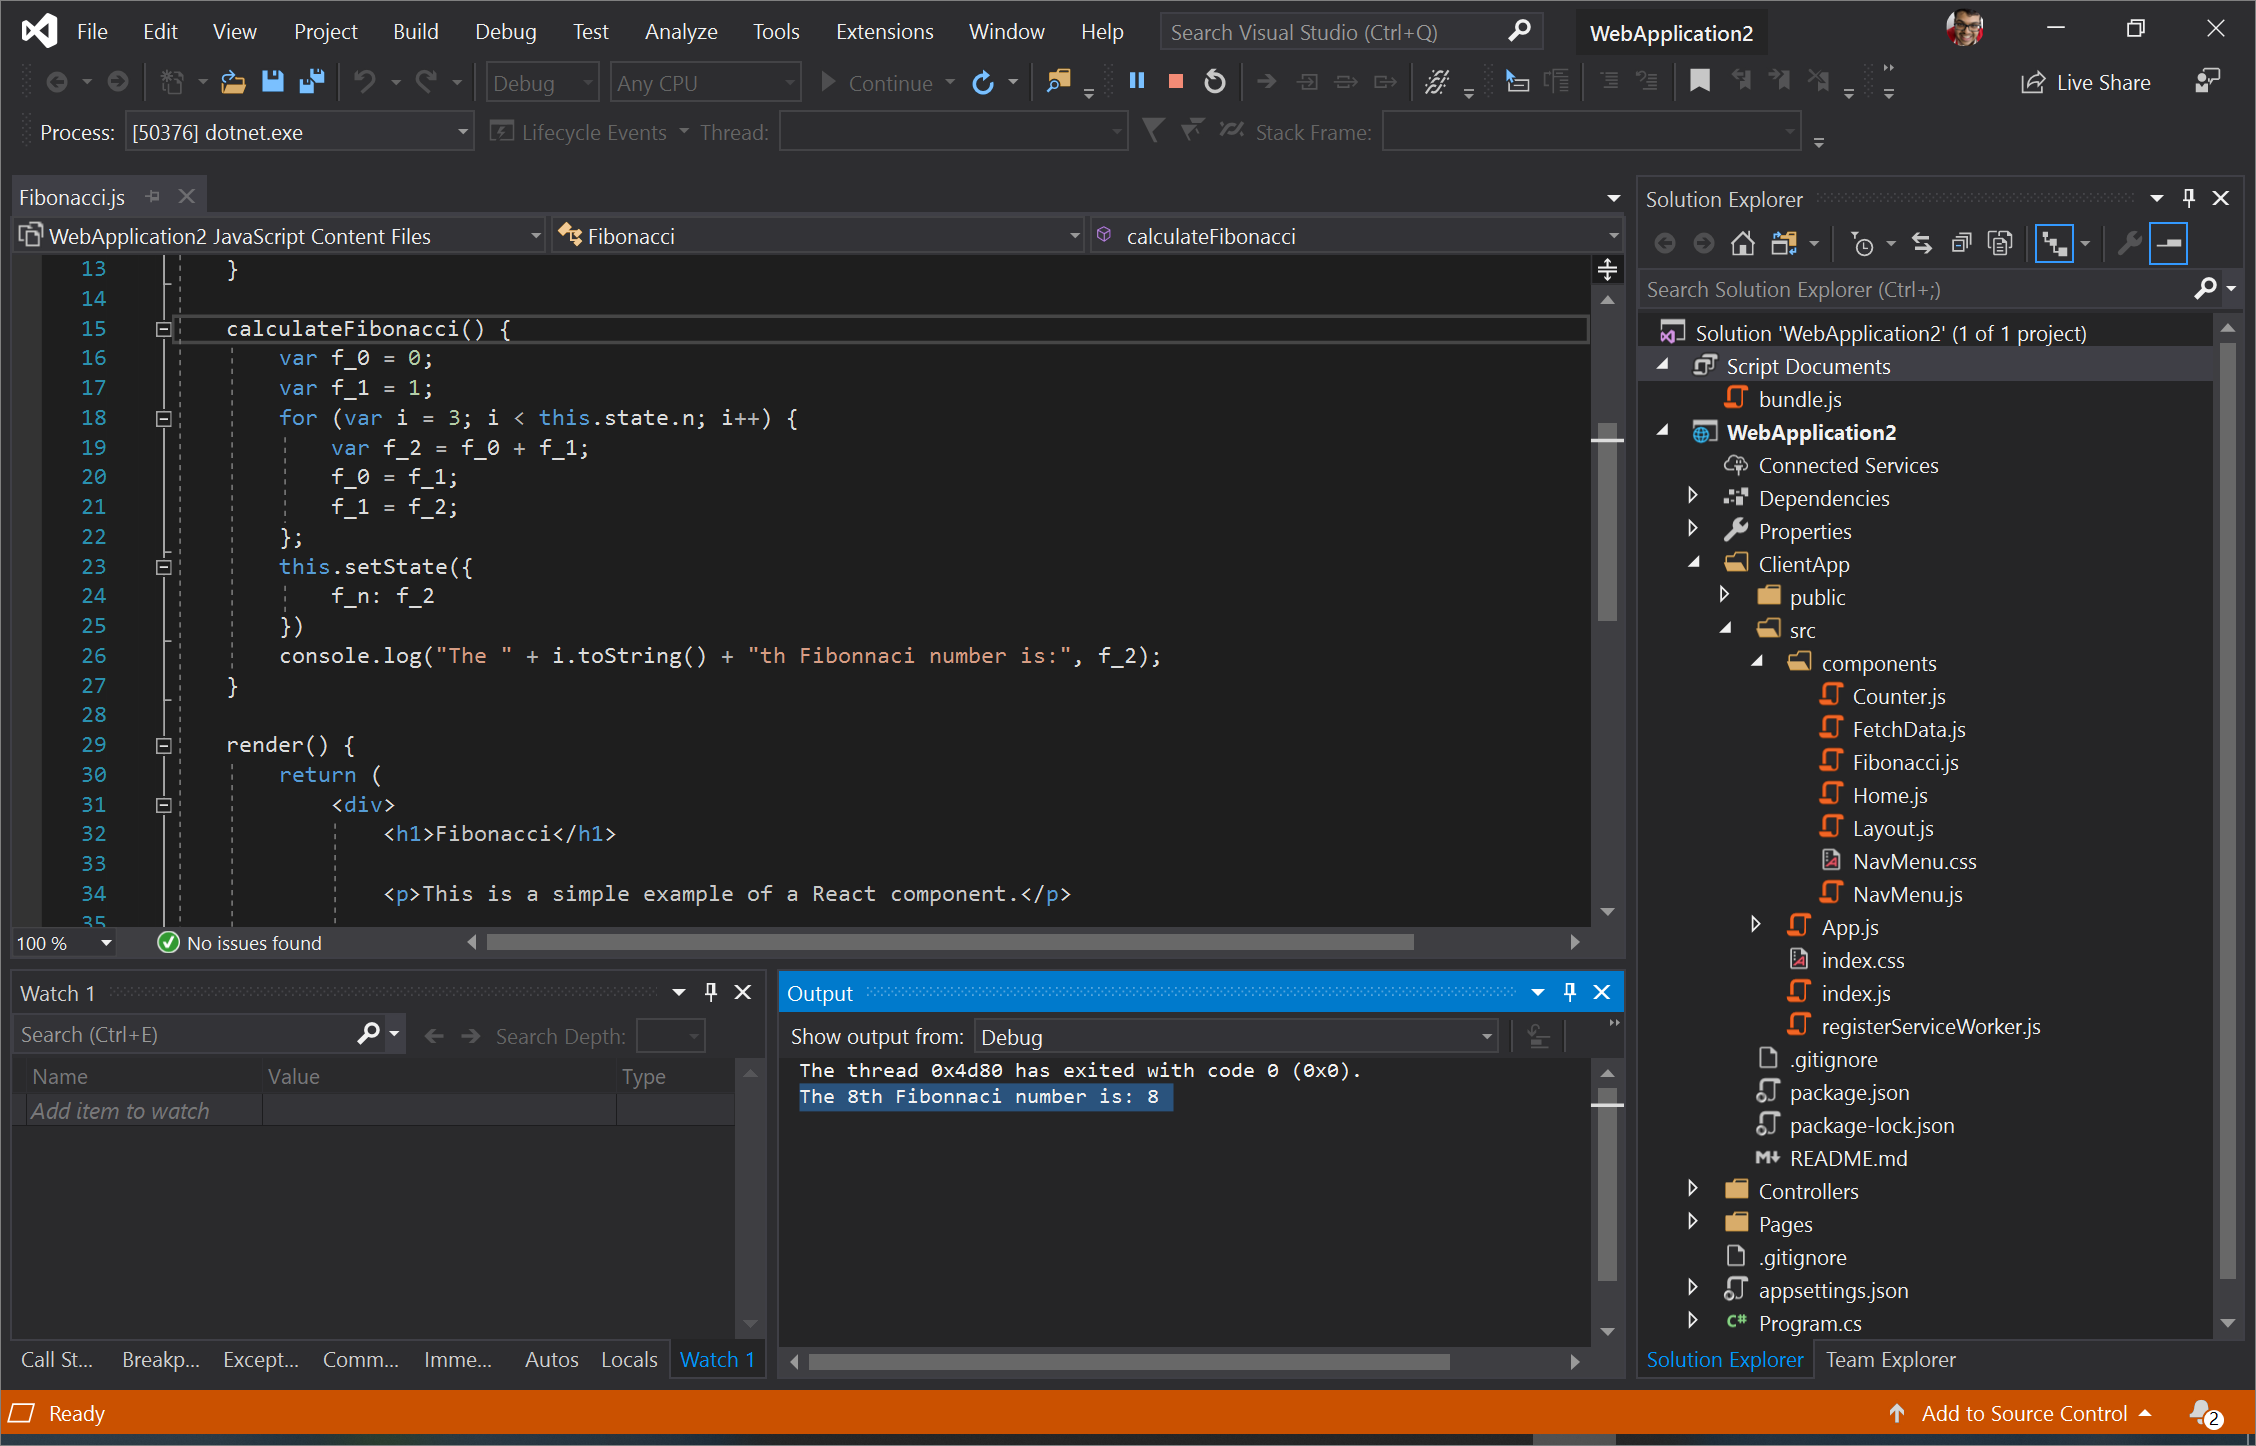
Switching back to Visual Studio, since our calculateFibonacci() function prints to the Console, you can actually see that log in the Debug Output.
To figure out where our code is going wrong, let’s set a breakpoint on Line 19 inside the for loop in Visual Studio. We’ll start by checking if our code is calculating the 3rd and 4th terms in the Fibonacci sequence correctly. Click the Restart button next to the Stop button or press Ctrl+Shift+F5 to bind the breakpoint and start debugging.
Note: If you have not enabled JavaScript debugging before, your JavaScript breakpoint will not bind successfully. Visual Studio will ask if you want to enable JavaScript debugging and then restart the debugging process and bind your breakpoint. Click Enable JavaScript Debugging (Debugging Will Stop and Restart).

We know that the first two terms in the Fibonacci sequence are 0 and 1. The third term should also be 1. Switch from the Output view to Watch 1 and add f_2, f_1, and f_0 to watch. This is what Visual Studio should look like now:
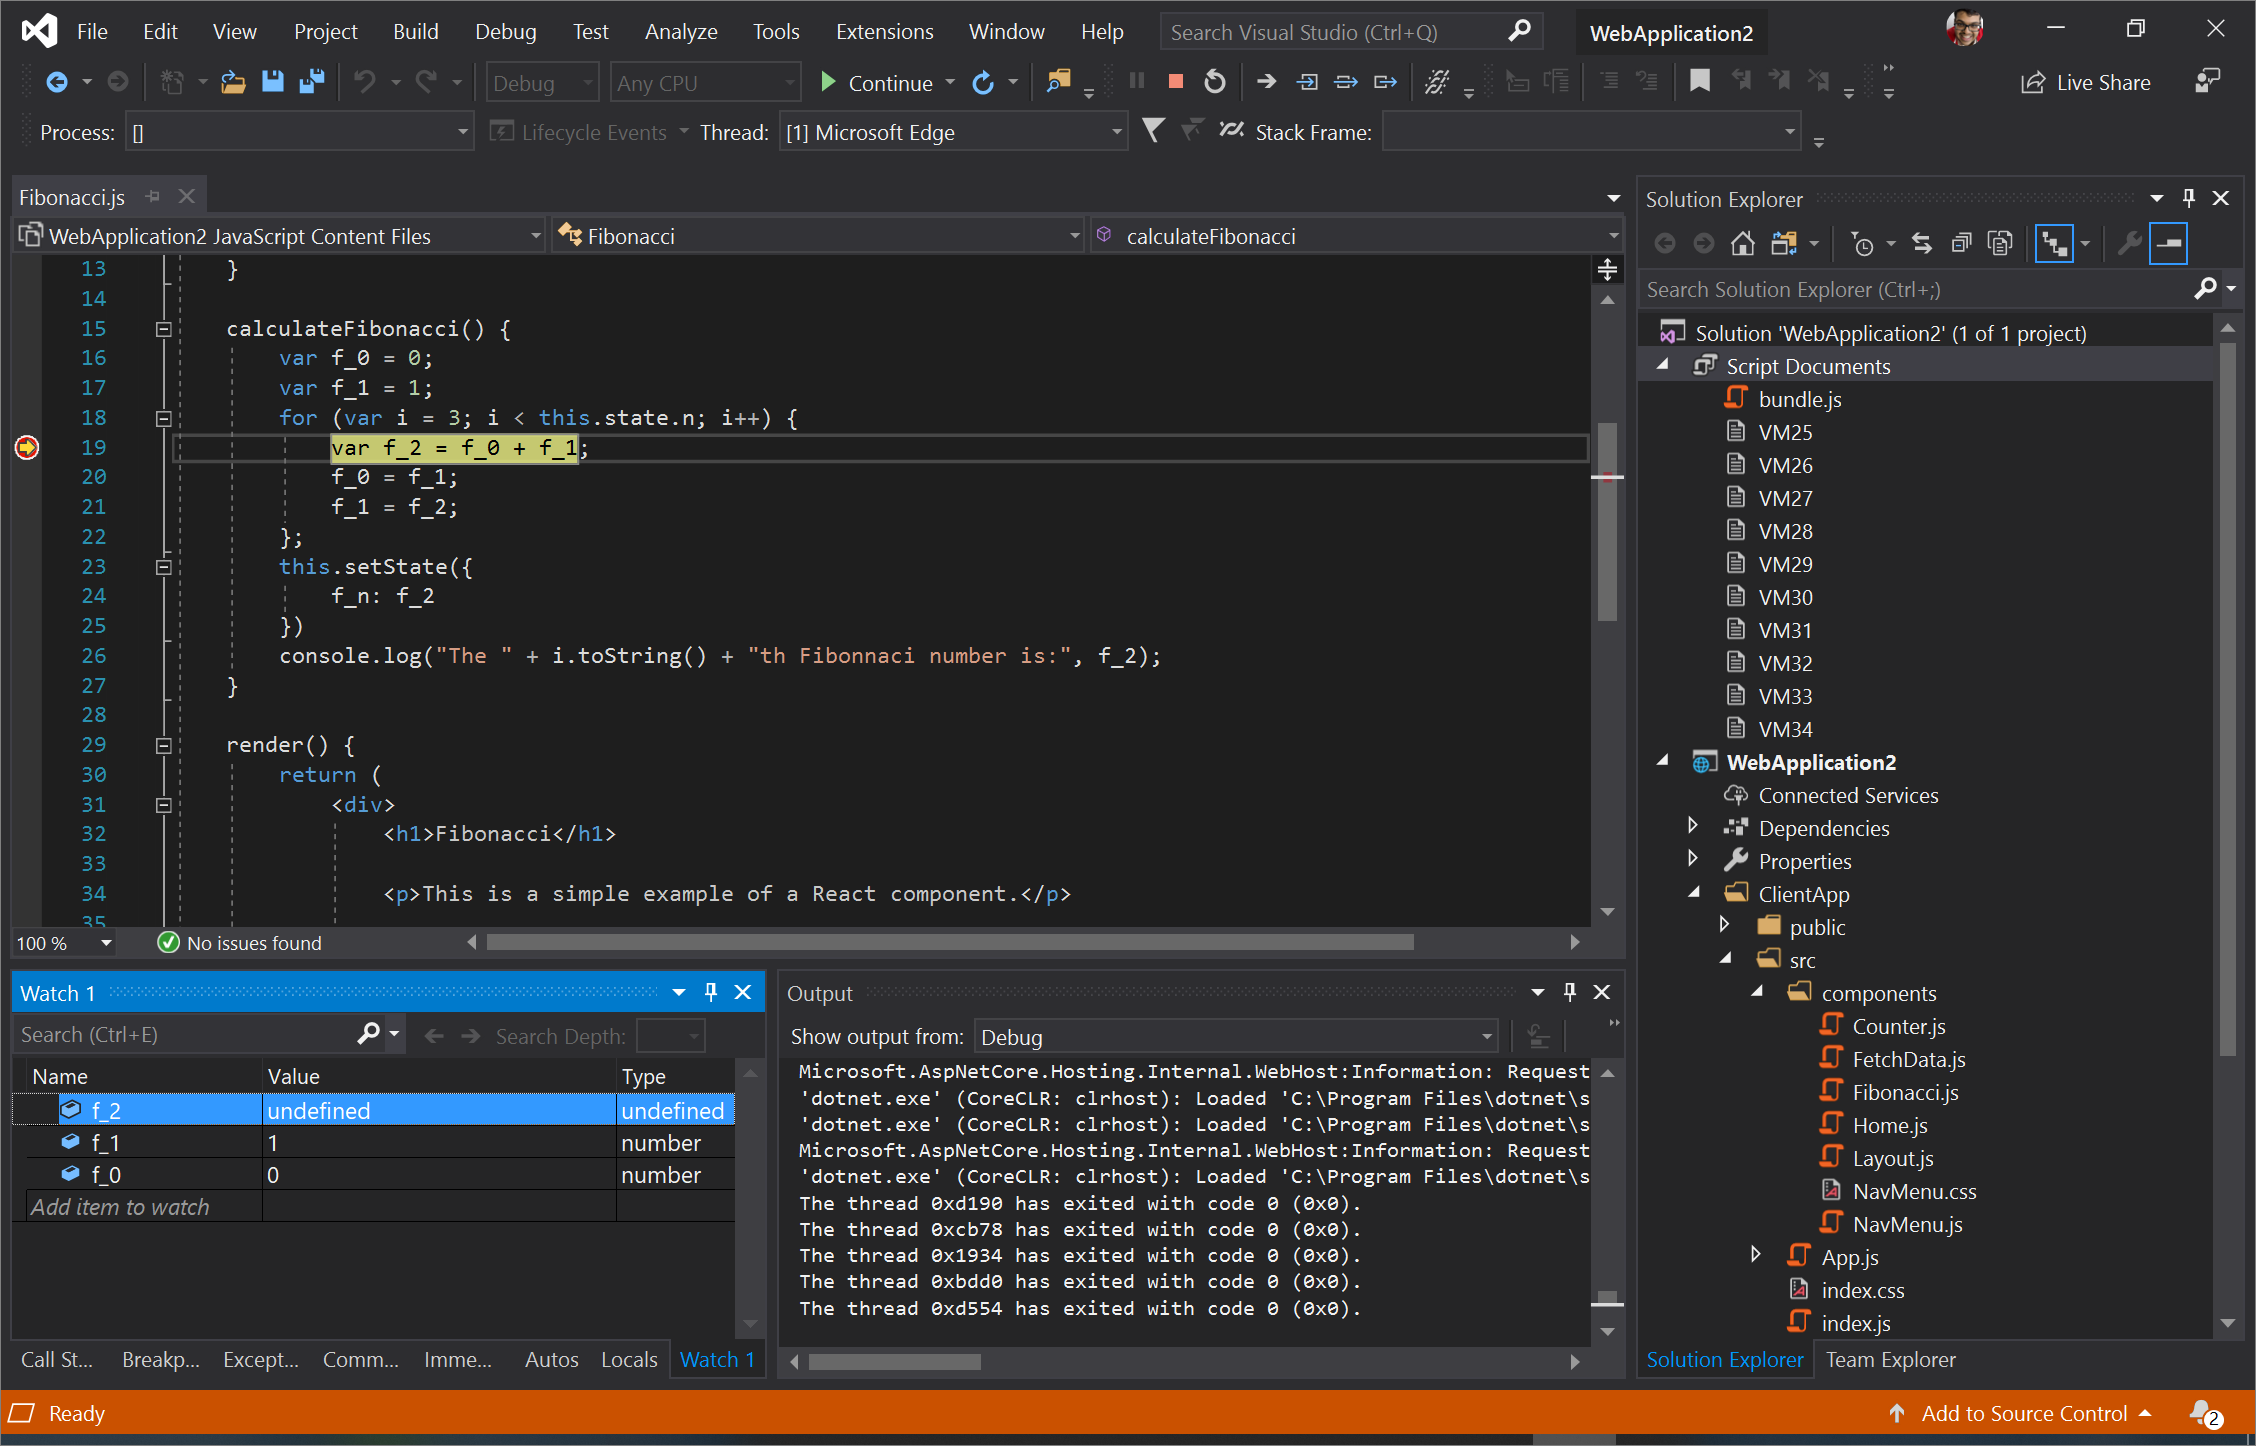
Click the Step Over button or press F10. You will now see that our code correctly calculated the third Fibonacci number, 1, as the value of f_2.
| Position | 3 | 4 |
| Value | 1 | 2 |
| Did our function compute this term correctly? |  |
Let’s keep stepping to see if there’s a bug somewhere else in the loop. Step Over two more times and you should see both f_0 and f_1 are now equal to 1, which they need to be to calculate the 4th term in the sequence.
You will now see that our code is paused at Line 18. Let’s add i to our watch as it will tell us which term we’re computing in the Fibonacci sequence. Step Over one more time and you’ll see that the value of i is now 4. Now the code is checking to see if the value of i is less than n, the variable we’re using to represent which term in the Fibonacci sequence we’re trying to find. In this example, we’ve hardcoded n as 8 since we’re trying to calculate the 8th term in the sequence. Since 4 < 8, step over again and we’ll continue looping.
Step Over now and you should see that f_2 is now 2, and since i is 4, we know that our code has successfully computed the 4th term in the Fibonacci sequence as 2.
| Position | 3 | 4 |
| Value | 1 | 2 |
| Did our function compute this term correctly? | |
|
We could keep stepping over and over again until we find the problem but since we’ve already proven that we’re calculating the 3rd and 4th terms in the Fibonnaci sequence correctly, let’s jump ahead to the 7th term since it’s the last term we calculate before we see the bug.
Using a conditional breakpoint to jump ahead in the for loop
Stop debugging for now by clicking the Stop button or pressing Shift+F5. Right click your breakpoint and select Conditions… or press Alt+F9. This will allow us to set a condition for our breakpoint and we’ll only break when that condition is true.
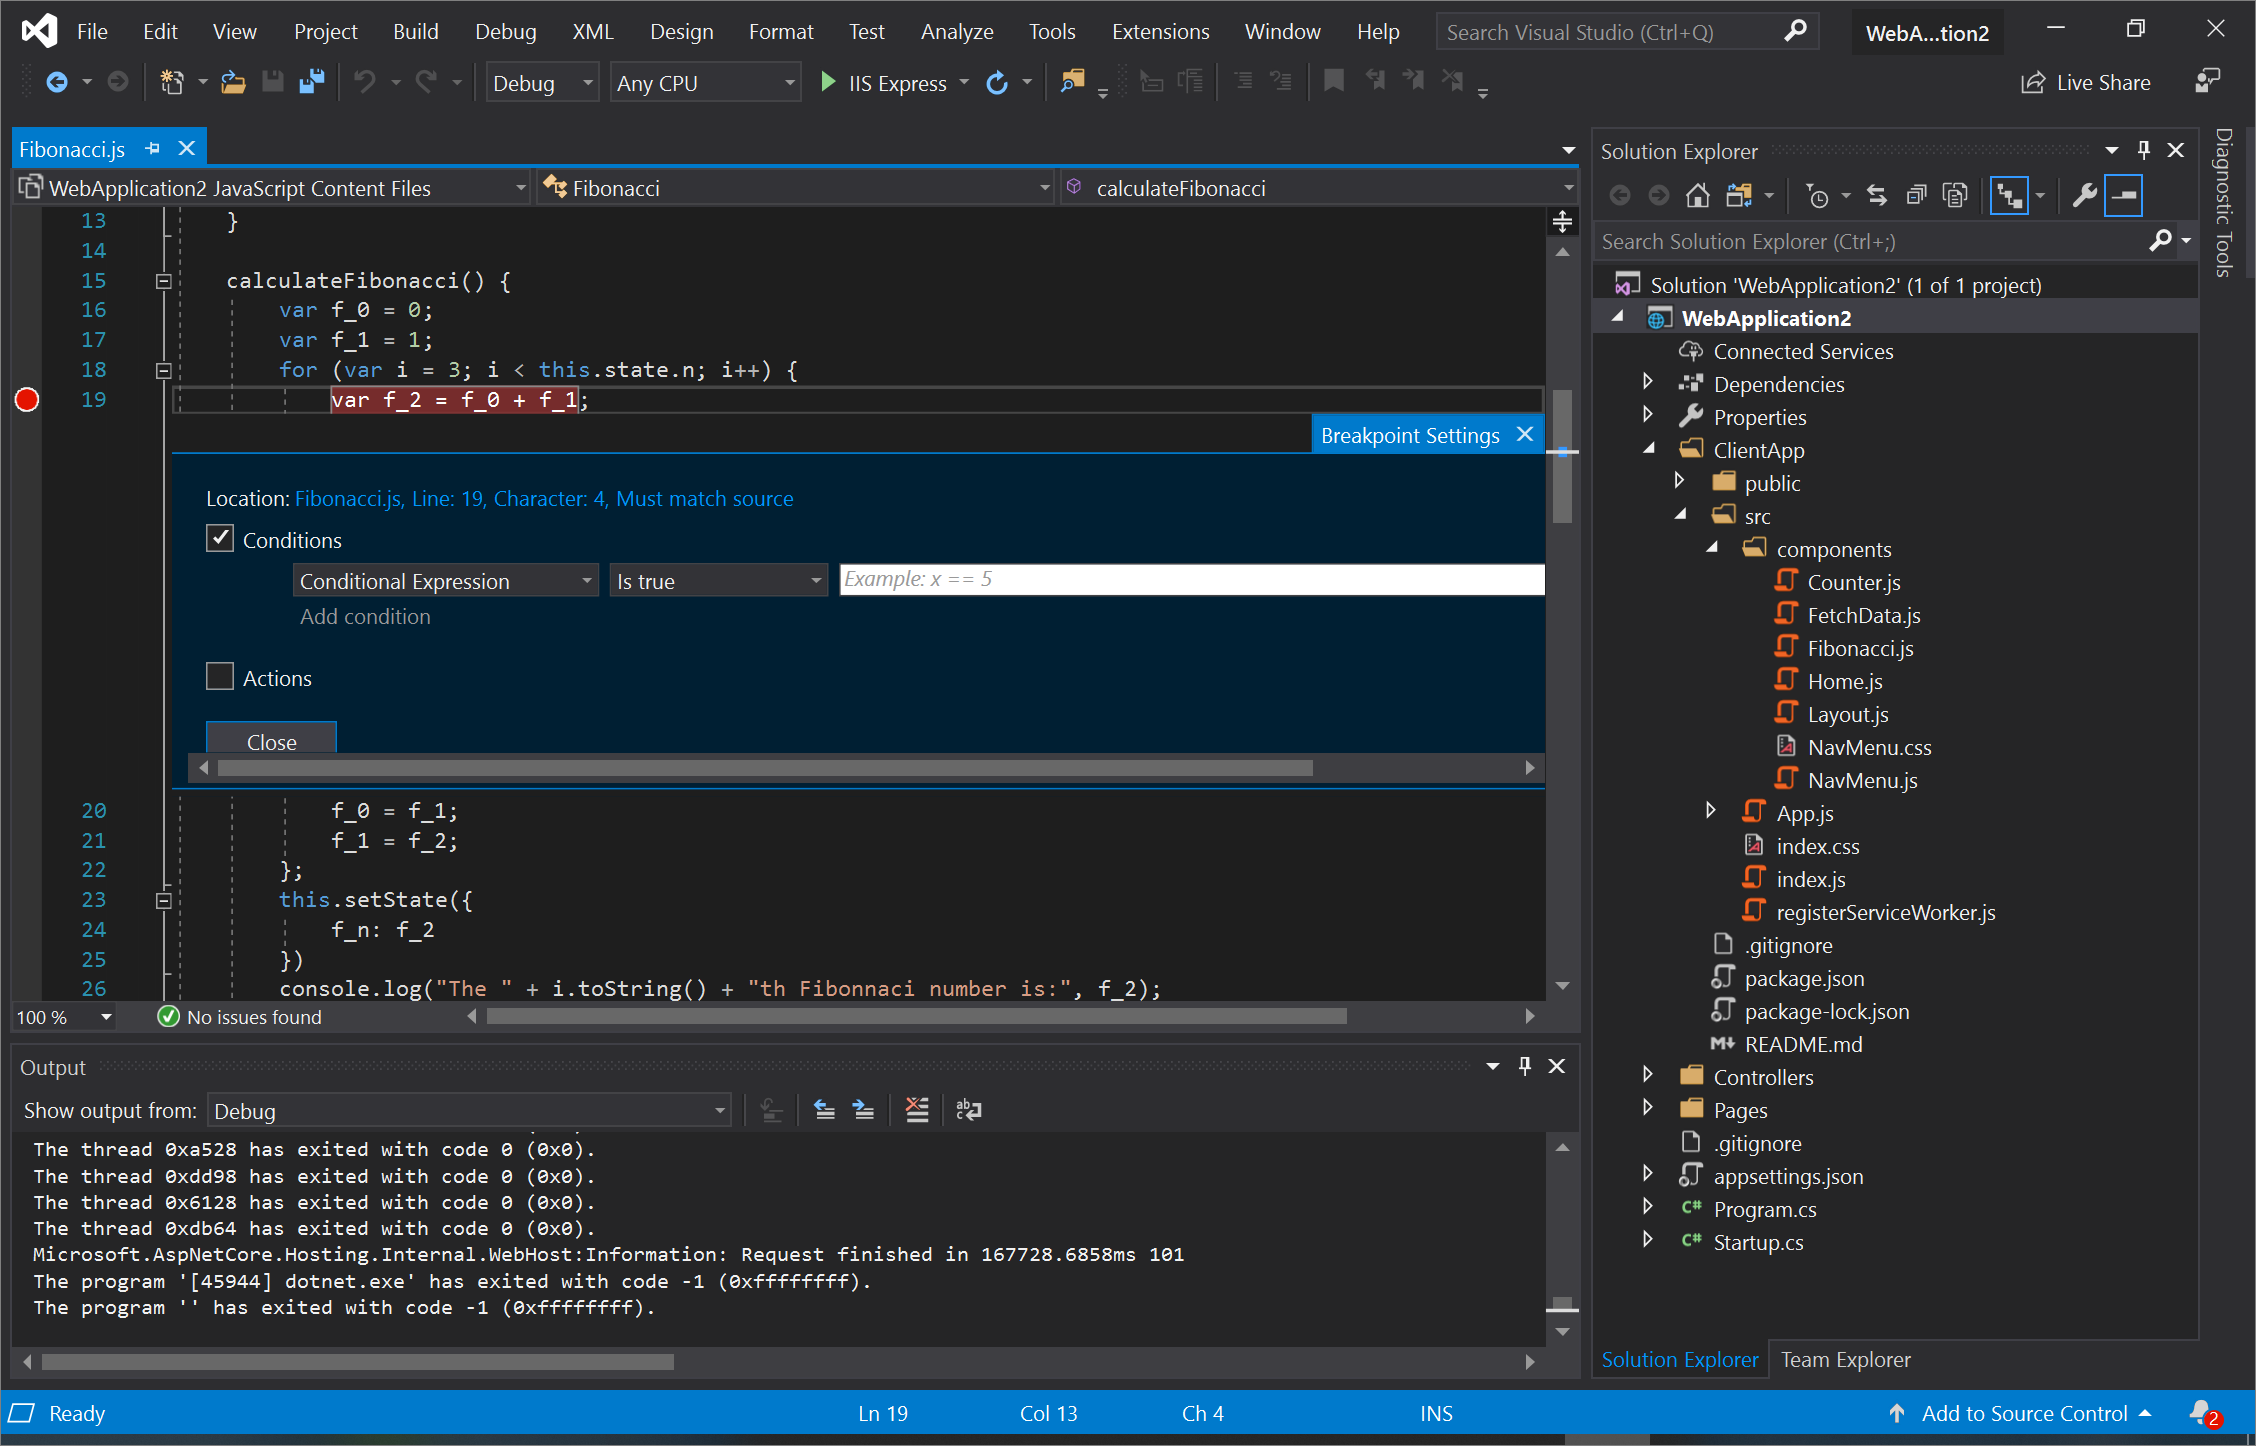
Enter i == 7 as the condition we want to break on, which means we’ll only break in the last loop before we see the bug. Start your web app again by clicking the green Play button or pressing F5. This time, we’ll break only when i is 7. Here’s what Visual Studio looks like now:
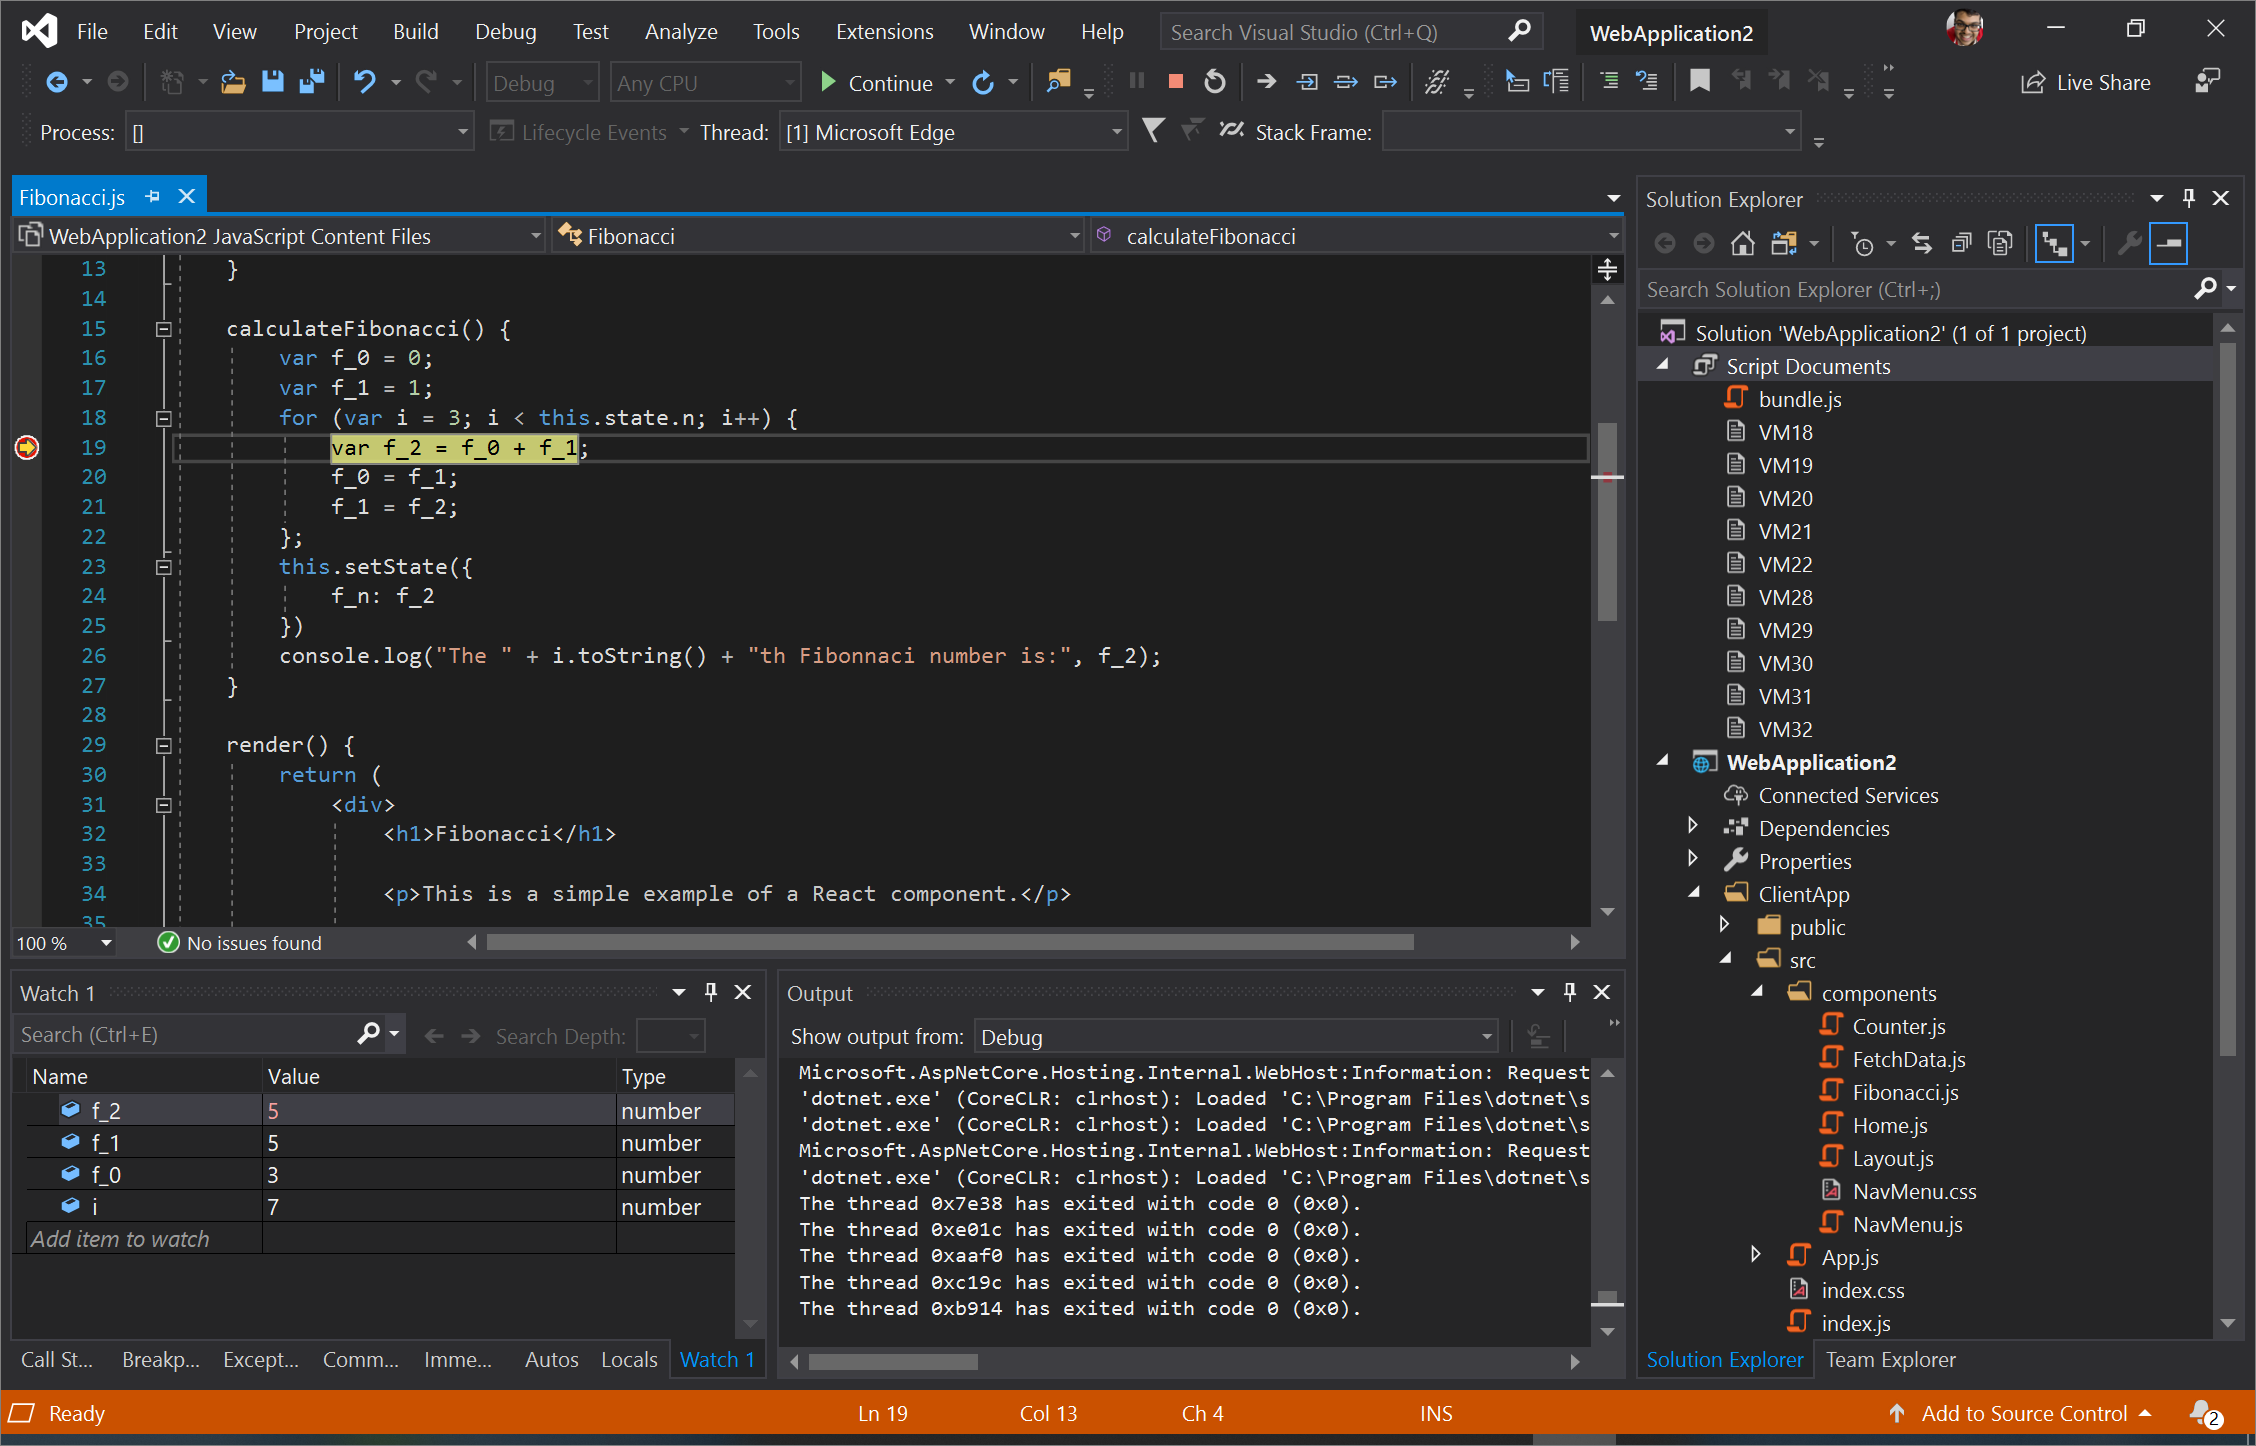
Step over once and you will see that we’ve calculated the 7th term in the Fibonacci sequence correctly since f_2 is equal to 8.
Step over three times and we’ll now be paused at i < n. Since i is now 8, i < n actually evaluates to false which means we’re going to break out of the loop. We’ve found the bug: we aren’t going through the loop to calculate the 8th Fibonacci number!
We can fix this bug by changing the calculateFibonacci() function to:
calculateFibonacci() {
  var f_0 = 0;
  var f_1 = 1;
  for (var i = 3; i <= this.state.n; i++) {
    var f_2 = f_0 + f_1;
    f_0 = f_1;
    f_1 = f_2;
  };
  this.setState({
    f_n: f_2
  })
  console.log("The " + (i - 1).toString() + "th Fibonnaci number is:", f_2);
}
Now when i is 8, we’ll actually go through the for loop since since 8 <= 8. Remove the breakpoint, click the Restart button next to the Stop button or press Ctrl+Shift+F5. Click on Fibonacci in the NavMenu and click on the Calculate button to see that we’ve correctly calculated the 8th term in the Fibonacci sequence as 13! We did it!
Attaching to Microsoft Edge
So far in this post, we’ve been using the green Play button in Visual Studio to build our web application, launch Microsoft Edge, and automatically have Edge navigate to our app. Starting in Visual Studio 2019 version 16.3 Preview 3, you can now attach the Visual Studio debugger to an already running instance of Microsoft Edge.
First, ensure that there are no running instances of Microsoft Edge. Now, from your terminal, run the following command:
start msedge –remote-debugging-port=9222
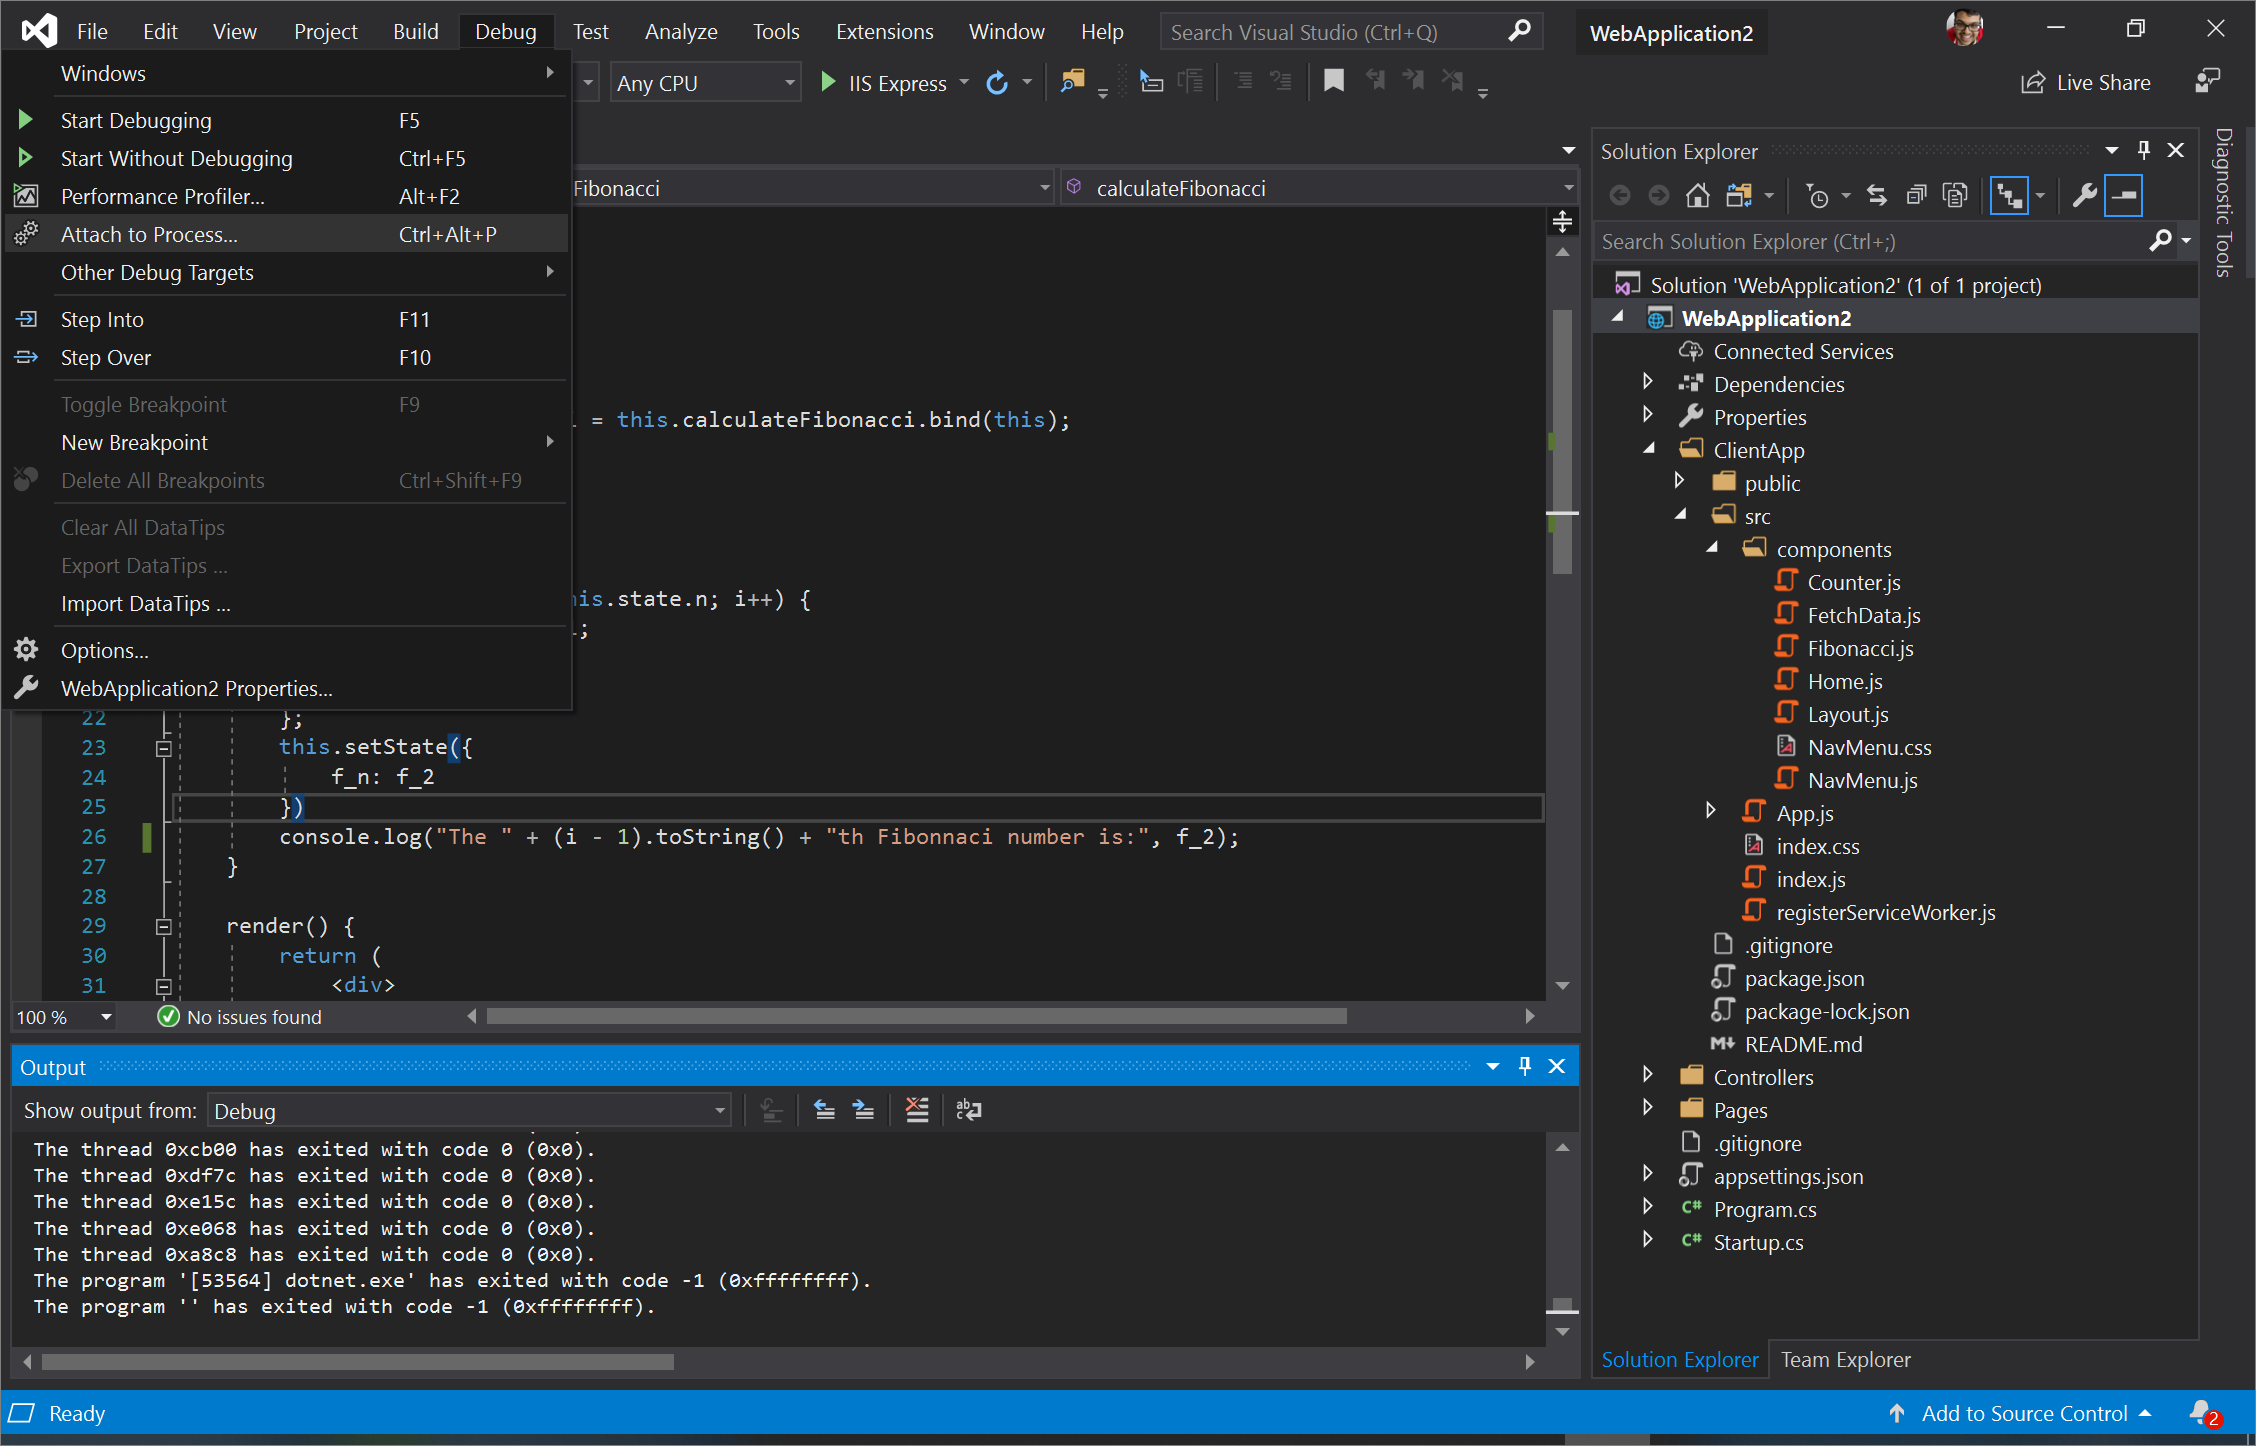
From Visual Studio, open the Debug menu and select Attach to Process or press Ctrl+Alt+P.
From the Attach to Process dialog, set Connection type to Chrome devtools protocol websocket (no authentication). In the Connecting target textbox, type in http://localhost:9222/ and press Enter. You should see the list of open tabs you have in Microsoft Edge listed out in the Attach to Process dialog.

Click Select… and check JavaScript (Microsoft Edge – Chromium). You can add tabs, navigate to new tabs, and close tabs and see those changes reflected in the Attach to Process dialog by clicking the Refresh button. Select the tab you want to debug and click Attach.
The Visual Studio debugger is now attached to Microsoft Edge! You can pause execution of JavaScript, set breakpoints, and see console.log() statements directly in the Debug Output window in Visual Studio.
Conclusion
To recap:
- We created an ASP.NET Core web application in Visual Studio 2019 version 16.2 and built it in a preview build of Microsoft Edge
- We added a new component to our web application that contained a bug
- We found the bug by setting breakpoints and debugging our web app running in Microsoft Edge from Visual Studio!
- We showed you how to attach the Visual Studio debugger to an existing instance of Microsoft Edge
We’re eager to learn more about how you work with JavaScript in Visual Studio! Please send us feedback by clicking the Feedback icon in Visual Studio or by tweeting @VisualStudio and @EdgeDevTools.

Thanks for this excellent posting. Can you please provide a similar recipe for Electron debugging ? Having much difficulty. Followed the nodejs project template and process. Replaced the node executable to Electron executable. Not able to make either scenario work/connect to debugger. Both the main process and render process. I can send a sample file. This was constructed from https://github.com/greggman/electron-hello-world and a debug recipe here https://github.com/microsoft/vscode-recipes/tree/master/Electron