


Watch behind the scenes of the Profiler Agent
We’re excited to announce the Copilot Profiler Agent available in Visual Studio 2026 Insiders, it’s an AI-powered performance assistant built directly into Visual Studio. Forget staring at endless call trees or walls of mysterious numbers that leave you asking, “where do I even start?” The Copilot Profiler Agent changes that.
Instead of raw data, you now get an AI partner that not only points out the real bottlenecks but also explains what’s going on, suggests fixes, writes benchmarks, and even validates improvements all in a smooth, guided loop.
It’s like having a performance engineer sitting next to you. Without the coffee runs. And starting today, it’s ready for action in the latest version of Visual Studio, powered by GitHub Copilot. Download Visual Studio 2026 Insiders today.
Copilot Profiler Agent
Meet the Copilot Profiler Agent
The Profiler Agent is the first-of-its-kind AI assistant in Visual Studio, designed to work seamlessly with GitHub Copilot.
Here’s what it can do for you:
-
Analyze CPU usage, memory allocations, and runtime behavior
-
Surface the most expensive bottlenecks in your code
-
Generate new BenchmarkDotNet benchmarks (or optimize existing ones)
-
Suggest actionable performance improvements you can apply instantly
-
Validate fixes with before/after metrics, all in a smooth guided loop
And the best part, it’s as easy as asking a question in Copilot Chat. You can:
-
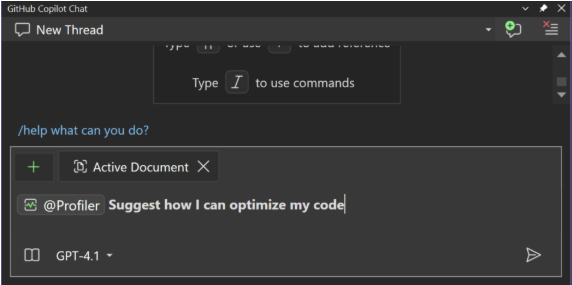
Tag it directly:
@profiler Why is my app slow? -
Or just ask in plain language in Copilot agent mode: “Why is my frame rate dropping?”
(Just make sure the Profiler Agent is enabled in the Copilot Chat tool menu.)
Now, let’s take a look at it in action. In the demo below, you will see I pointed the agent at an existing benchmark in SharpZipLib and asked it to optimize. From there, it handled everything: running the benchmark, guiding me through the changes, applying targeted performance fixes, and validating the results by re-running the benchmark. The result was a measurable performance improvement, all from a single prompt.
Real Code. Real Impact
When we set out to build the Copilot Profiler Agent, we knew one thing for sure: showing it off on a “hello world” app wasn’t going to prove anything. Real developers don’t struggle with toy code. The real test was whether it could handle messy, performance-critical, production-grade projects.
So we aimed high: pointing the Profiler Agent at the top 100 most widely used open-source libraries and applications the kind of code that powers frameworks, services, and apps you probably use every single day.
The results blew past our expectations. The Profiler Agent :
- Surfaced hidden bottlenecks you wouldn’t spot on your own
- Suggested practical, actionable fixes
- Auto-generated benchmarks to validate improvements
- Turned insights into real pull requests on real projects
We’ve already contributed PRs to CSVHelper, NLog, Serilog, and more all powered by the Profiler Agent’s insights.
And the feedback from the community says it all:
Saw the YouTube video and it is almost magical. Amazing how it was able to recognize that multiple expression-compiles could be merged into a single expression-compile.– NLog Maintainer
We’ll be publishing a detailed case studies soon, walking through exactly how the Profiler Agent tackled these projects step by step.
This isn’t just OSS, either. We rolled out the Profiler Agent for internal dogfooding across Microsoft teams, and the results have been equally eye-opening.
Here’s one story from a Principal Engineer:
I had a class that wrapped a dictionary and exposed a limited set of operations. I wanted to support foreach on the class, so I added IEnumerable<TKey, TValue>, but this caused a big jump in memory use and execution time compared to iterating directly over the inner dictionary. After several prompt iterations with the profiler agent, it nudged me toward the realization that .NET supports duck typing for foreach. I didn’t need IEnumerable at all just exposing GetEnumerator that forwards to the inner dictionary worked.
Honestly, I’m not sure I would have figured this out on my own. I even asked several principal-level engineers with deep .NET experience, and none of them knew about this either. When focused on allocation optimization, the profiler agent does a great job of spotting improvements.
What’s Next
This is just the beginning. The Profiler Agent currently supports high CPU usage analysis and .NET object allocations and memory usage analysis and more coming soon.
We’re excited to see how you use this in your own workflows whether it’s tuning a game engine, optimizing a service, or just speeding up a slow UI. So please try it out and don’t forget to Share your results by taking this short survey.
Stay connected with the Visual Studio team by following us on Twitter @VS_Debugger, Twitter @VisualStudio, YouTube, and LinkedIn.
Democratizing profiling, one performance wins at a time. 😊
Does it work with VS COde anyway?
Enough already, no one asked for or wants any of this Copilot AI garbage. 30 year developer and I can’t abandon this insane platform fast enough. This stuff is out of control.
If you’re trying to avoid Copilot, AI assistants, and all the tooling around them, your only real options are editors like Notepad++, Vim, Nano, or even MS Edit. AI integration is becoming standard across major IDEs, including JetBrains Rider, VS Code, IntelliJ, Cursor, and Claude (the last two are AI-native by design). It’s not just a trend anymore; it’s the new baseline.
Impressive work on the Copilot Profiler Agent! Making performance insights actionable right inside Visual Studio is a huge win for developers.